| Param | Original file | Final file |
|---|---|---|
| Filename | modeM0/AS1A12_022T01_9000005540_40502cztM0_level2.fits | modeM0/AS1A12_022T01_9000005540_40502cztM0_level2_quad_clean.evt |
| Size (bytes) | 324,717,120 | 86,492,160 |
| Size | 309.7 MB | 82.5 MB |
| Events in quadrant A | 2,743,972 | 599,747 |
| Events in quadrant B | 2,775,582 | 614,128 |
| Events in quadrant C | 2,488,166 | 580,975 |
| Events in quadrant D | 3,606,303 | 459,753 |
| Mode M0 | |||
|---|---|---|---|
| Quadrant | BADHDUFLAG | Total packets | Discarded packets |
| A | 0 | 11234 | 3 |
| B | 0 | 11865 | 2 |
| C | 0 | 10659 | 2 |
| D | 0 | 14306 | 2 |
| Mode M9 | |||
|---|---|---|---|
| Quadrant | BADHDUFLAG | Total packets | Discarded packets |
| A | 0 | 19 | 0 |
| B | 0 | 19 | 0 |
| C | 0 | 19 | 0 |
| D | 0 | 20 | 0 |
| Mode SS | |||
|---|---|---|---|
| Quadrant | BADHDUFLAG | Total packets | Discarded packets |
| A | 0 | 106 | 0 |
| B | 0 | 106 | 0 |
| C | 0 | 106 | 0 |
| D | 0 | 106 | 0 |
| Quadrant | Total seconds | Saturated seconds | Saturation percentage |
|---|---|---|---|
| A | 5199 | 11 | 0.211579% |
| B | 5199 | 54 | 1.038661% |
| C | 5199 | 7 | 0.134641% |
| D | 5199 | 924 | 17.772649% |
Noise dominated data is calculated using 1-second bins in cleaned event files. If a bin has >2000 counts, and if more than 50% of those come from <1% of pixels, then it is considered to be noise-dominated and hence unusable.
| Quadrant | # 1 sec bins | Bins with >0 counts | Bins with >2000 counts | High rate bins dominated by noise | Noise dominated (total time) | Noise dominated (detector-on time) | Marked lightcurve |
|---|---|---|---|---|---|---|---|
| A | 7081 | 5200 | 3 | 3 | 0.04% | 0.06% | 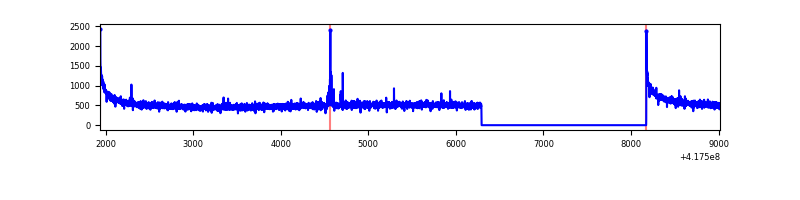 |
| B | 7081 | 5200 | 28 | 28 | 0.40% | 0.54% | 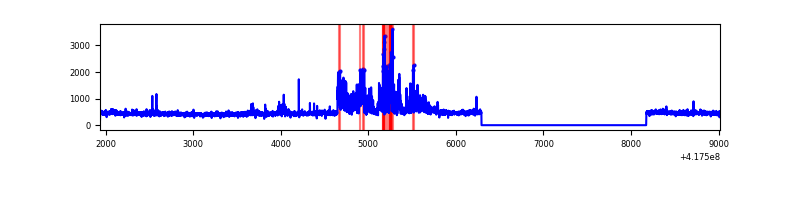 |
| C | 7081 | 5200 | 6 | 6 | 0.08% | 0.12% | 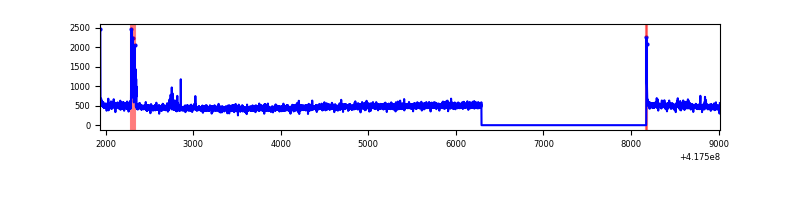 |
| D | 7081 | 5199 | 292 | 292 | 4.12% | 5.62% | 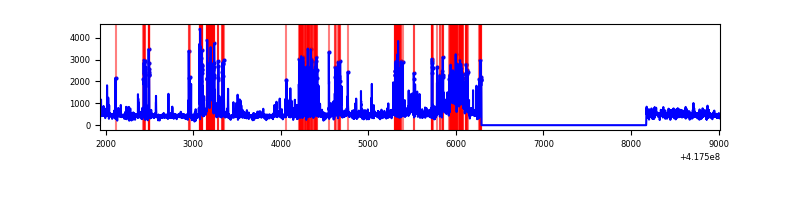 |
Top three noisy pixels from each quadrant. If the there are fewer than three noisy pixels in the level2.evt file, extra rows are filled as -1
| Pixel properties | Quadrant properties | ||||||
|---|---|---|---|---|---|---|---|
| Quadrant | DetID | PixID | Counts | Sigma | Mean | Median | Sigma |
| A | 10 | 83 | 476301 | 4020.57 | 579 | 567 | 118.3 |
| A | 13 | 248 | 19015 | 155.91 | 579 | 567 | 118.3 |
| A | 3 | 137 | 6369 | 49.03 | 579 | 567 | 118.3 |
| B | 4 | 171 | 467930 | 4267.41 | 570 | 556 | 109.5 |
| B | 3 | 112 | 36647 | 329.53 | 570 | 556 | 109.5 |
| B | 5 | 255 | 17159 | 151.6 | 570 | 556 | 109.5 |
| C | 15 | 214 | 228044 | 1764.85 | 556 | 559 | 128.9 |
| C | 14 | 254 | 51112 | 392.19 | 556 | 559 | 128.9 |
| C | 9 | 146 | 11904 | 88.01 | 556 | 559 | 128.9 |
| D | 12 | 128 | 464404 | 3634.44 | 514 | 498 | 127.6 |
| D | 2 | 250 | 396730 | 3104.25 | 514 | 498 | 127.6 |
| D | 12 | 0 | 298517 | 2334.81 | 514 | 498 | 127.6 |
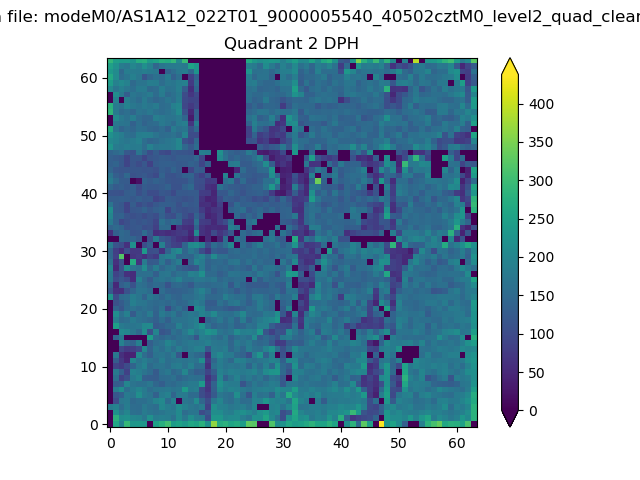
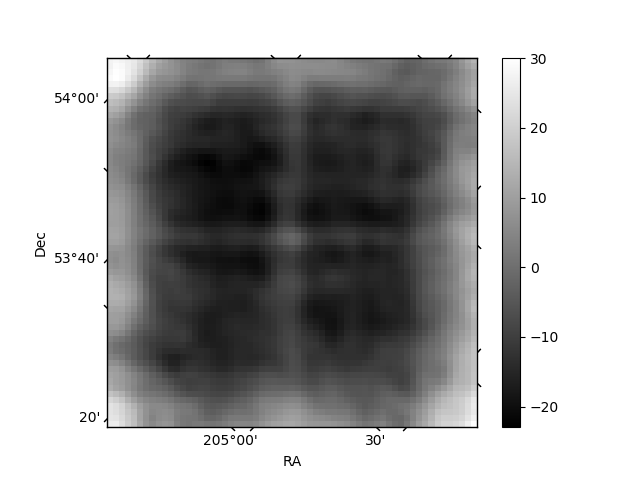
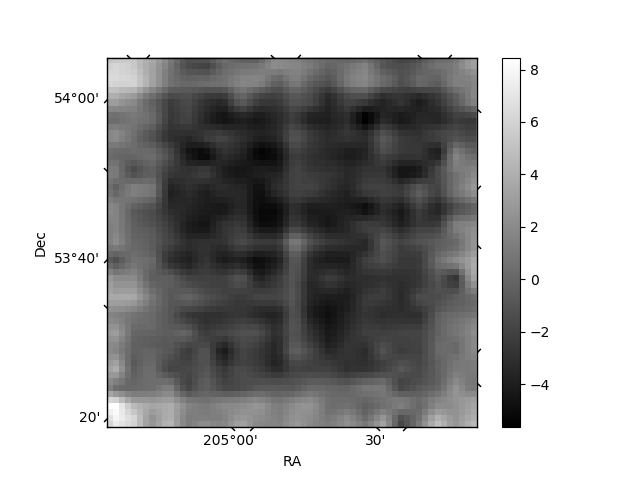
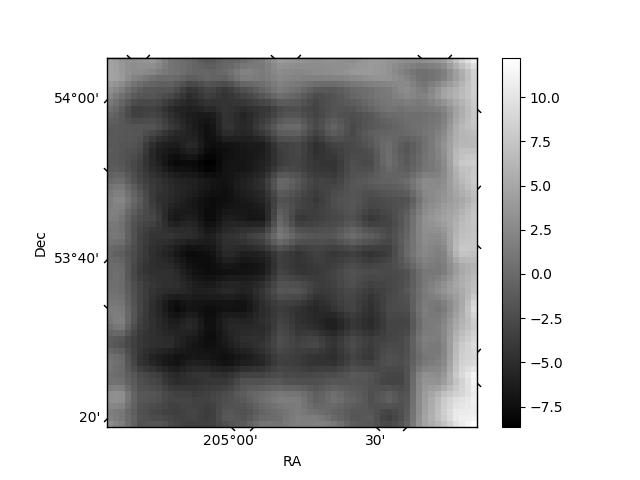
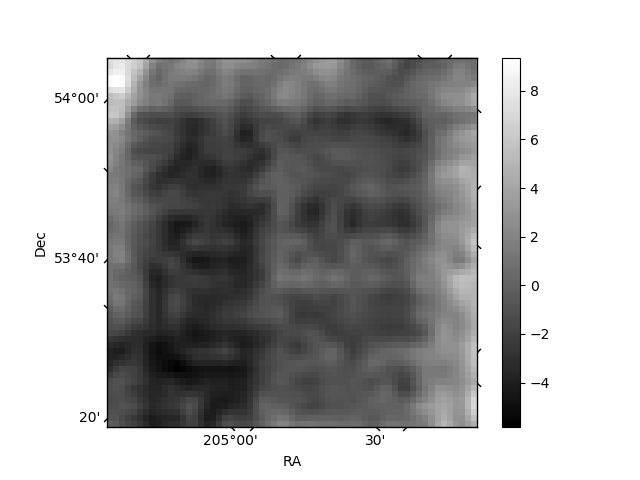
Histogram calculated using DETX and DETY for each event in the final _common_clean file
| Quadrant A | 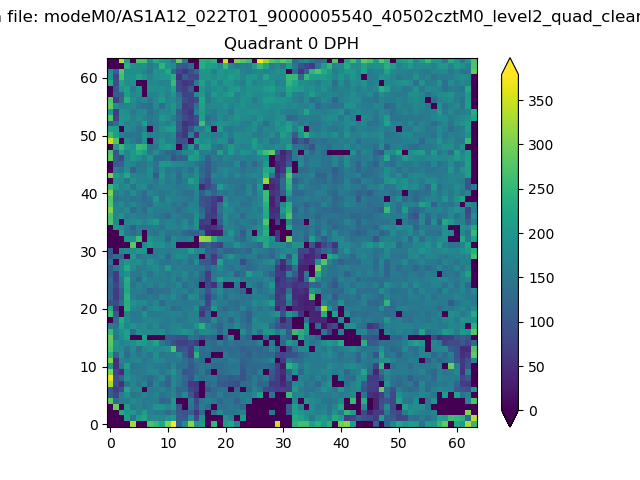 |
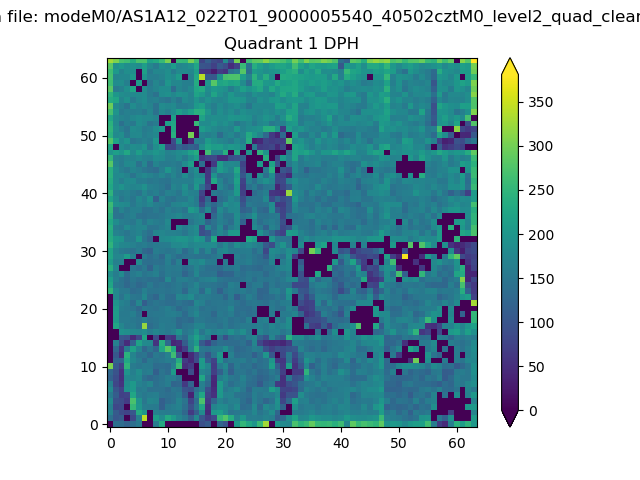 |
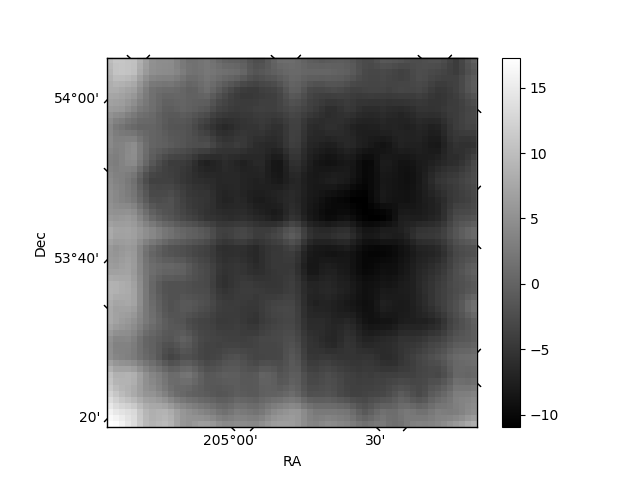
Quadrant B |
|---|---|---|---|
| Quadrant D | 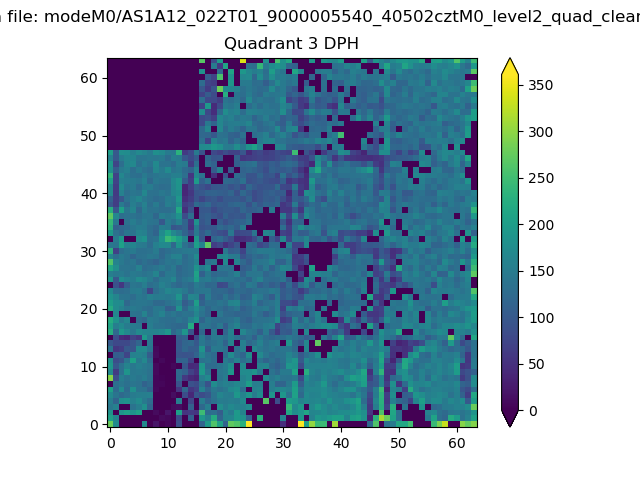 |
 |
Quadrant C |
| Plot type | Count rate plots | Images |
|---|---|---|
| Comparison with Poisson distribution Blue bars denote a histogram of data divided into 1 sec bins. Red curve is a Poisson curve with rate = median count rate of data. |
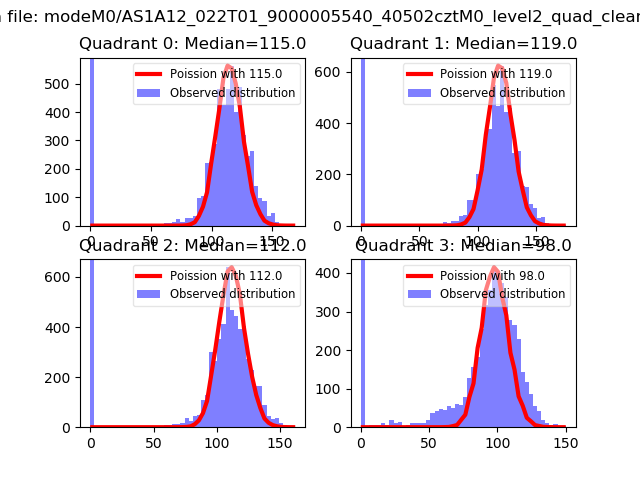 |
 |
| Quadrant-wise count rates Data is divided into 100 sec bins |
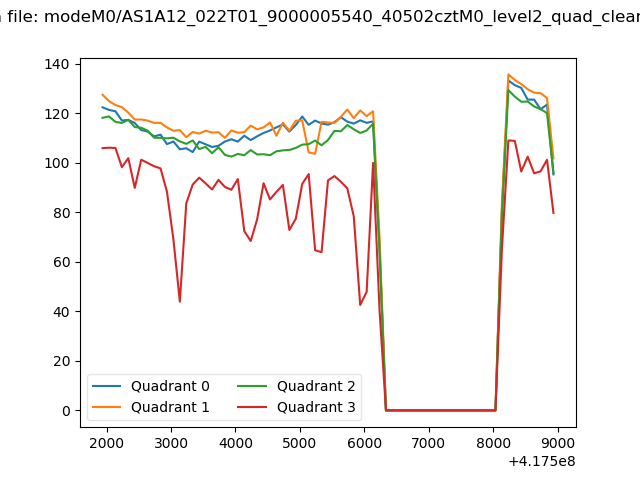 |
|
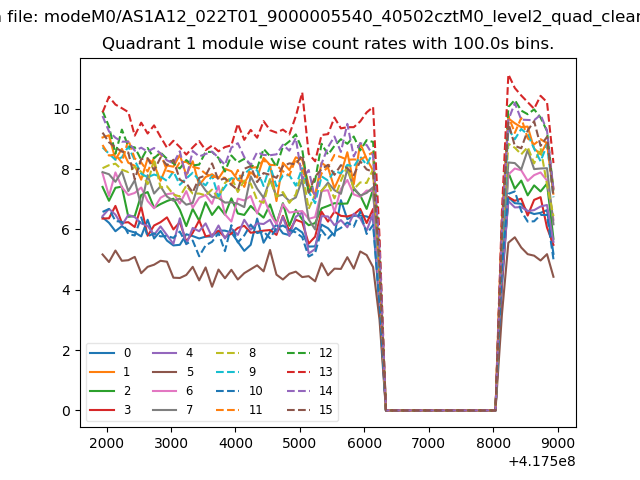
| Module-wise count rates for Quadrant A Data is divided into 100 sec bins |
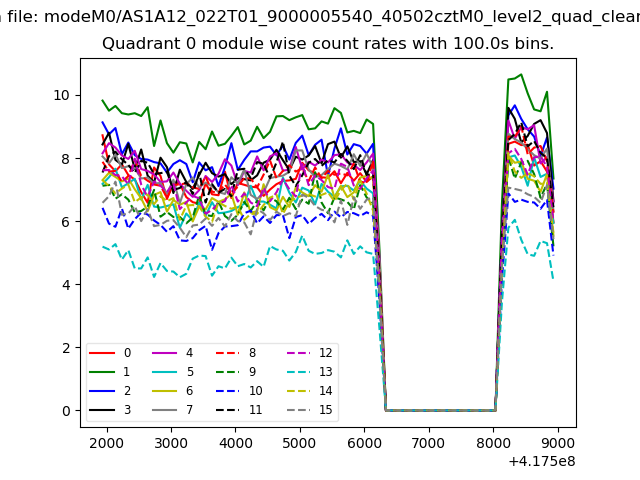 |
 |
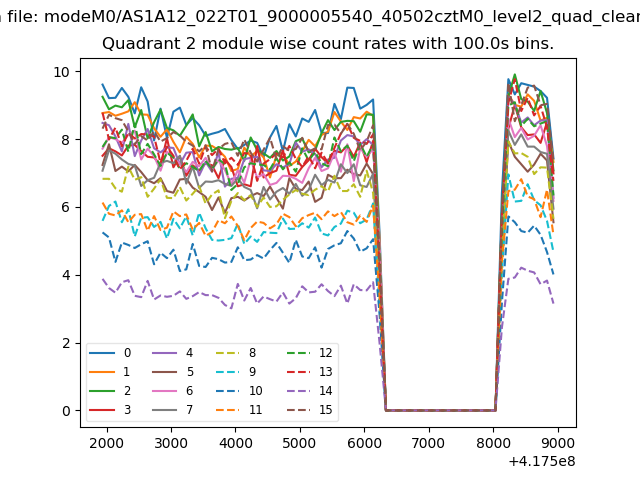
| Module-wise count rates for Quadrant B Data is divided into 100 sec bins |
 |
 |
| Module-wise count rates for Quadrant C Data is divided into 100 sec bins |
 |
 |
| Module-wise count rates for Quadrant D Data is divided into 100 sec bins |
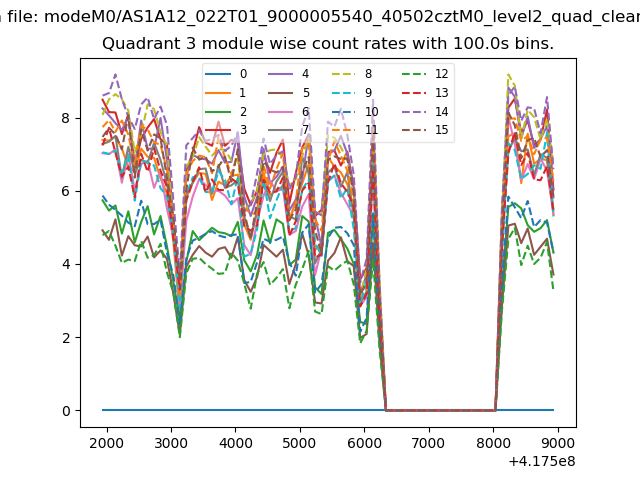 |
 |
| Parameter | Plot |
|---|---|
| CZT HV Monitor | 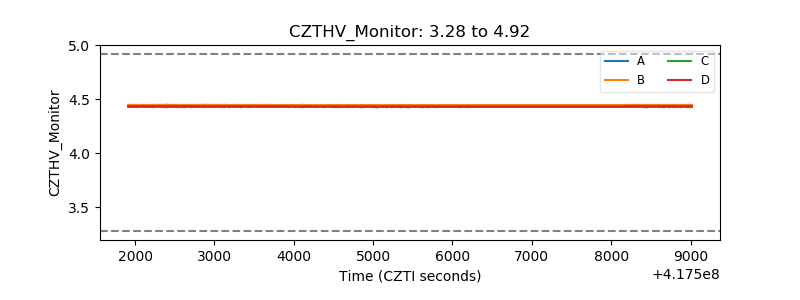 |
| D_VDD | 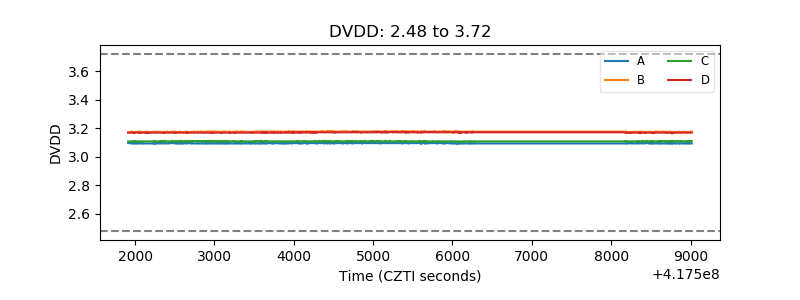 |
| Temperature 1 | 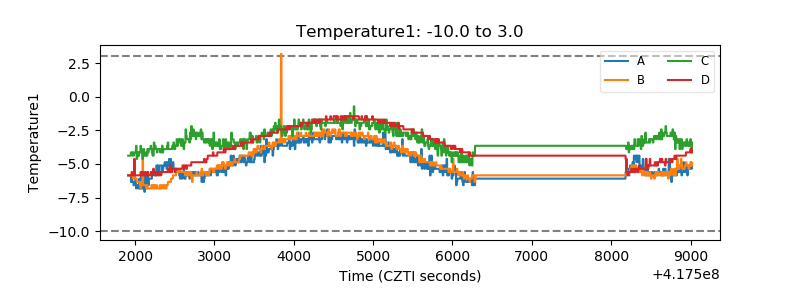 |
| Veto HV Monitor |  |
| Veto LLD | 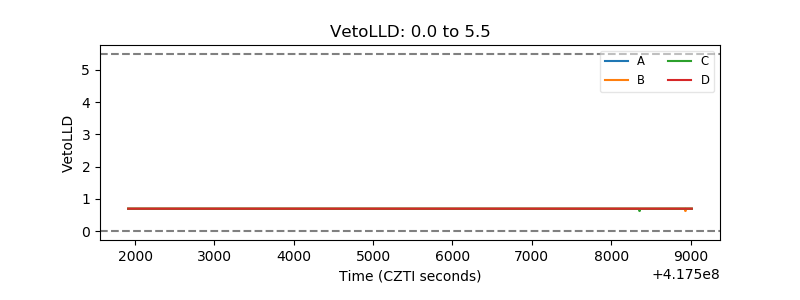 |
| Alpha Counter | 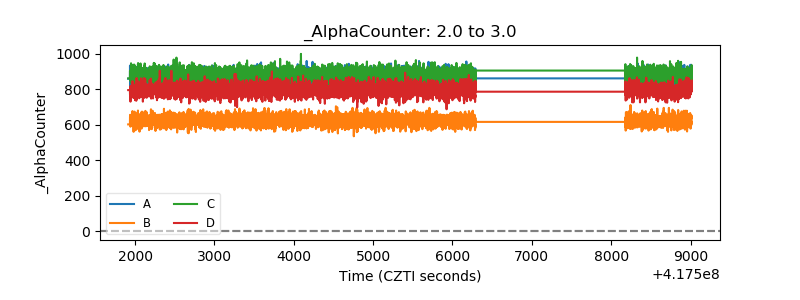 |
| _CPM_Rate | 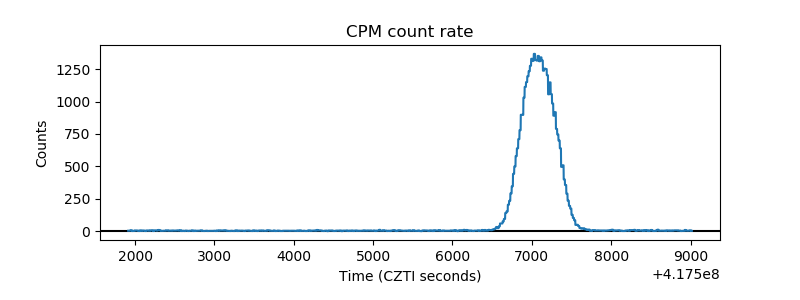 |
| CZT Counter | 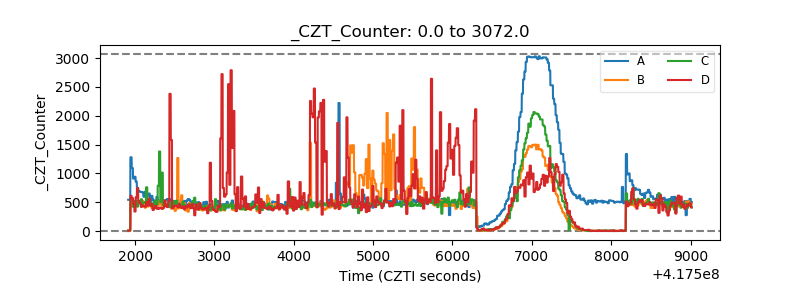 |
| +2.5 Volts monitor | 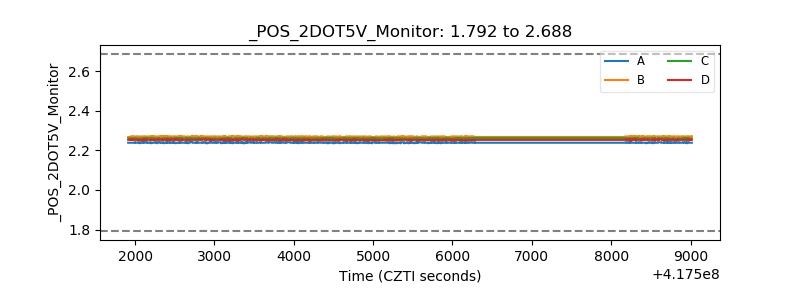 |
| +5 Volts monitor | 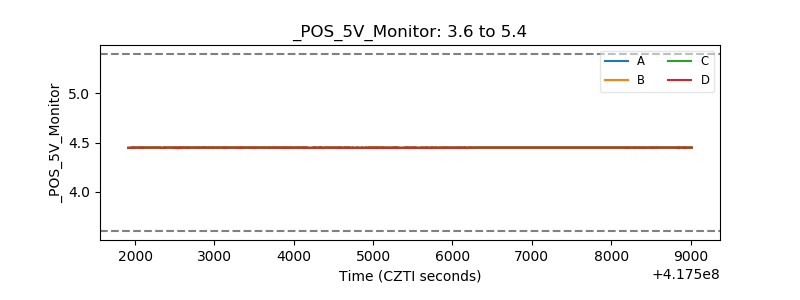 |
| _ROLL_ROT | 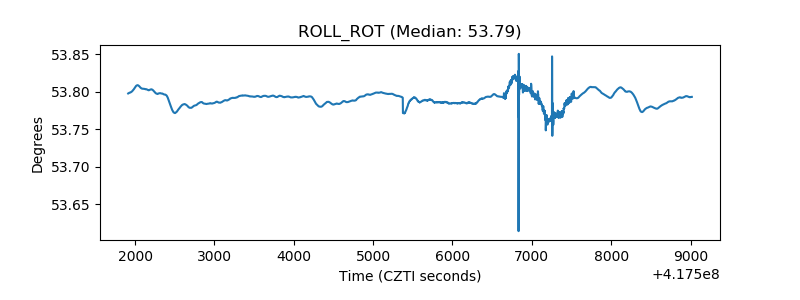 |
| _Roll_DEC | 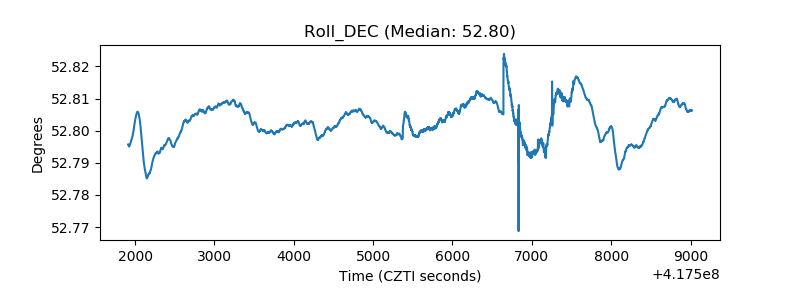 |
| _Roll_RA | 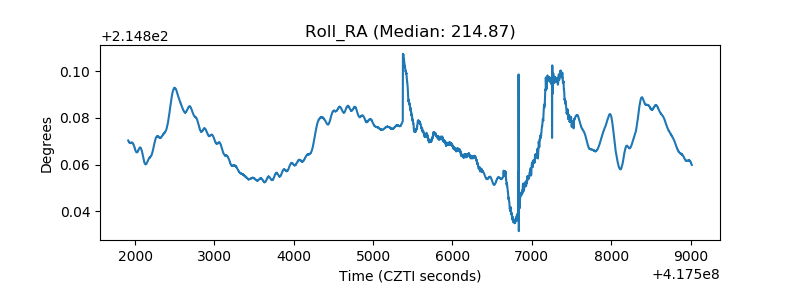 |
| Veto Counter | 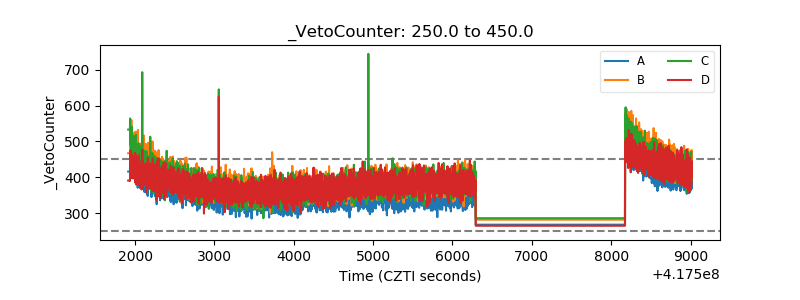 |