| Param | Original file | Final file |
|---|---|---|
| Filename | modeM0/AS1A12_022T01_9000005540_40503cztM0_level2.fits | modeM0/AS1A12_022T01_9000005540_40503cztM0_level2_quad_clean.evt |
| Size (bytes) | 321,995,520 | 86,232,960 |
| Size | 307.1 MB | 82.2 MB |
| Events in quadrant A | 2,708,603 | 606,670 |
| Events in quadrant B | 2,325,161 | 620,253 |
| Events in quadrant C | 2,775,837 | 573,214 |
| Events in quadrant D | 3,720,108 | 461,126 |
| Mode M0 | |||
|---|---|---|---|
| Quadrant | BADHDUFLAG | Total packets | Discarded packets |
| A | 0 | 10952 | 3 |
| B | 0 | 10167 | 2 |
| C | 0 | 11209 | 2 |
| D | 0 | 14406 | 2 |
| Mode M9 | |||
|---|---|---|---|
| Quadrant | BADHDUFLAG | Total packets | Discarded packets |
| A | 0 | 23 | 0 |
| B | 0 | 23 | 0 |
| C | 0 | 23 | 0 |
| D | 0 | 24 | 0 |
| Mode SS | |||
|---|---|---|---|
| Quadrant | BADHDUFLAG | Total packets | Discarded packets |
| A | 0 | 102 | 0 |
| B | 0 | 102 | 0 |
| C | 0 | 102 | 0 |
| D | 0 | 102 | 0 |
| Quadrant | Total seconds | Saturated seconds | Saturation percentage |
|---|---|---|---|
| A | 4987 | 6 | 0.120313% |
| B | 4987 | 14 | 0.280730% |
| C | 4987 | 80 | 1.604171% |
| D | 4987 | 957 | 19.189894% |
Noise dominated data is calculated using 1-second bins in cleaned event files. If a bin has >2000 counts, and if more than 50% of those come from <1% of pixels, then it is considered to be noise-dominated and hence unusable.
| Quadrant | # 1 sec bins | Bins with >0 counts | Bins with >2000 counts | High rate bins dominated by noise | Noise dominated (total time) | Noise dominated (detector-on time) | Marked lightcurve |
|---|---|---|---|---|---|---|---|
| A | 6990 | 4988 | 3 | 3 | 0.04% | 0.06% | 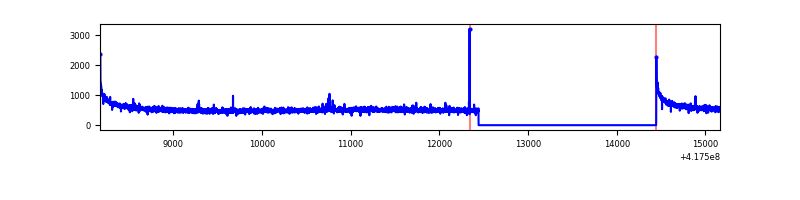 |
| B | 6990 | 4988 | 10 | 10 | 0.14% | 0.20% | 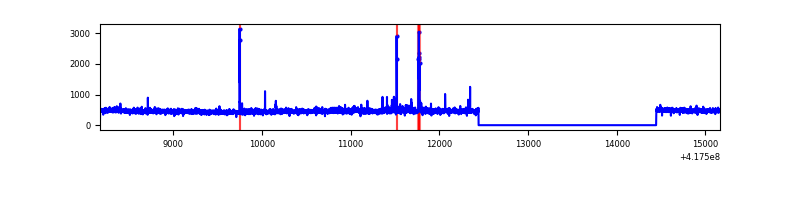 |
| C | 6990 | 4988 | 76 | 76 | 1.09% | 1.52% | 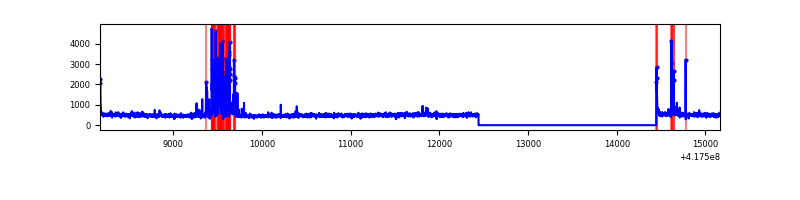 |
| D | 6990 | 4988 | 222 | 222 | 3.18% | 4.45% | 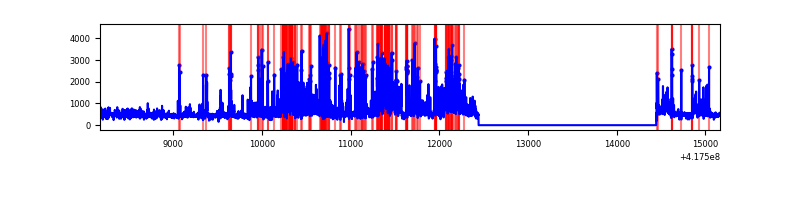 |
Top three noisy pixels from each quadrant. If the there are fewer than three noisy pixels in the level2.evt file, extra rows are filled as -1
| Pixel properties | Quadrant properties | ||||||
|---|---|---|---|---|---|---|---|
| Quadrant | DetID | PixID | Counts | Sigma | Mean | Median | Sigma |
| A | 10 | 83 | 458372 | 3921.02 | 575 | 564 | 116.8 |
| A | 13 | 248 | 8726 | 69.91 | 575 | 564 | 116.8 |
| A | 7 | 3 | 7459 | 59.05 | 575 | 564 | 116.8 |
| B | 5 | 255 | 40357 | 366.26 | 567 | 553 | 108.7 |
| B | 3 | 112 | 29619 | 267.45 | 567 | 553 | 108.7 |
| B | 4 | 171 | 27391 | 246.95 | 567 | 553 | 108.7 |
| C | 14 | 254 | 378847 | 2982.88 | 546 | 549 | 126.8 |
| C | 15 | 214 | 219007 | 1722.54 | 546 | 549 | 126.8 |
| C | 9 | 146 | 21759 | 167.24 | 546 | 549 | 126.8 |
| D | 2 | 250 | 678991 | 5426.08 | 508 | 495 | 125.0 |
| D | 12 | 128 | 327233 | 2613.0 | 508 | 495 | 125.0 |
| D | 12 | 227 | 219737 | 1753.33 | 508 | 495 | 125.0 |
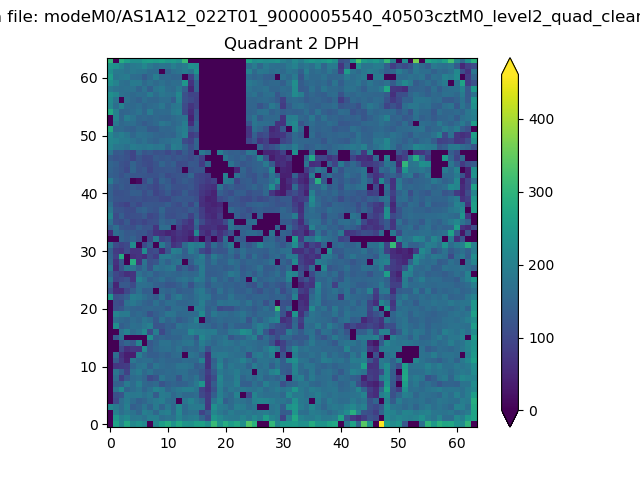
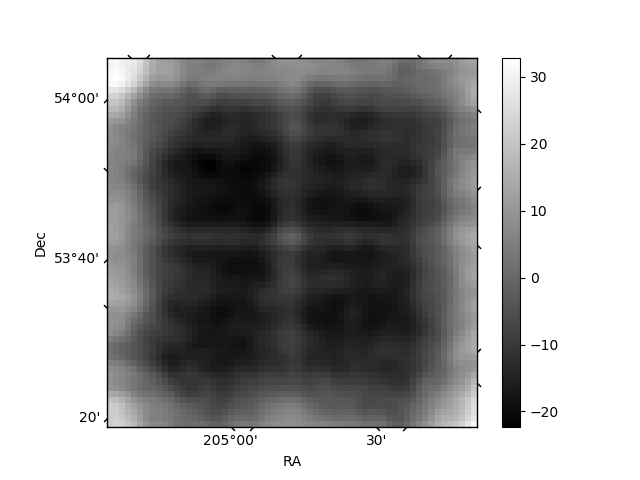
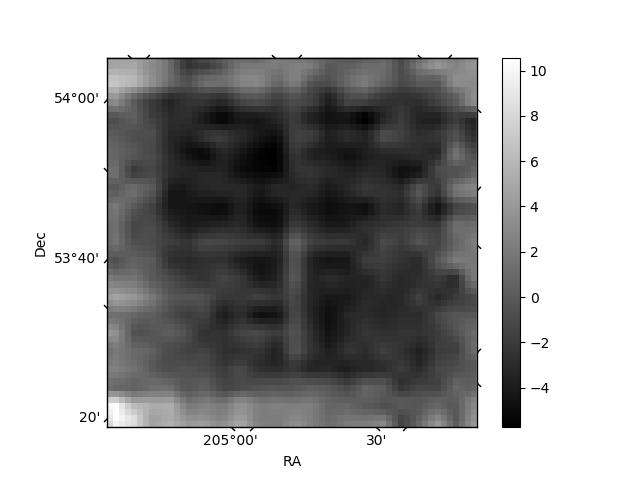
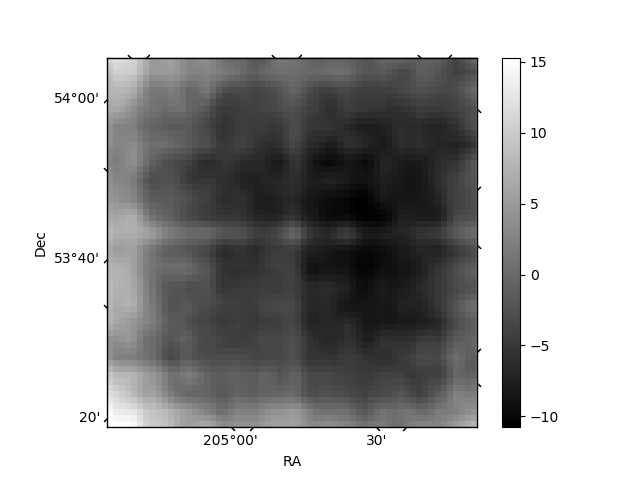
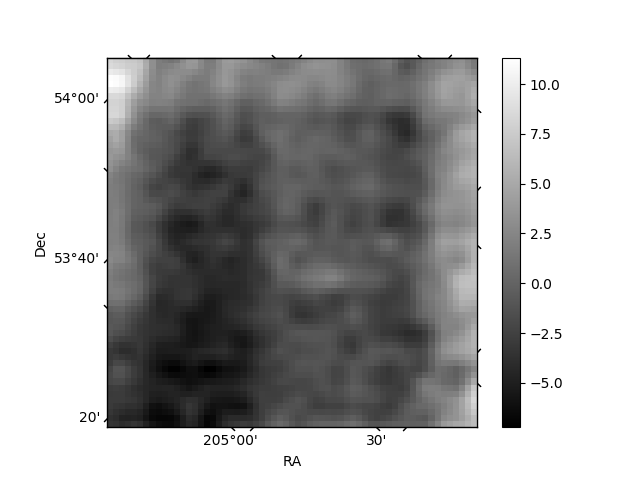
Histogram calculated using DETX and DETY for each event in the final _common_clean file
| Quadrant A | 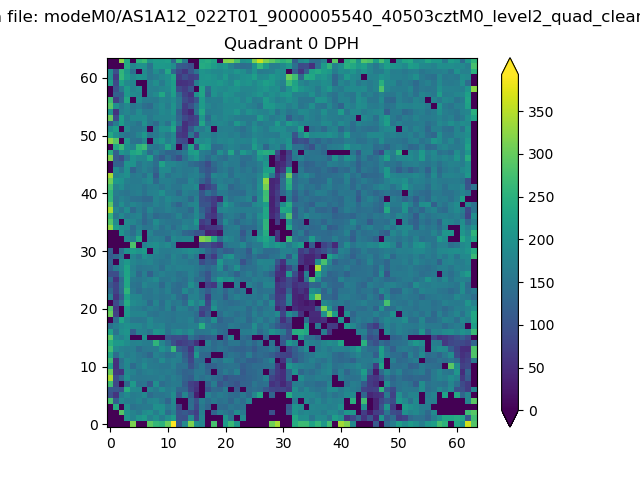 |
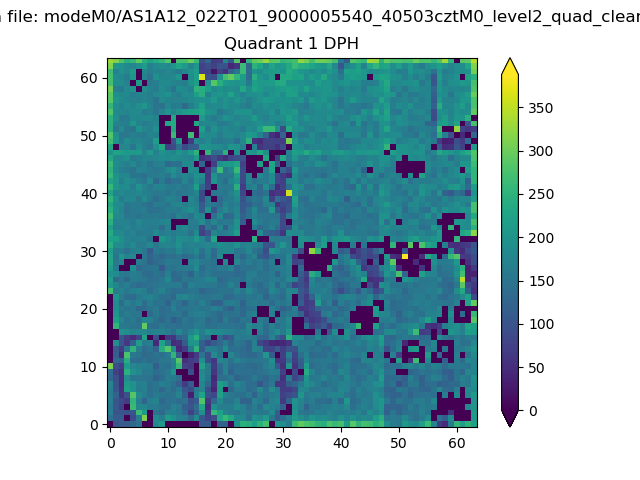 |
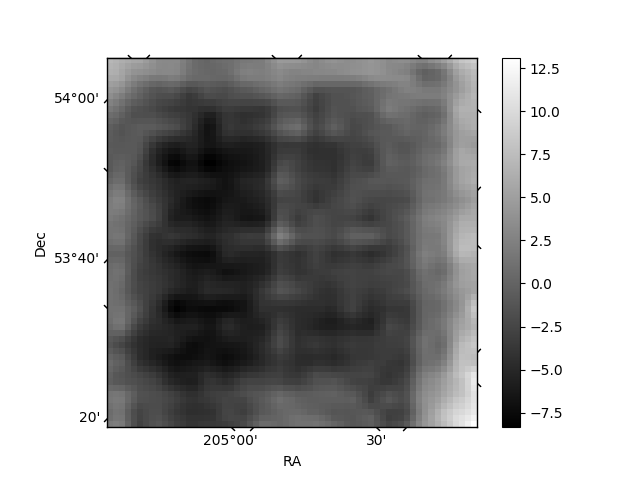
Quadrant B |
|---|---|---|---|
| Quadrant D | 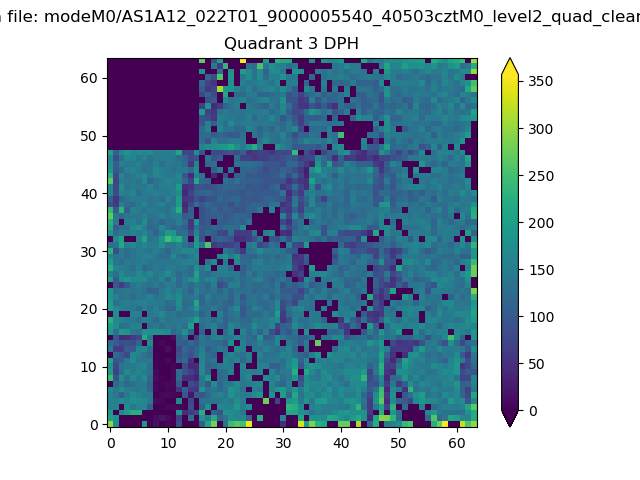 |
 |
Quadrant C |
| Plot type | Count rate plots | Images |
|---|---|---|
| Comparison with Poisson distribution Blue bars denote a histogram of data divided into 1 sec bins. Red curve is a Poisson curve with rate = median count rate of data. |
 |
 |
| Quadrant-wise count rates Data is divided into 100 sec bins |
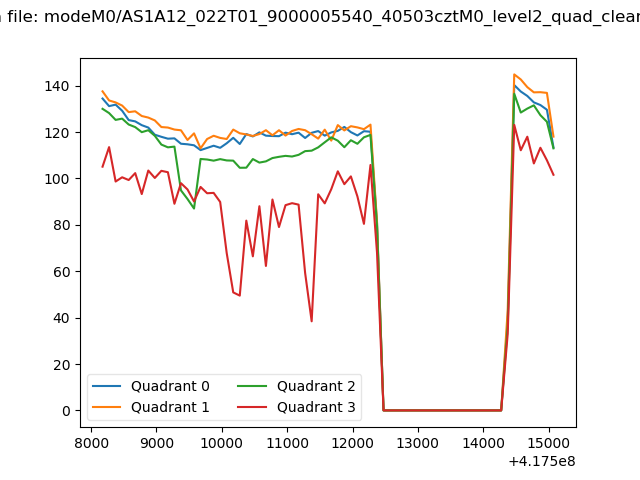 |
|
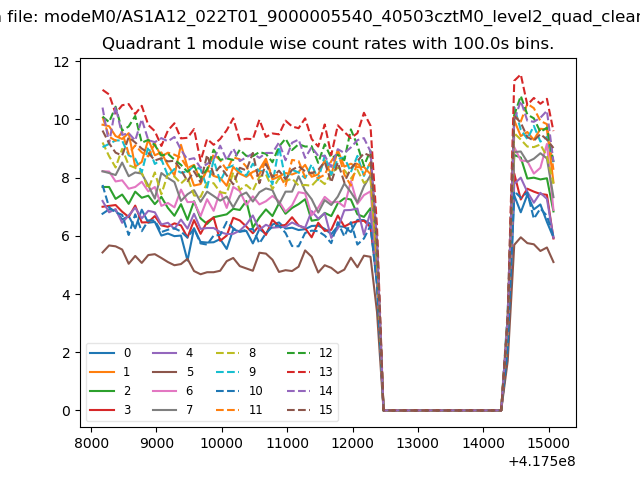
| Module-wise count rates for Quadrant A Data is divided into 100 sec bins |
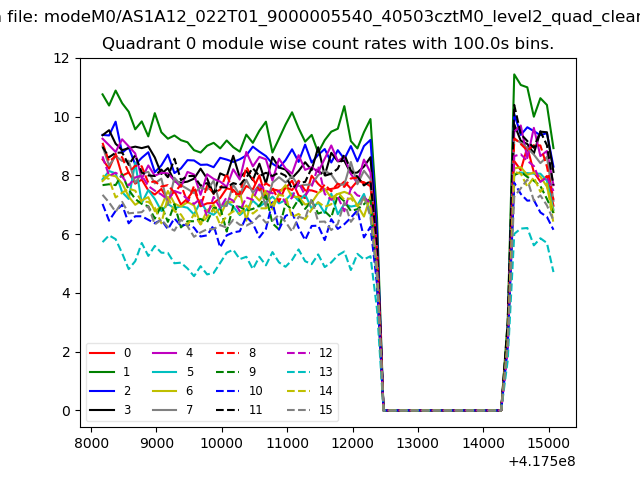 |
 |
| Module-wise count rates for Quadrant B Data is divided into 100 sec bins |
 |
 |
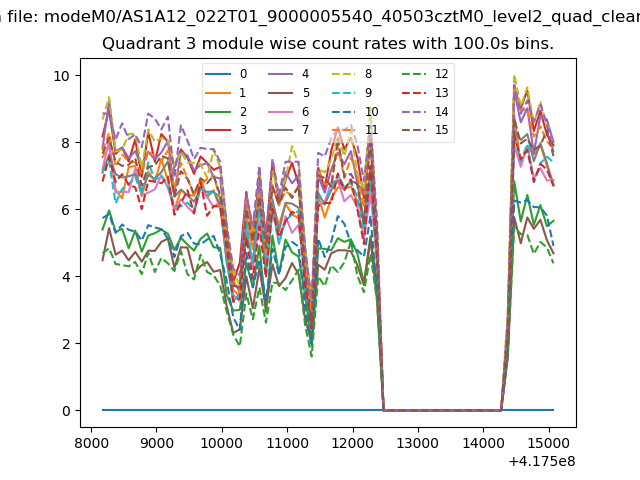
| Module-wise count rates for Quadrant C Data is divided into 100 sec bins |
 |
 |
| Module-wise count rates for Quadrant D Data is divided into 100 sec bins |
 |
 |
| Parameter | Plot |
|---|---|
| CZT HV Monitor | 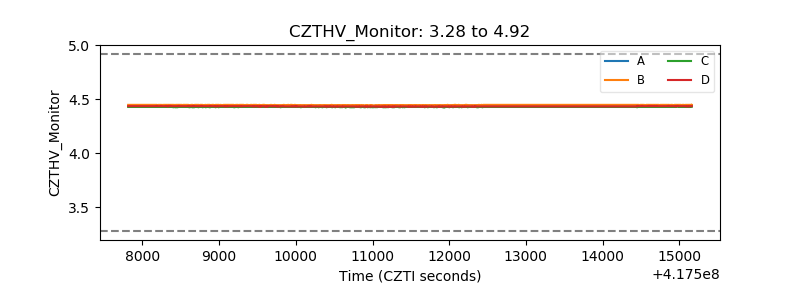 |
| D_VDD | 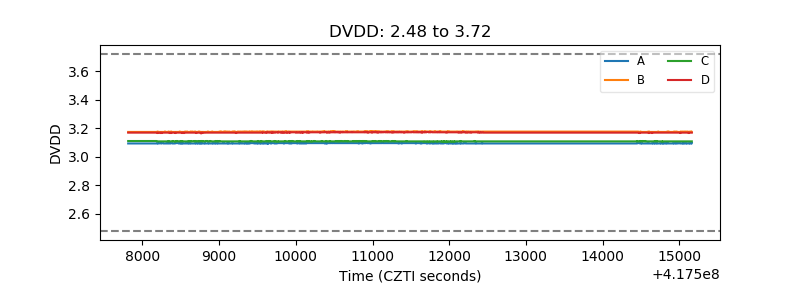 |
| Temperature 1 | 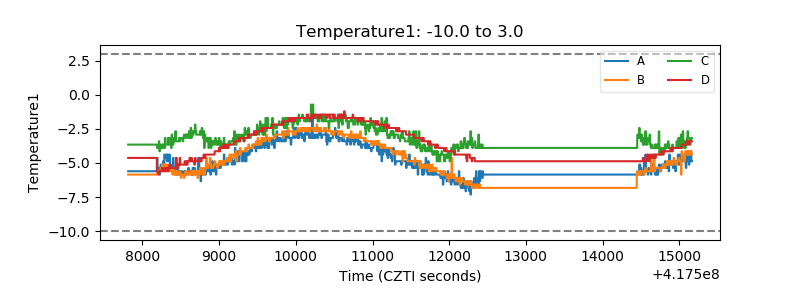 |
| Veto HV Monitor | 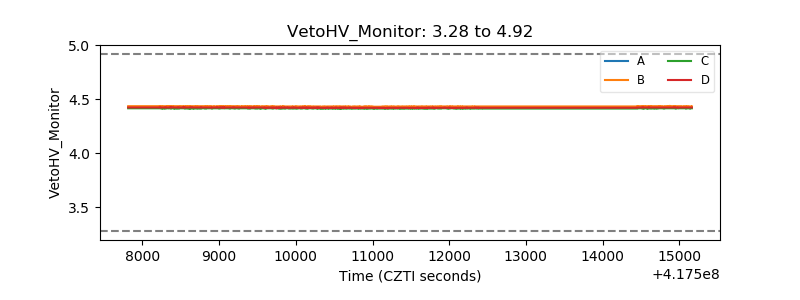 |
| Veto LLD | 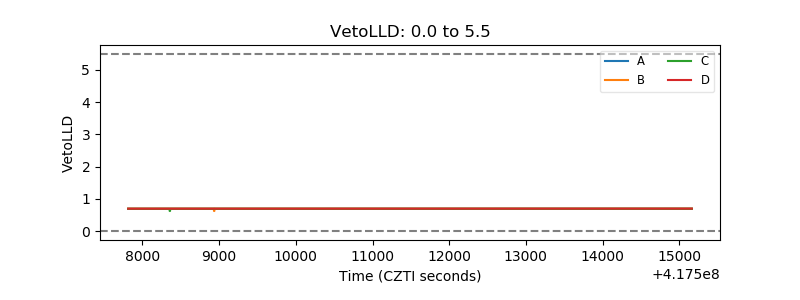 |
| Alpha Counter | 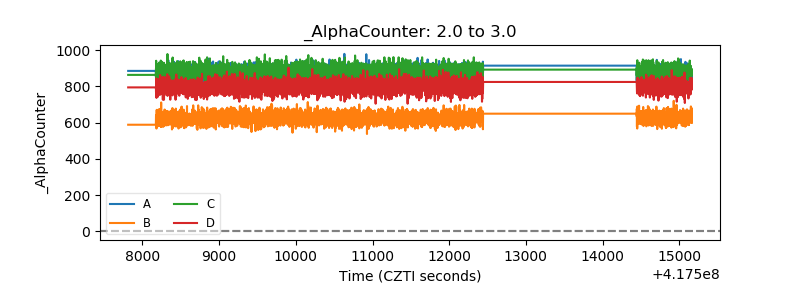 |
| _CPM_Rate | 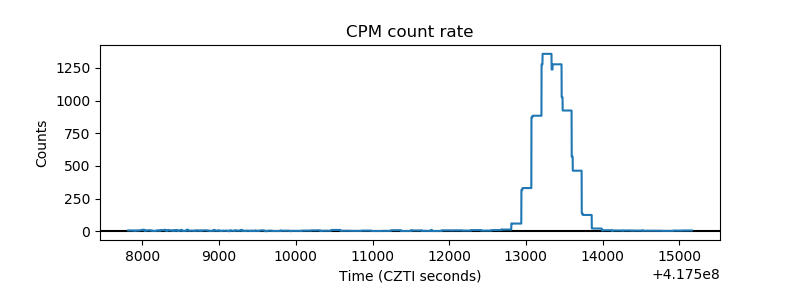 |
| CZT Counter | 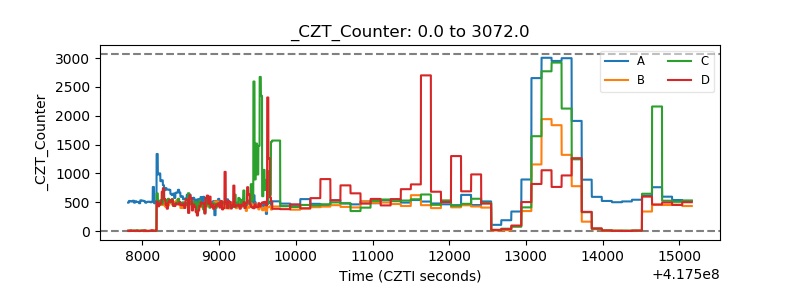 |
| +2.5 Volts monitor | 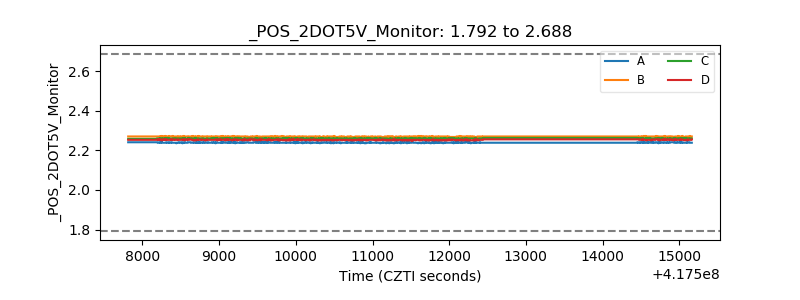 |
| +5 Volts monitor | 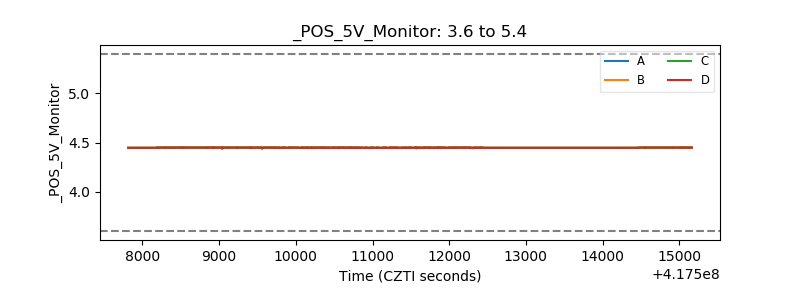 |
| _ROLL_ROT | 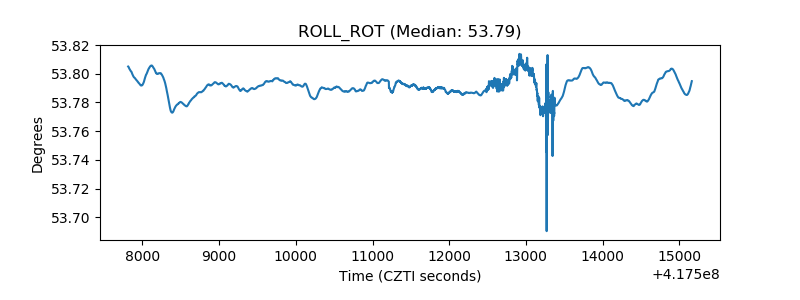 |
| _Roll_DEC | 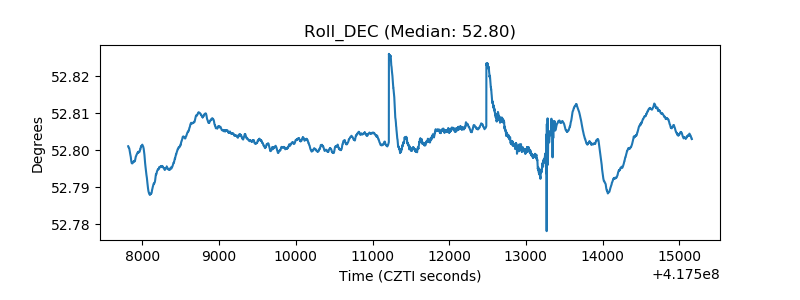 |
| _Roll_RA | 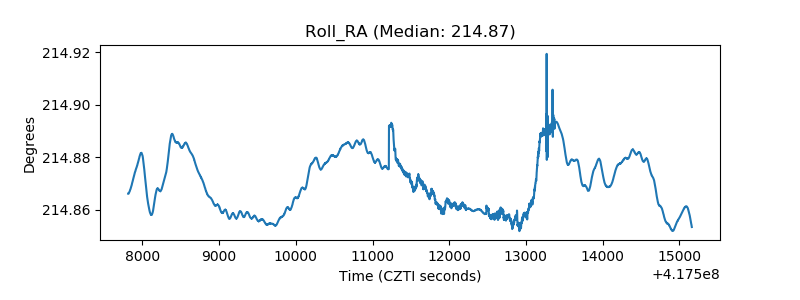 |
| Veto Counter | 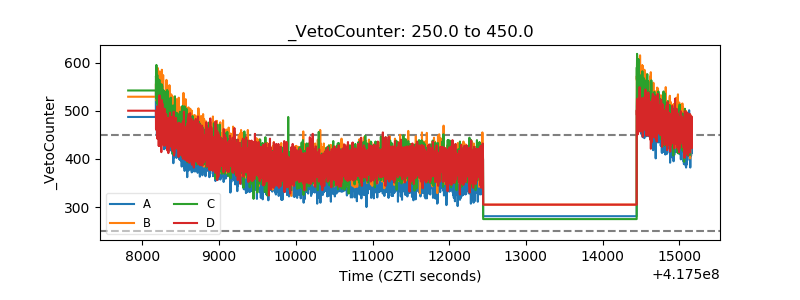 |