| Param | Original file | Final file |
|---|---|---|
| Filename | modeM0/AS1A12_022T01_9000005540_40504cztM0_level2.fits | modeM0/AS1A12_022T01_9000005540_40504cztM0_level2_quad_clean.evt |
| Size (bytes) | 339,863,040 | 92,911,680 |
| Size | 324.1 MB | 88.6 MB |
| Events in quadrant A | 2,901,690 | 652,667 |
| Events in quadrant B | 2,948,616 | 664,326 |
| Events in quadrant C | 3,069,799 | 609,980 |
| Events in quadrant D | 3,252,455 | 520,224 |
| Mode M0 | |||
|---|---|---|---|
| Quadrant | BADHDUFLAG | Total packets | Discarded packets |
| A | 0 | 11626 | 3 |
| B | 0 | 12145 | 2 |
| C | 0 | 12209 | 2 |
| D | 0 | 12995 | 2 |
| Mode M9 | |||
|---|---|---|---|
| Quadrant | BADHDUFLAG | Total packets | Discarded packets |
| A | 0 | 28 | 0 |
| B | 0 | 28 | 0 |
| C | 0 | 28 | 0 |
| D | 0 | 29 | 0 |
| Mode SS | |||
|---|---|---|---|
| Quadrant | BADHDUFLAG | Total packets | Discarded packets |
| A | 0 | 106 | 0 |
| B | 0 | 106 | 0 |
| C | 0 | 106 | 0 |
| D | 0 | 106 | 0 |
| Quadrant | Total seconds | Saturated seconds | Saturation percentage |
|---|---|---|---|
| A | 5233 | 8 | 0.152876% |
| B | 5233 | 63 | 1.203898% |
| C | 5233 | 130 | 2.484235% |
| D | 5233 | 617 | 11.790560% |
Noise dominated data is calculated using 1-second bins in cleaned event files. If a bin has >2000 counts, and if more than 50% of those come from <1% of pixels, then it is considered to be noise-dominated and hence unusable.
| Quadrant | # 1 sec bins | Bins with >0 counts | Bins with >2000 counts | High rate bins dominated by noise | Noise dominated (total time) | Noise dominated (detector-on time) | Marked lightcurve |
|---|---|---|---|---|---|---|---|
| A | 7326 | 5234 | 3 | 3 | 0.04% | 0.06% | 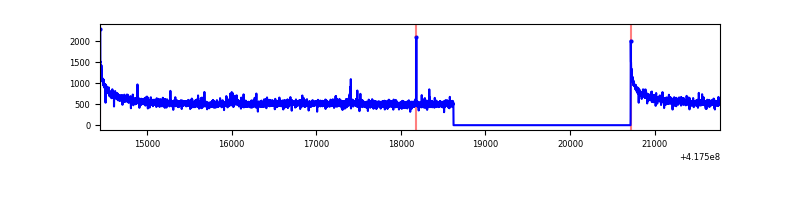 |
| B | 7326 | 5234 | 33 | 33 | 0.45% | 0.63% | 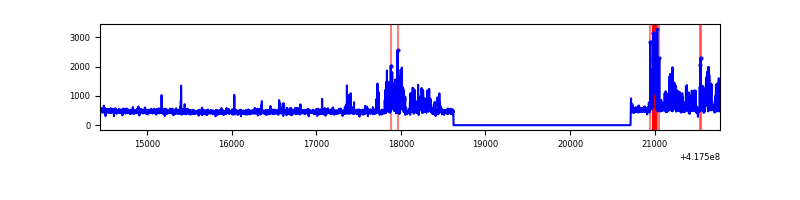 |
| C | 7326 | 5234 | 107 | 107 | 1.46% | 2.04% | 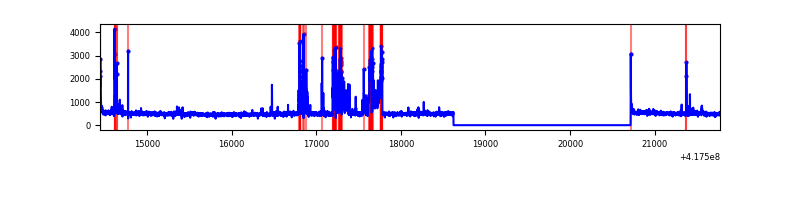 |
| D | 7326 | 5234 | 132 | 132 | 1.80% | 2.52% | 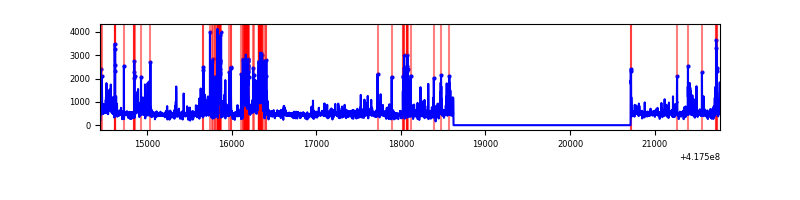 |
Top three noisy pixels from each quadrant. If the there are fewer than three noisy pixels in the level2.evt file, extra rows are filled as -1
| Pixel properties | Quadrant properties | ||||||
|---|---|---|---|---|---|---|---|
| Quadrant | DetID | PixID | Counts | Sigma | Mean | Median | Sigma |
| A | 10 | 83 | 476103 | 3868.32 | 613 | 602 | 122.9 |
| A | 12 | 189 | 34839 | 278.53 | 613 | 602 | 122.9 |
| A | 2 | 79 | 8909 | 67.58 | 613 | 602 | 122.9 |
| B | 3 | 112 | 251753 | 2205.08 | 601 | 587 | 113.9 |
| B | 4 | 171 | 208277 | 1823.39 | 601 | 587 | 113.9 |
| B | 5 | 255 | 122554 | 1070.8 | 601 | 587 | 113.9 |
| C | 14 | 254 | 525971 | 3923.1 | 581 | 585 | 133.9 |
| C | 15 | 214 | 228944 | 1705.18 | 581 | 585 | 133.9 |
| C | 9 | 146 | 16692 | 120.27 | 581 | 585 | 133.9 |
| D | 12 | 128 | 251977 | 1861.56 | 559 | 546 | 135.1 |
| D | 12 | 0 | 245417 | 1812.99 | 559 | 546 | 135.1 |
| D | 2 | 250 | 216105 | 1595.97 | 559 | 546 | 135.1 |
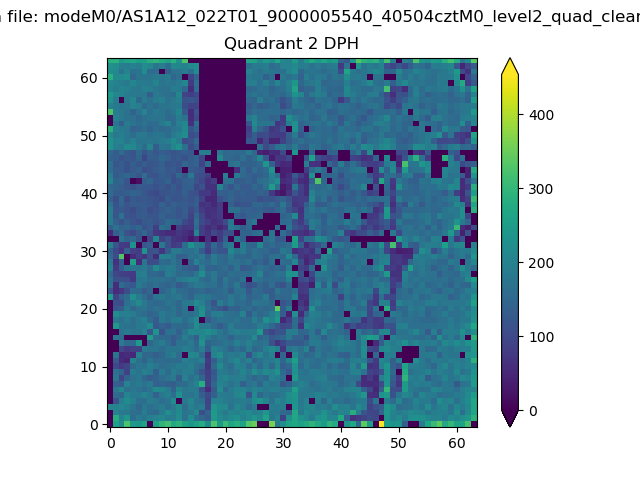
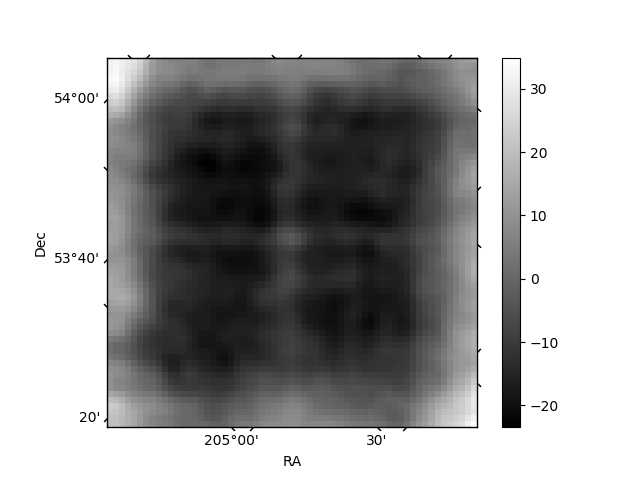
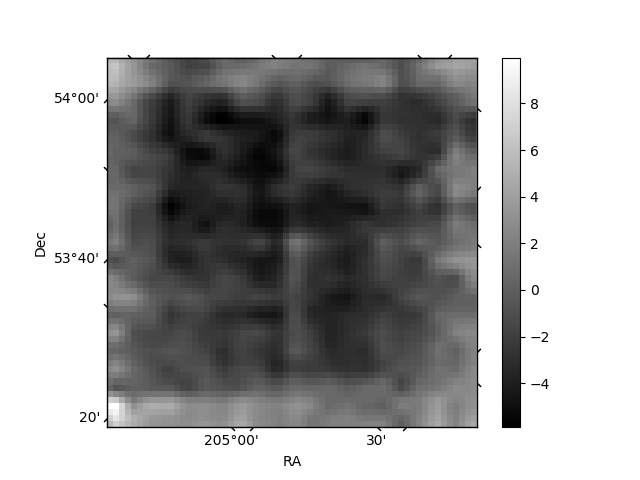
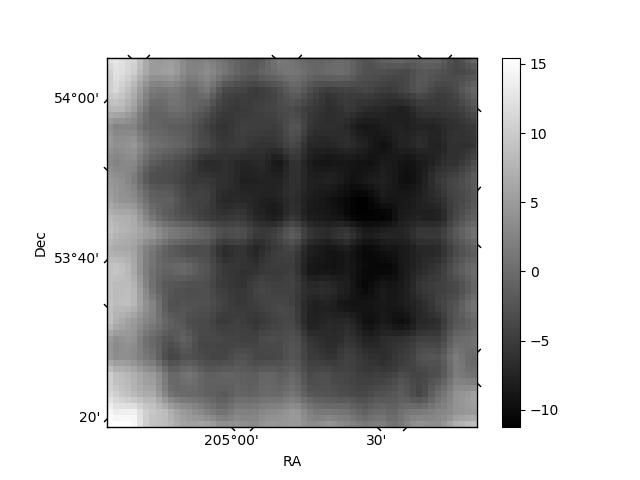
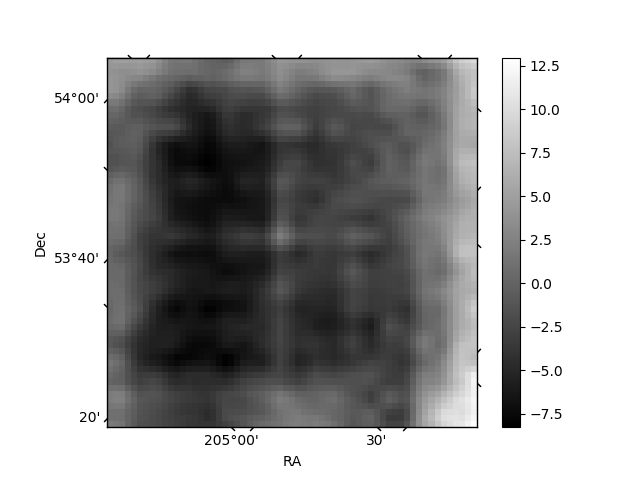
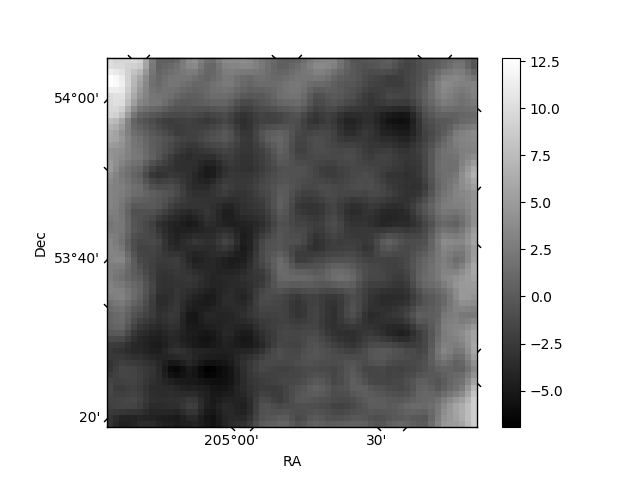
Histogram calculated using DETX and DETY for each event in the final _common_clean file
| Quadrant A | 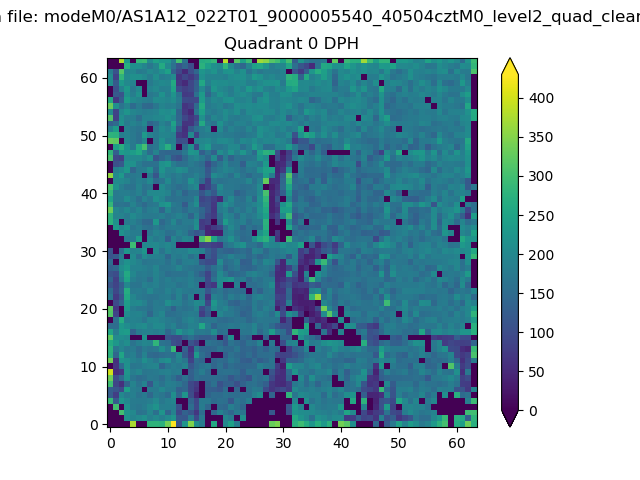 |
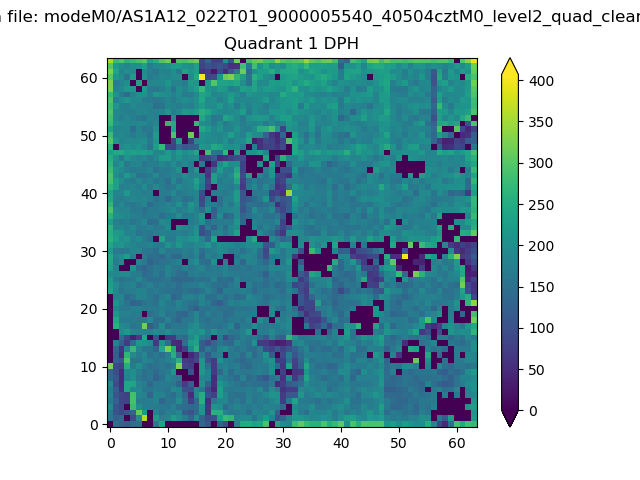 |
Quadrant B |
|---|---|---|---|
| Quadrant D | 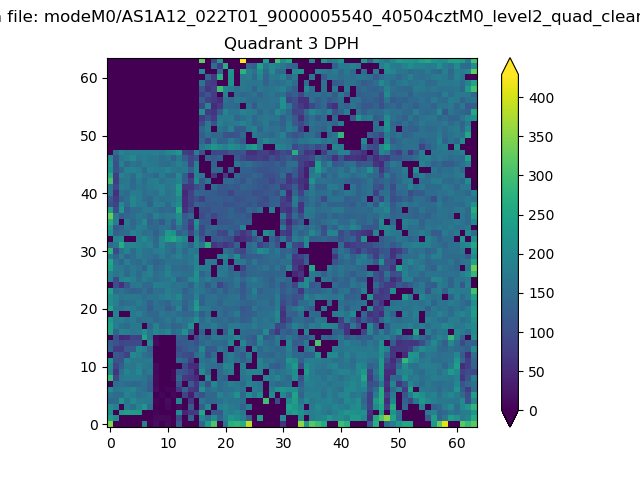 |
 |
Quadrant C |
| Plot type | Count rate plots | Images |
|---|---|---|
| Comparison with Poisson distribution Blue bars denote a histogram of data divided into 1 sec bins. Red curve is a Poisson curve with rate = median count rate of data. |
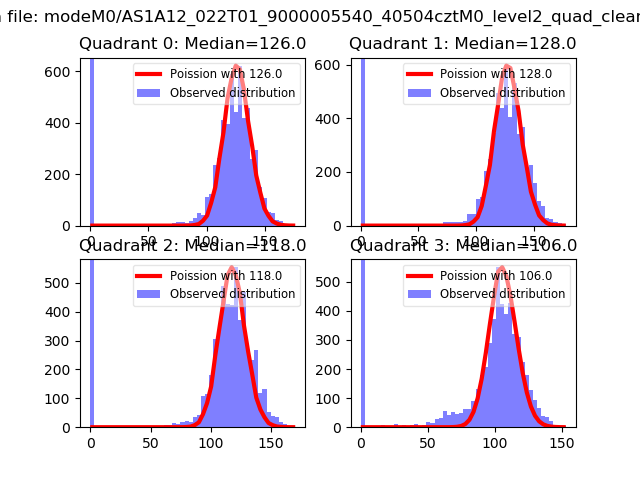 |
 |
| Quadrant-wise count rates Data is divided into 100 sec bins |
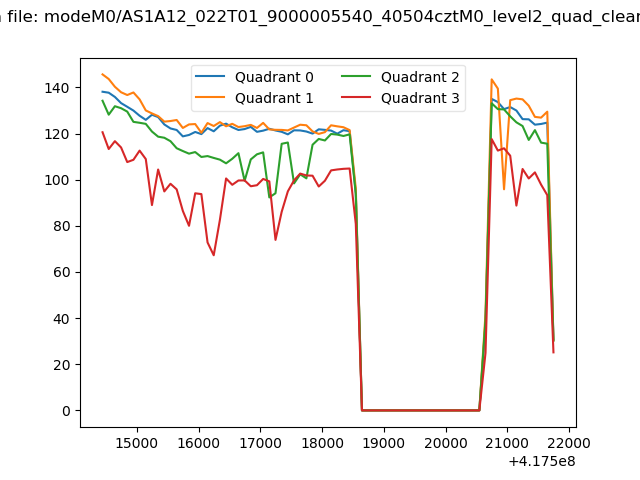 |
|
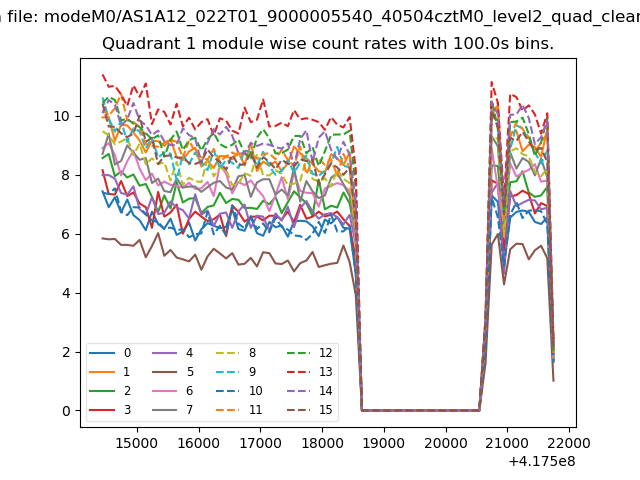
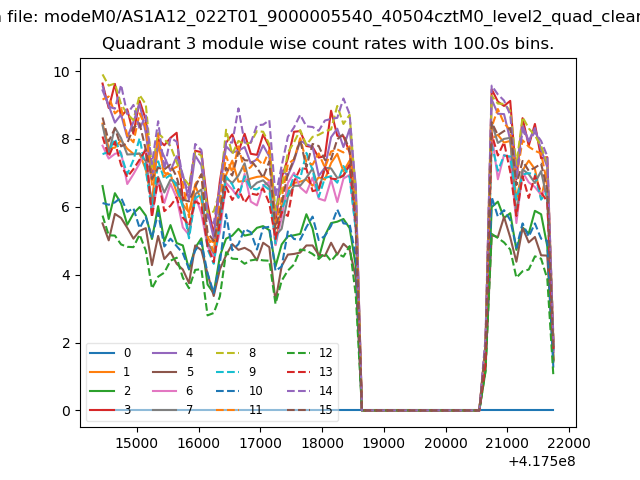
| Module-wise count rates for Quadrant A Data is divided into 100 sec bins |
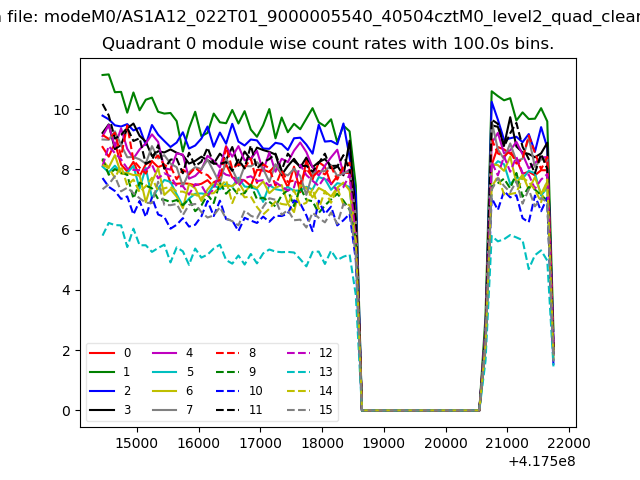 |
 |
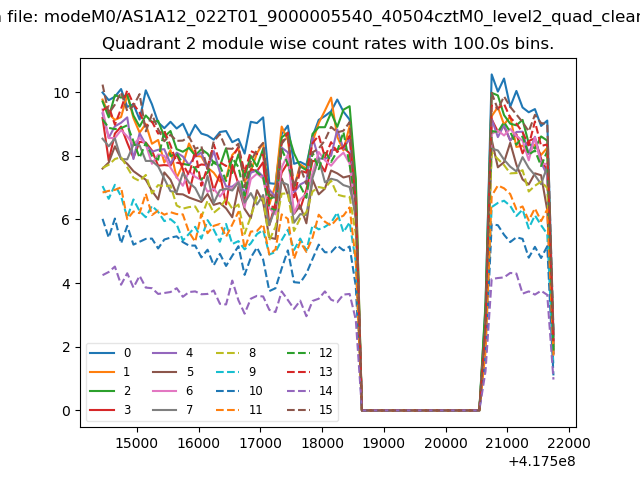
| Module-wise count rates for Quadrant B Data is divided into 100 sec bins |
 |
 |
| Module-wise count rates for Quadrant C Data is divided into 100 sec bins |
 |
 |
| Module-wise count rates for Quadrant D Data is divided into 100 sec bins |
 |
 |
| Parameter | Plot |
|---|---|
| CZT HV Monitor | 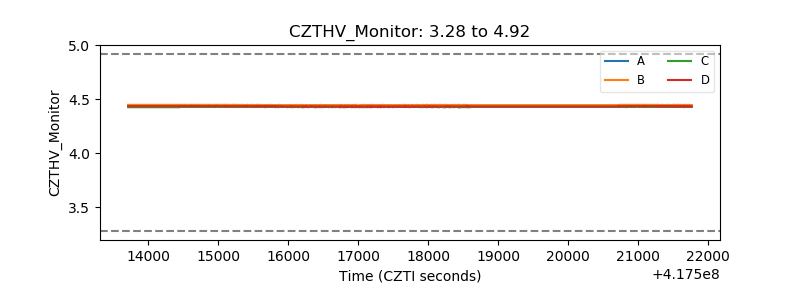 |
| D_VDD | 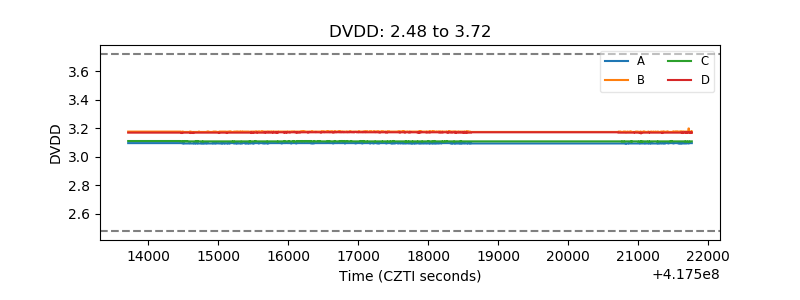 |
| Temperature 1 | 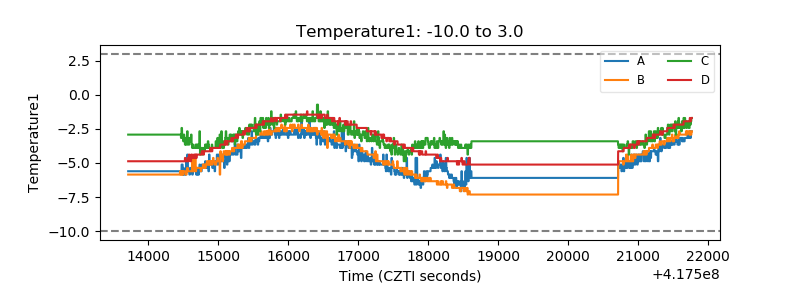 |
| Veto HV Monitor | 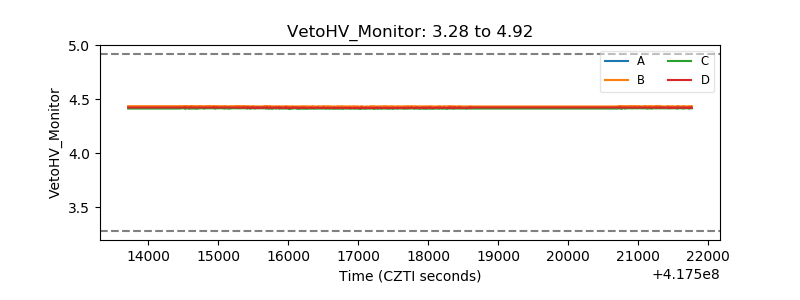 |
| Veto LLD | 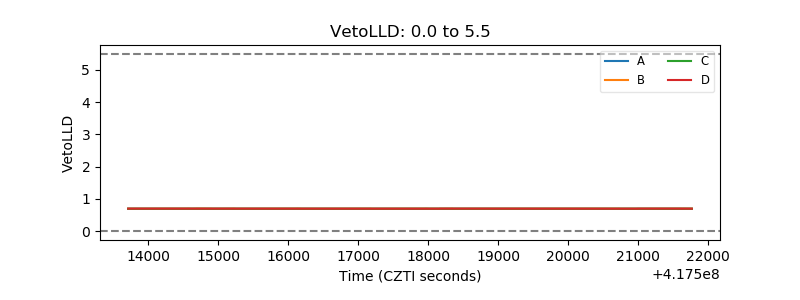 |
| Alpha Counter | 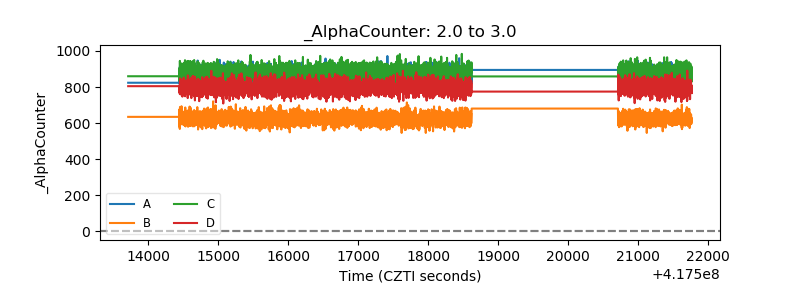 |
| _CPM_Rate | 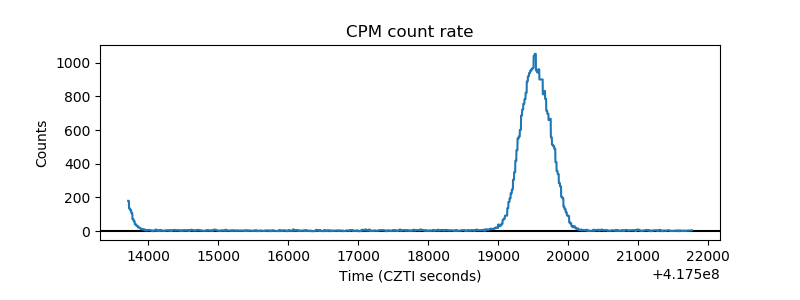 |
| CZT Counter | 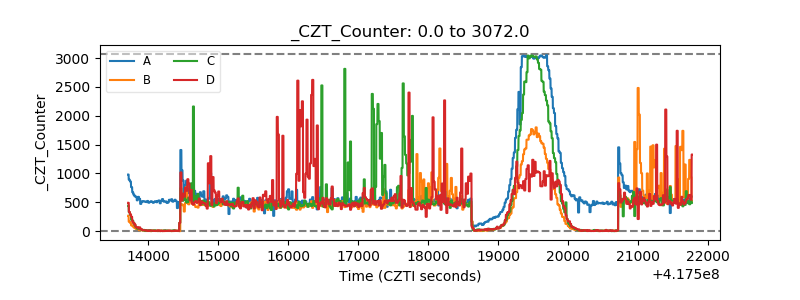 |
| +2.5 Volts monitor | 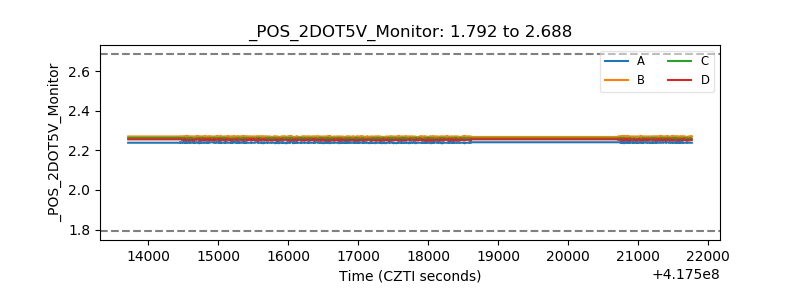 |
| +5 Volts monitor | 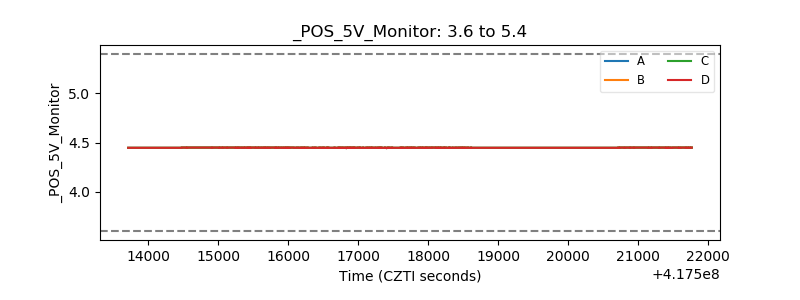 |
| _ROLL_ROT | 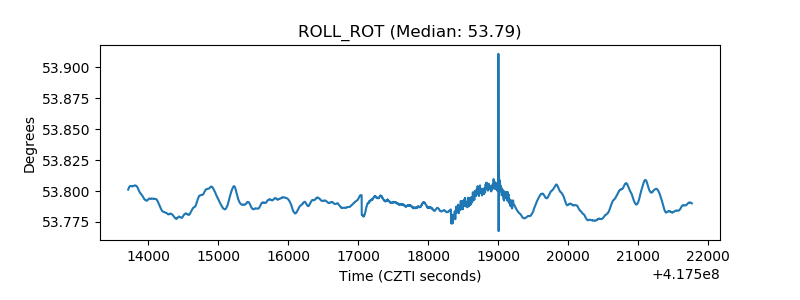 |
| _Roll_DEC | 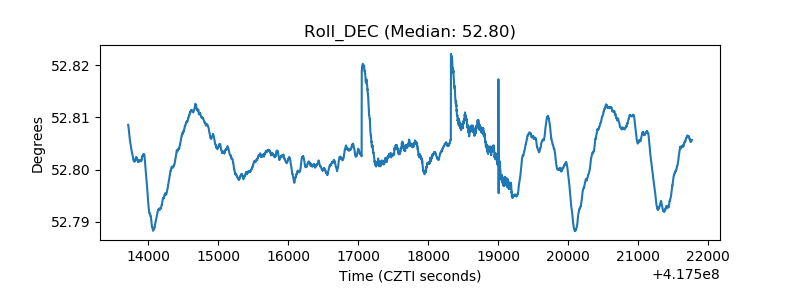 |
| _Roll_RA | 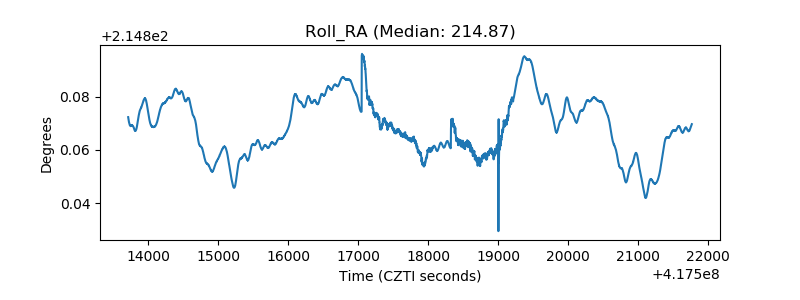 |
| Veto Counter | 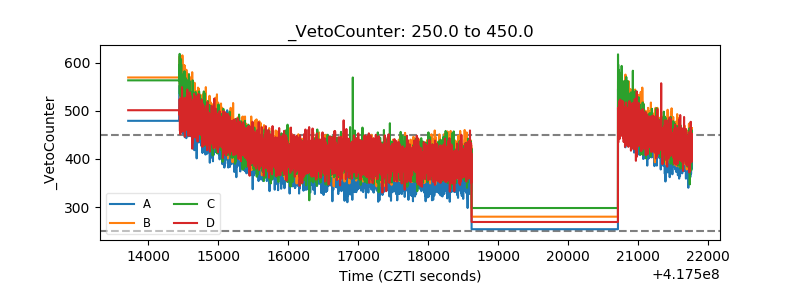 |