| Param | Original file | Final file |
|---|---|---|
| Filename | modeM0/AS1A12_022T01_9000005540_40505cztM0_level2.fits | modeM0/AS1A12_022T01_9000005540_40505cztM0_level2_quad_clean.evt |
| Size (bytes) | 347,774,400 | 89,591,040 |
| Size | 331.7 MB | 85.4 MB |
| Events in quadrant A | 2,951,191 | 632,518 |
| Events in quadrant B | 2,903,143 | 643,745 |
| Events in quadrant C | 2,926,114 | 598,798 |
| Events in quadrant D | 3,688,653 | 474,431 |
| Mode M0 | |||
|---|---|---|---|
| Quadrant | BADHDUFLAG | Total packets | Discarded packets |
| A | 0 | 11937 | 3 |
| B | 0 | 11948 | 2 |
| C | 0 | 11765 | 2 |
| D | 0 | 14298 | 2 |
| Mode M9 | |||
|---|---|---|---|
| Quadrant | BADHDUFLAG | Total packets | Discarded packets |
| A | 0 | 28 | 0 |
| B | 0 | 28 | 0 |
| C | 0 | 28 | 0 |
| D | 0 | 29 | 0 |
| Mode SS | |||
|---|---|---|---|
| Quadrant | BADHDUFLAG | Total packets | Discarded packets |
| A | 0 | 106 | 0 |
| B | 0 | 106 | 0 |
| C | 0 | 106 | 0 |
| D | 0 | 106 | 0 |
| Quadrant | Total seconds | Saturated seconds | Saturation percentage |
|---|---|---|---|
| A | 5183 | 20 | 0.385877% |
| B | 5183 | 54 | 1.041868% |
| C | 5183 | 61 | 1.176925% |
| D | 5183 | 996 | 19.216670% |
Noise dominated data is calculated using 1-second bins in cleaned event files. If a bin has >2000 counts, and if more than 50% of those come from <1% of pixels, then it is considered to be noise-dominated and hence unusable.
| Quadrant | # 1 sec bins | Bins with >0 counts | Bins with >2000 counts | High rate bins dominated by noise | Noise dominated (total time) | Noise dominated (detector-on time) | Marked lightcurve |
|---|---|---|---|---|---|---|---|
| A | 7306 | 5184 | 12 | 12 | 0.16% | 0.23% | 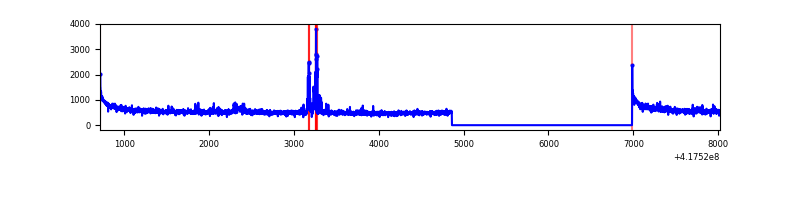 |
| B | 7306 | 5184 | 32 | 32 | 0.44% | 0.62% | 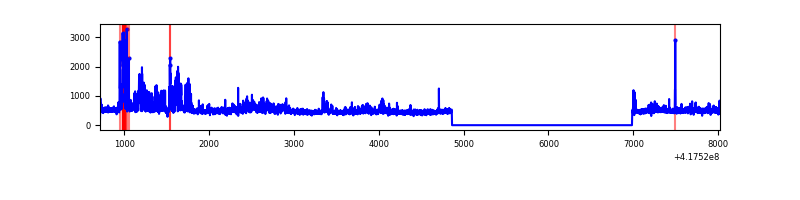 |
| C | 7306 | 5184 | 59 | 59 | 0.81% | 1.14% | 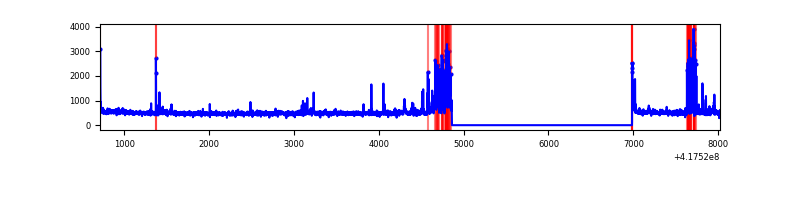 |
| D | 7306 | 5184 | 218 | 218 | 2.98% | 4.21% | 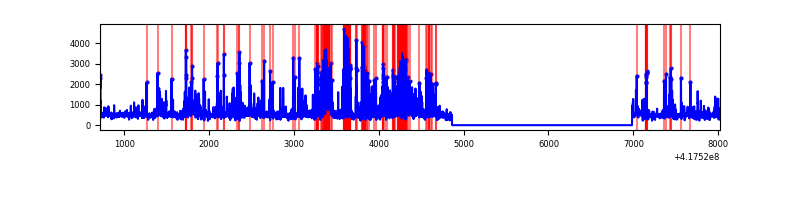 |
Top three noisy pixels from each quadrant. If the there are fewer than three noisy pixels in the level2.evt file, extra rows are filled as -1
| Pixel properties | Quadrant properties | ||||||
|---|---|---|---|---|---|---|---|
| Quadrant | DetID | PixID | Counts | Sigma | Mean | Median | Sigma |
| A | 10 | 83 | 472258 | 3901.09 | 596 | 586 | 120.9 |
| A | 12 | 189 | 123395 | 1015.73 | 596 | 586 | 120.9 |
| A | 7 | 3 | 39646 | 323.06 | 596 | 586 | 120.9 |
| B | 3 | 112 | 431913 | 3872.89 | 587 | 572 | 111.4 |
| B | 5 | 255 | 132306 | 1182.8 | 587 | 572 | 111.4 |
| B | 4 | 171 | 36550 | 323.04 | 587 | 572 | 111.4 |
| C | 14 | 254 | 383973 | 2912.3 | 573 | 576 | 131.6 |
| C | 15 | 214 | 227135 | 1720.95 | 573 | 576 | 131.6 |
| C | 9 | 187 | 31516 | 235.02 | 573 | 576 | 131.6 |
| D | 12 | 227 | 824460 | 6363.59 | 527 | 512 | 129.5 |
| D | 12 | 191 | 204199 | 1573.14 | 527 | 512 | 129.5 |
| D | 12 | 0 | 154774 | 1191.41 | 527 | 512 | 129.5 |
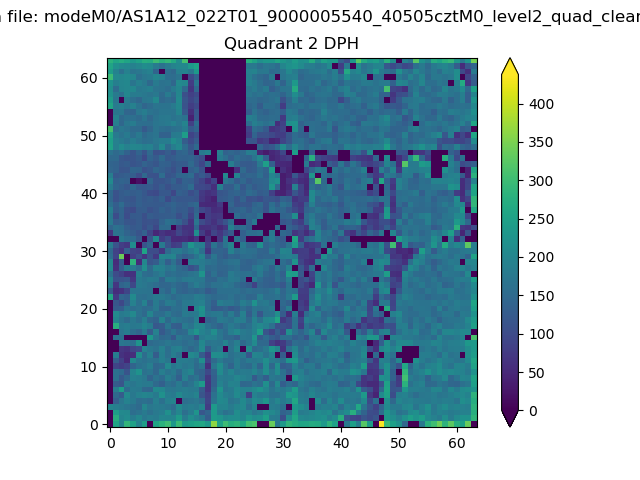
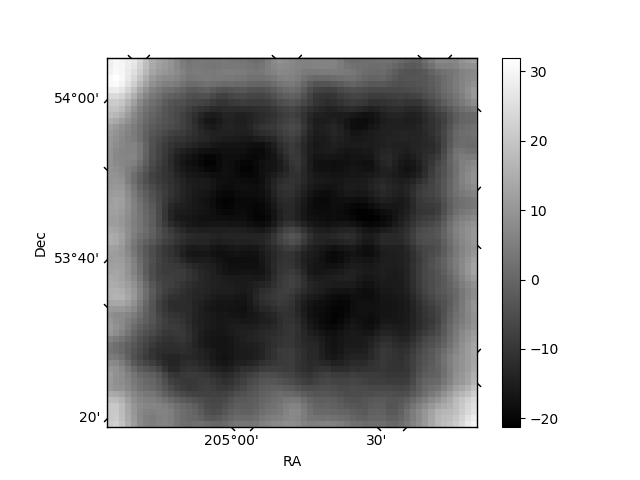
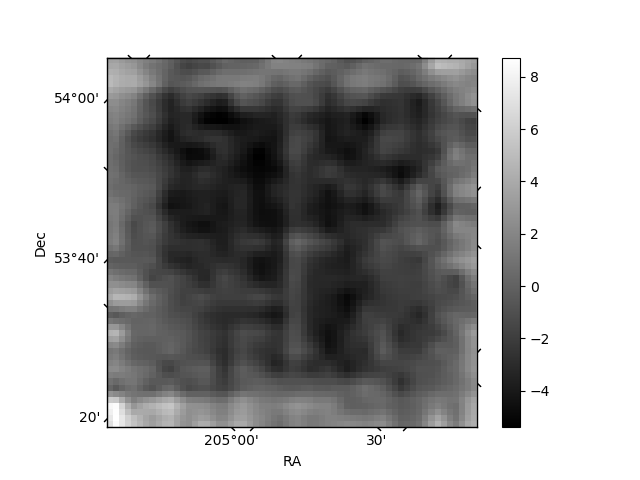
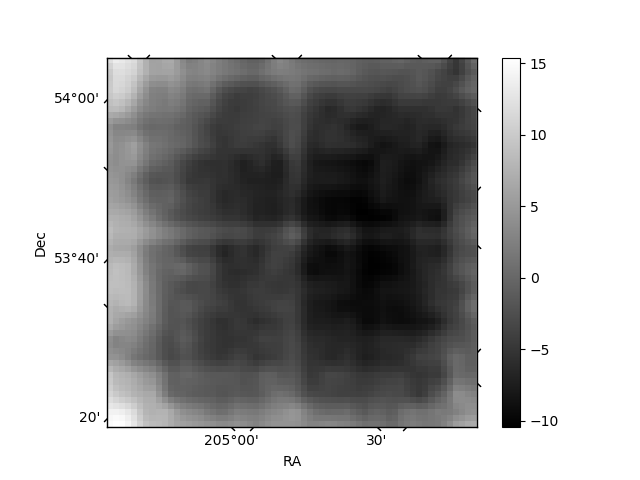
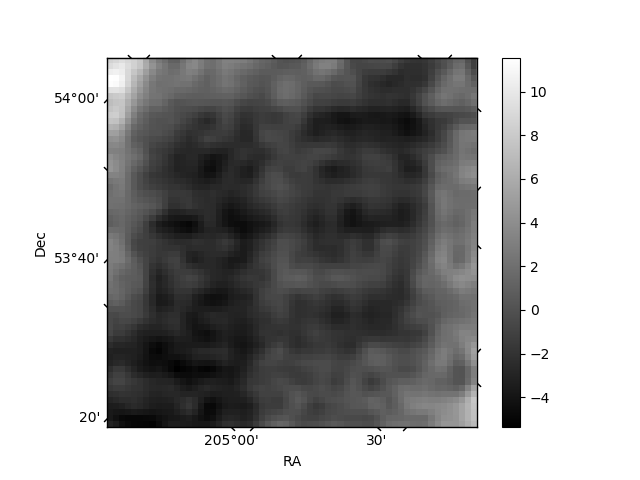
Histogram calculated using DETX and DETY for each event in the final _common_clean file
| Quadrant A | 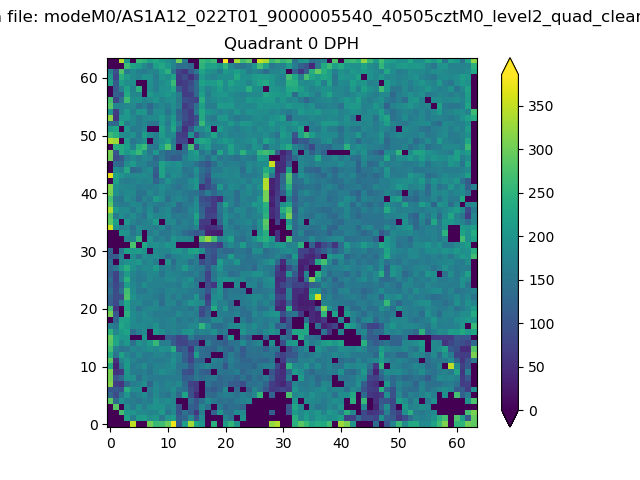 |
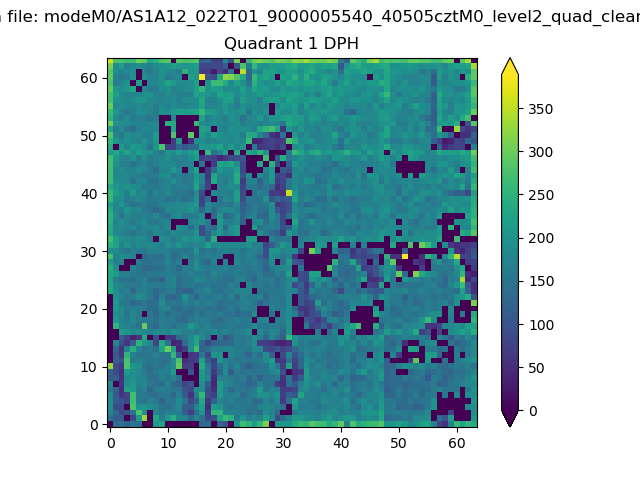 |
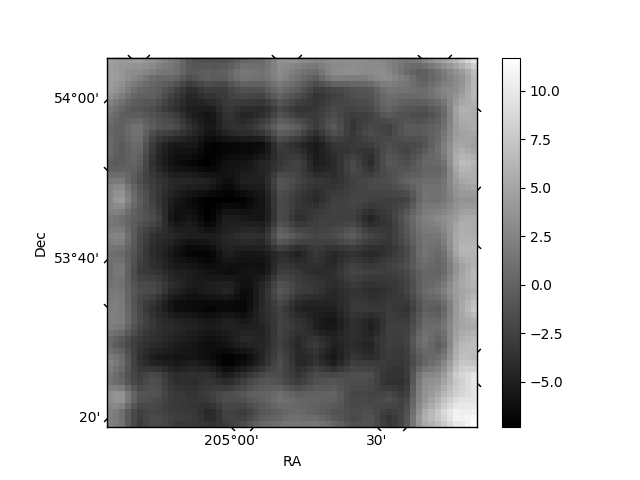
Quadrant B |
|---|---|---|---|
| Quadrant D | 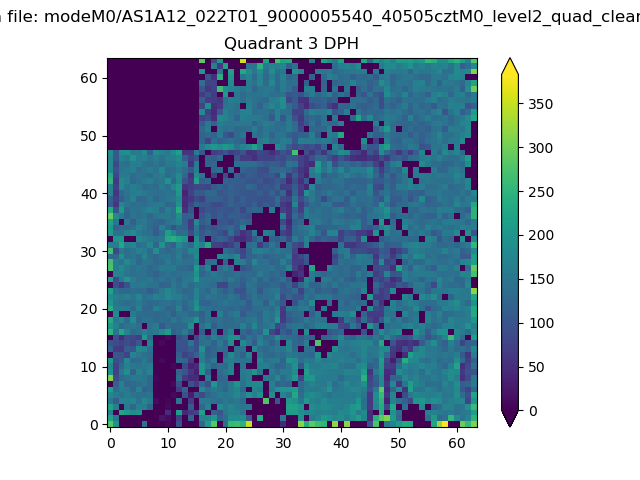 |
 |
Quadrant C |
| Plot type | Count rate plots | Images |
|---|---|---|
| Comparison with Poisson distribution Blue bars denote a histogram of data divided into 1 sec bins. Red curve is a Poisson curve with rate = median count rate of data. |
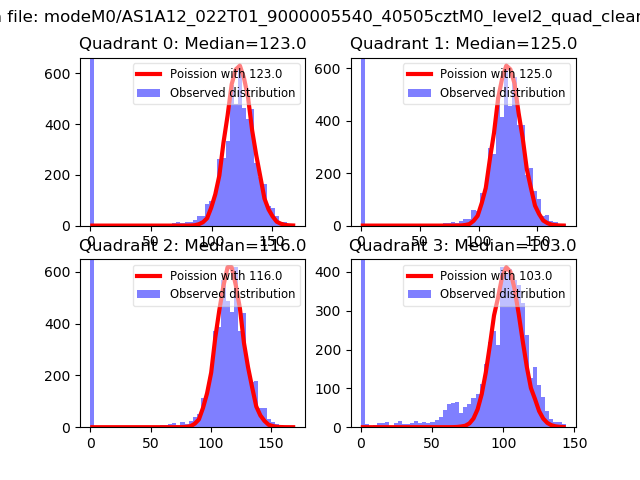 |
 |
| Quadrant-wise count rates Data is divided into 100 sec bins |
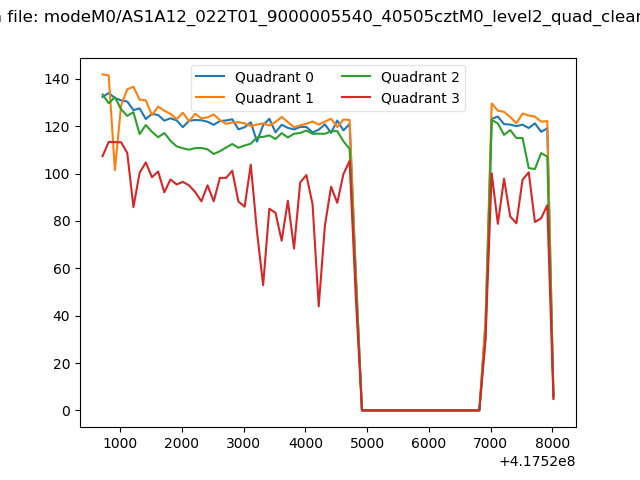 |
|
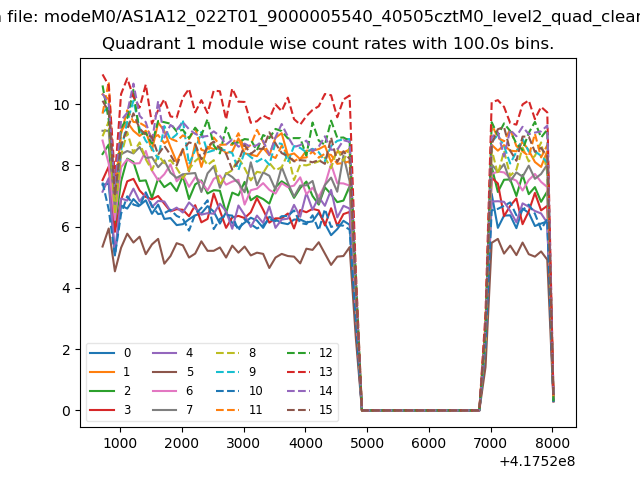
| Module-wise count rates for Quadrant A Data is divided into 100 sec bins |
 |
 |
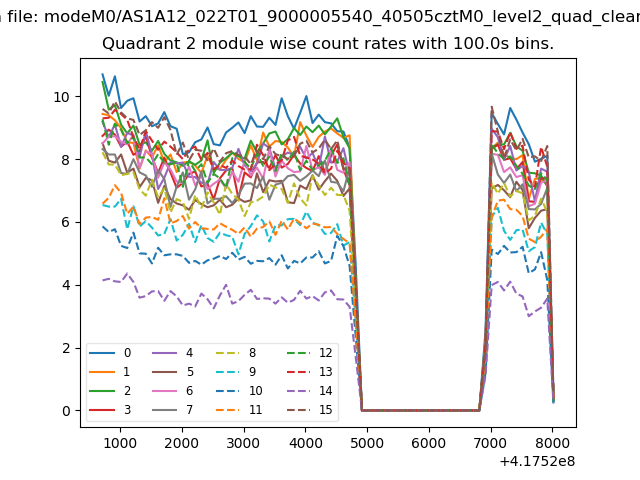
| Module-wise count rates for Quadrant B Data is divided into 100 sec bins |
 |
 |
| Module-wise count rates for Quadrant C Data is divided into 100 sec bins |
 |
 |
| Module-wise count rates for Quadrant D Data is divided into 100 sec bins |
 |
 |
| Parameter | Plot |
|---|---|
| CZT HV Monitor | 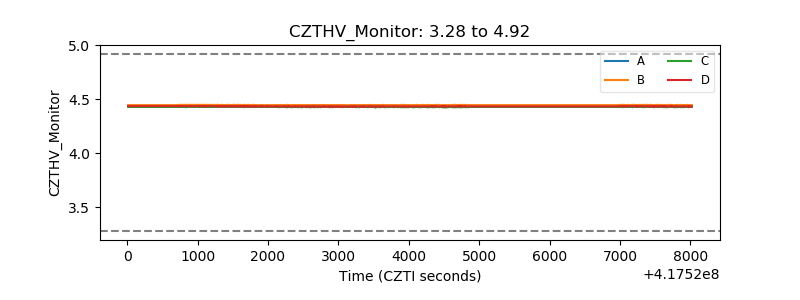 |
| D_VDD | 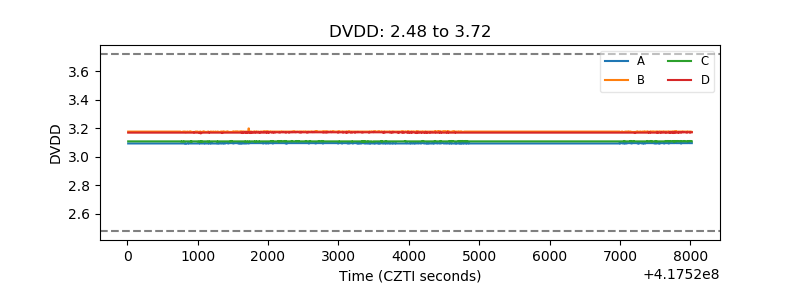 |
| Temperature 1 | 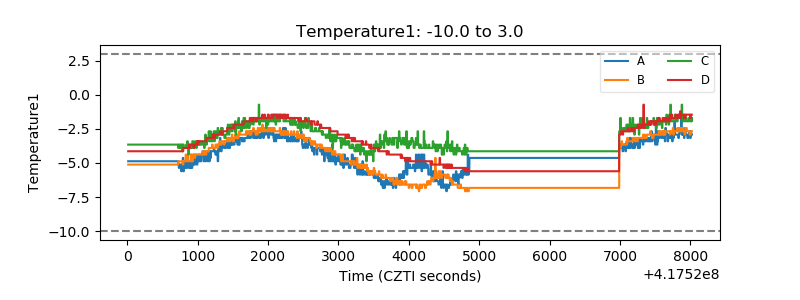 |
| Veto HV Monitor | 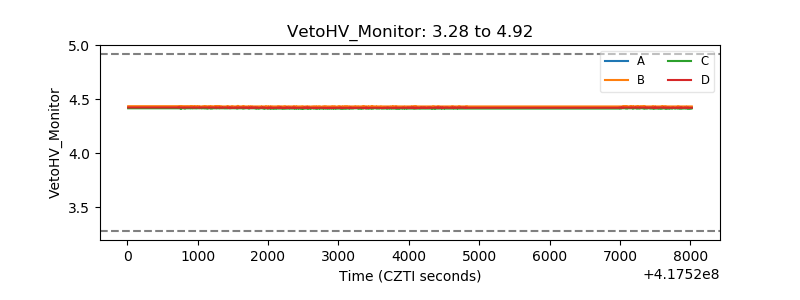 |
| Veto LLD | 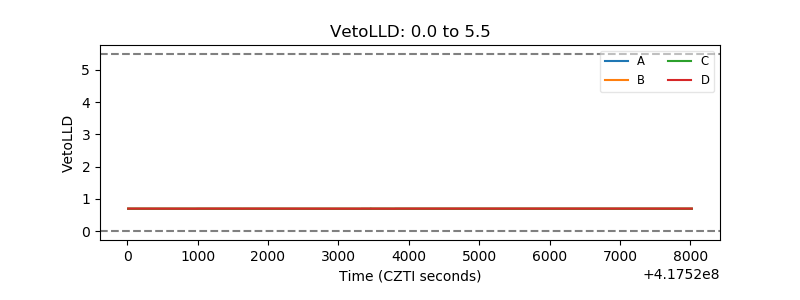 |
| Alpha Counter | 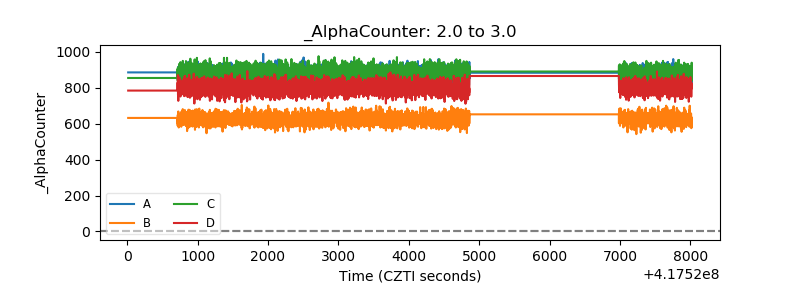 |
| _CPM_Rate | 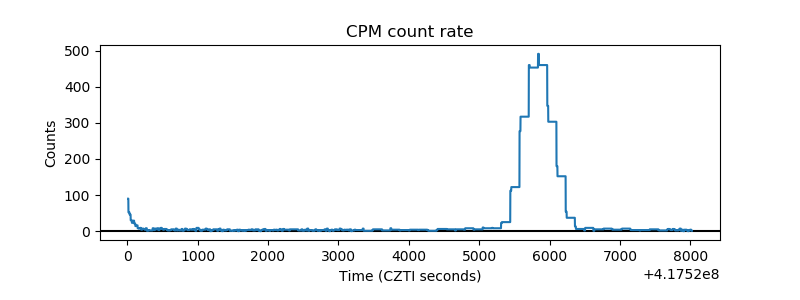 |
| CZT Counter | 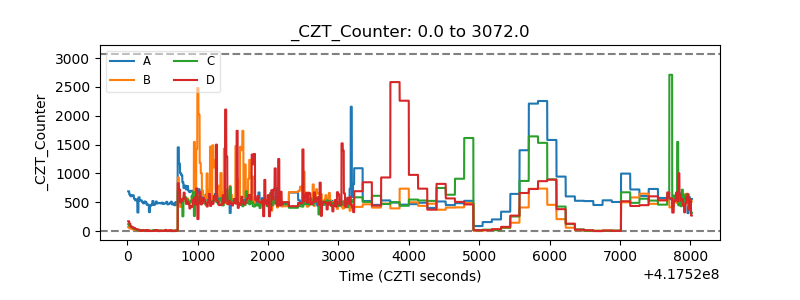 |
| +2.5 Volts monitor | 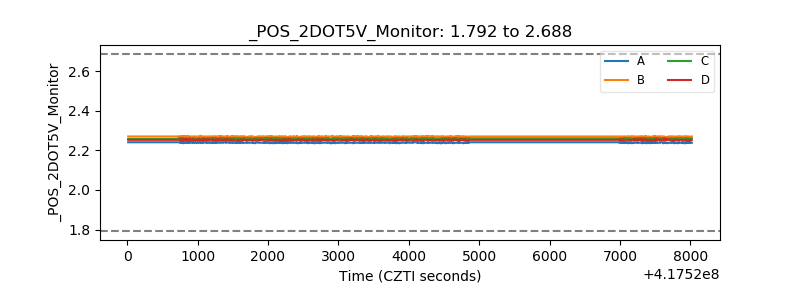 |
| +5 Volts monitor | 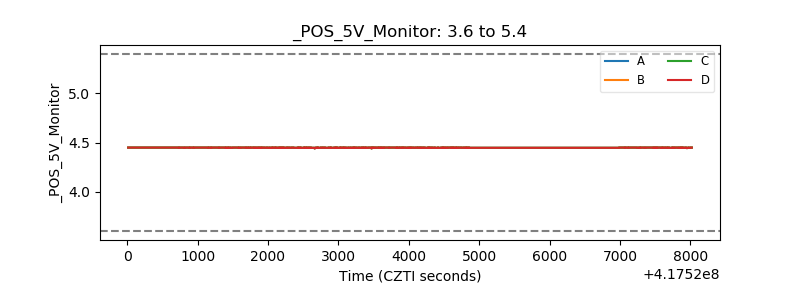 |
| _ROLL_ROT | 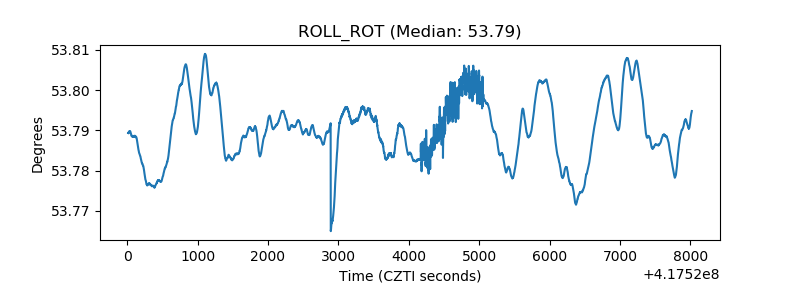 |
| _Roll_DEC | 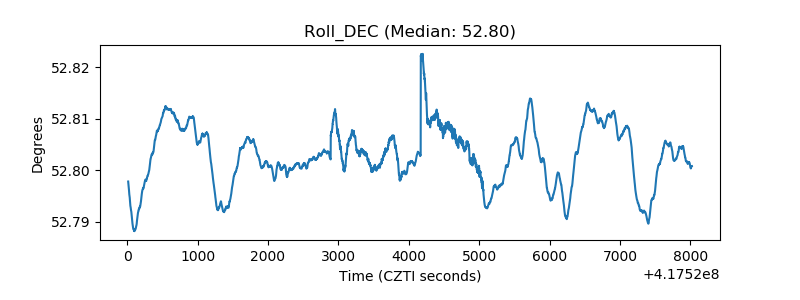 |
| _Roll_RA | 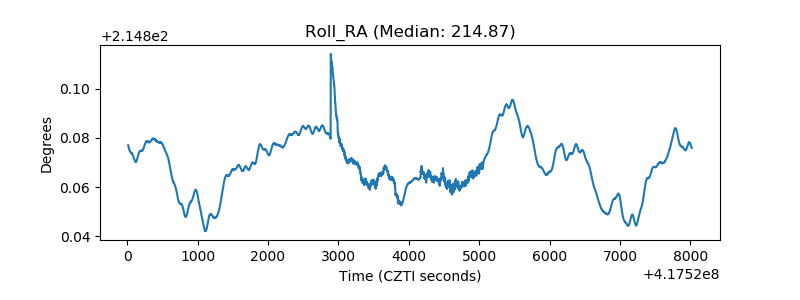 |
| Veto Counter | 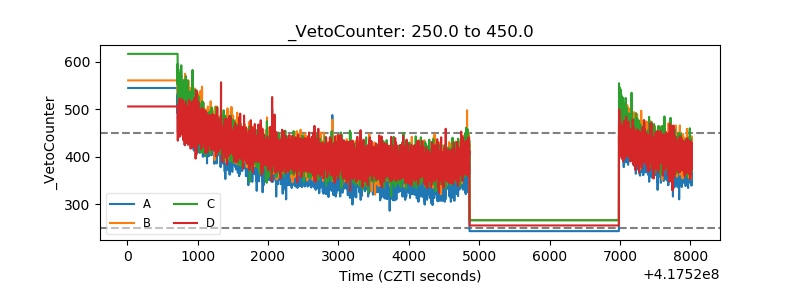 |