| Param | Original file | Final file |
|---|---|---|
| Filename | modeM0/AS1A12_022T01_9000005540_40506cztM0_level2.fits | modeM0/AS1A12_022T01_9000005540_40506cztM0_level2_quad_clean.evt |
| Size (bytes) | 186,419,520 | 51,920,640 |
| Size | 177.8 MB | 49.5 MB |
| Events in quadrant A | 1,635,242 | 365,374 |
| Events in quadrant B | 1,518,330 | 371,754 |
| Events in quadrant C | 1,616,087 | 342,594 |
| Events in quadrant D | 1,888,202 | 272,656 |
| Mode M0 | |||
|---|---|---|---|
| Quadrant | BADHDUFLAG | Total packets | Discarded packets |
| A | 0 | 6787 | 1 |
| B | 0 | 6467 | 1 |
| C | 0 | 6695 | 1 |
| D | 0 | 7663 | 1 |
| Mode M9 | |||
|---|---|---|---|
| Quadrant | BADHDUFLAG | Total packets | Discarded packets |
| A | 0 | 5 | 0 |
| B | 0 | 5 | 0 |
| C | 0 | 5 | 0 |
| D | 0 | 6 | 0 |
| Mode SS | |||
|---|---|---|---|
| Quadrant | BADHDUFLAG | Total packets | Discarded packets |
| A | 0 | 62 | 0 |
| B | 0 | 62 | 0 |
| C | 0 | 62 | 0 |
| D | 0 | 62 | 0 |
| Quadrant | Total seconds | Saturated seconds | Saturation percentage |
|---|---|---|---|
| A | 3088 | 6 | 0.194301% |
| B | 3088 | 6 | 0.194301% |
| C | 3088 | 32 | 1.036269% |
| D | 3088 | 557 | 18.037565% |
Noise dominated data is calculated using 1-second bins in cleaned event files. If a bin has >2000 counts, and if more than 50% of those come from <1% of pixels, then it is considered to be noise-dominated and hence unusable.
| Quadrant | # 1 sec bins | Bins with >0 counts | Bins with >2000 counts | High rate bins dominated by noise | Noise dominated (total time) | Noise dominated (detector-on time) | Marked lightcurve |
|---|---|---|---|---|---|---|---|
| A | 3088 | 3088 | 2 | 2 | 0.06% | 0.06% | 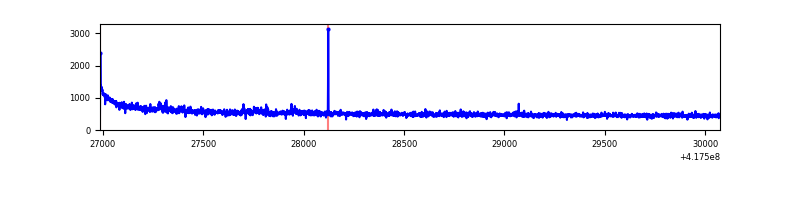 |
| B | 3088 | 3088 | 1 | 1 | 0.03% | 0.03% | 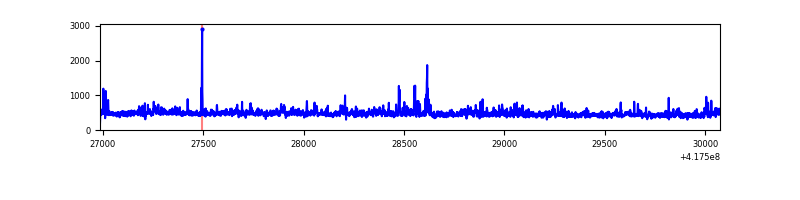 |
| C | 3088 | 3088 | 28 | 28 | 0.91% | 0.91% | 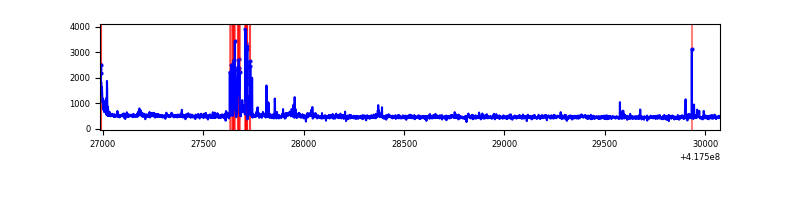 |
| D | 3088 | 3088 | 72 | 72 | 2.33% | 2.33% | 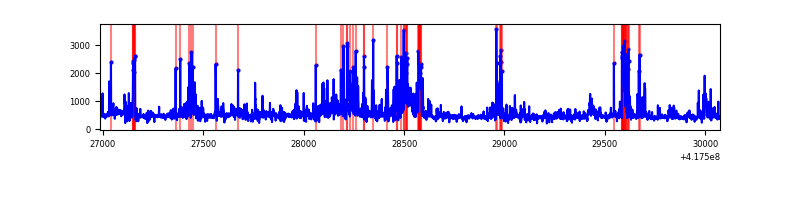 |
Top three noisy pixels from each quadrant. If the there are fewer than three noisy pixels in the level2.evt file, extra rows are filled as -1
| Pixel properties | Quadrant properties | ||||||
|---|---|---|---|---|---|---|---|
| Quadrant | DetID | PixID | Counts | Sigma | Mean | Median | Sigma |
| A | 10 | 83 | 273552 | 3841.61 | 343 | 336 | 71.1 |
| A | 12 | 189 | 30366 | 422.24 | 343 | 336 | 71.1 |
| A | 11 | 175 | 5043 | 66.18 | 343 | 336 | 71.1 |
| B | 3 | 112 | 147153 | 2215.62 | 340 | 331 | 66.3 |
| B | 5 | 255 | 18940 | 280.82 | 340 | 331 | 66.3 |
| B | 4 | 171 | 16294 | 240.89 | 340 | 331 | 66.3 |
| C | 14 | 254 | 134949 | 1733.66 | 332 | 334 | 77.6 |
| C | 15 | 214 | 132700 | 1704.7 | 332 | 334 | 77.6 |
| C | 9 | 187 | 20706 | 262.36 | 332 | 334 | 77.6 |
| D | 2 | 250 | 195433 | 2562.96 | 304 | 295 | 76.1 |
| D | 12 | 191 | 125052 | 1638.57 | 304 | 295 | 76.1 |
| D | 12 | 227 | 106108 | 1389.76 | 304 | 295 | 76.1 |
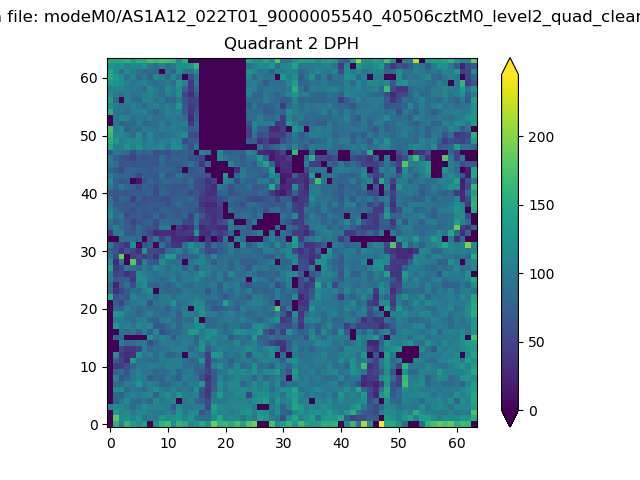
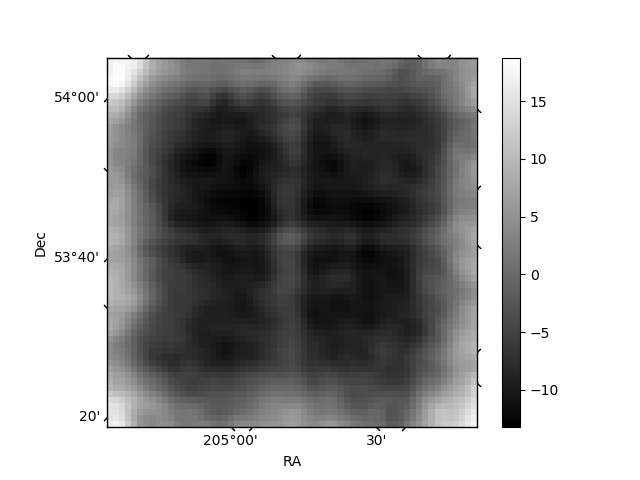
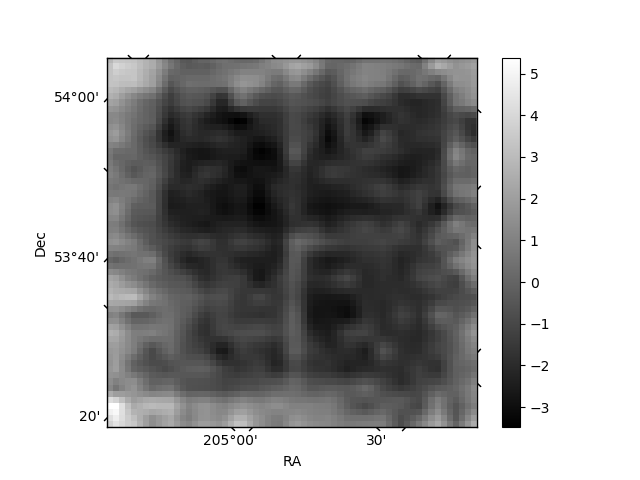
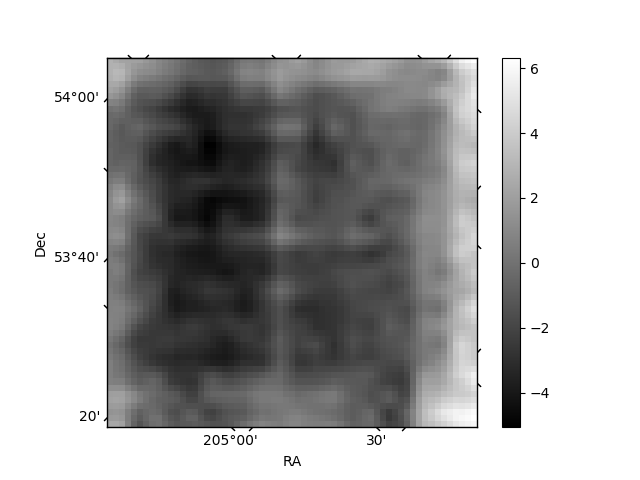
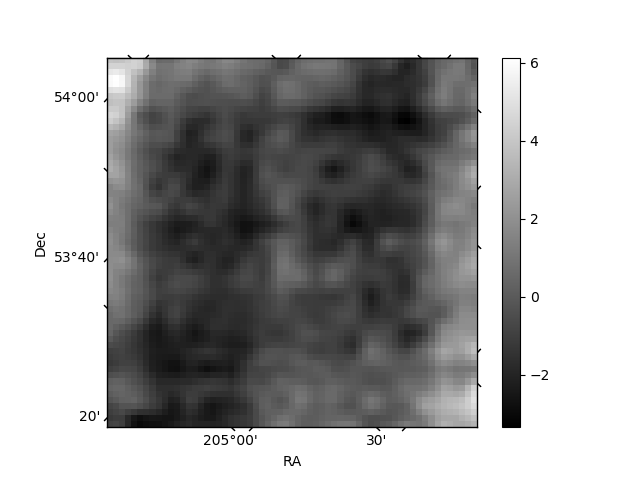
Histogram calculated using DETX and DETY for each event in the final _common_clean file
| Quadrant A | 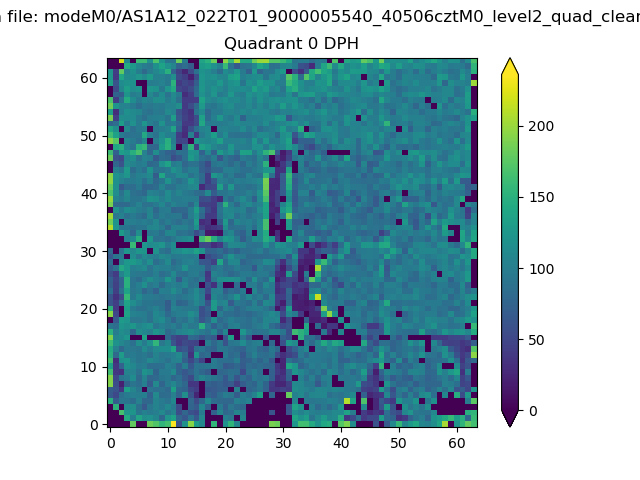 |
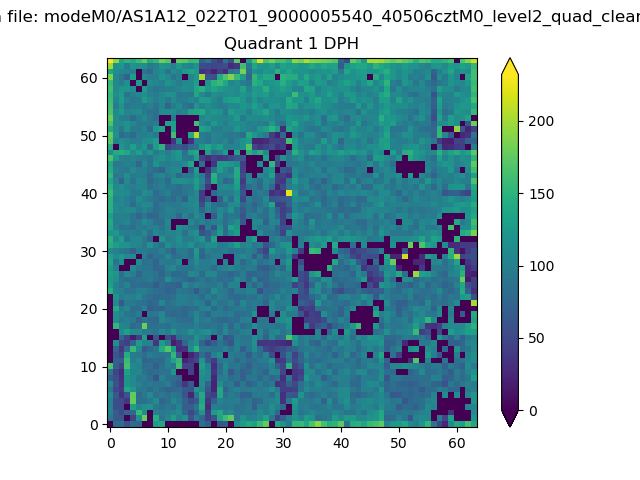 |
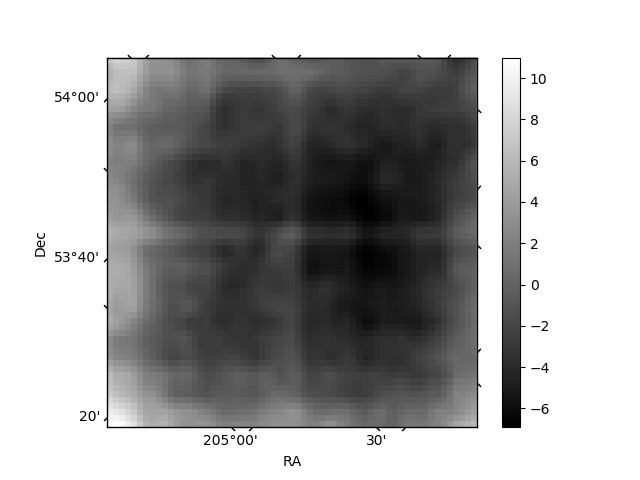
Quadrant B |
|---|---|---|---|
| Quadrant D | 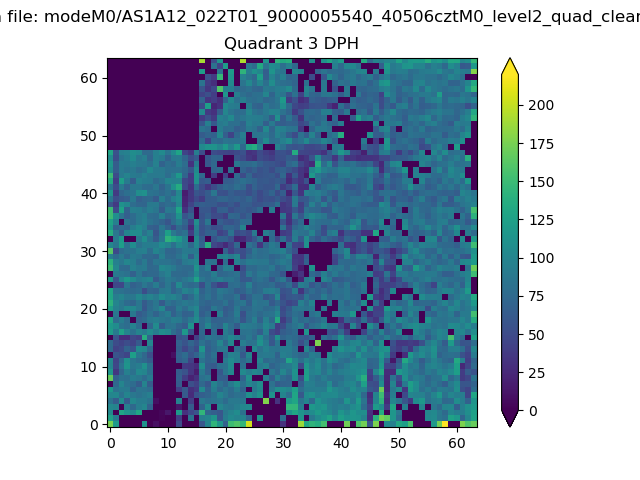 |
 |
Quadrant C |
| Plot type | Count rate plots | Images |
|---|---|---|
| Comparison with Poisson distribution Blue bars denote a histogram of data divided into 1 sec bins. Red curve is a Poisson curve with rate = median count rate of data. |
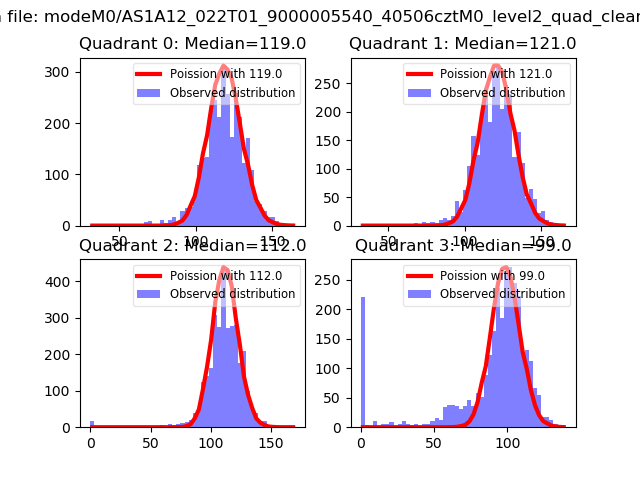 |
 |
| Quadrant-wise count rates Data is divided into 100 sec bins |
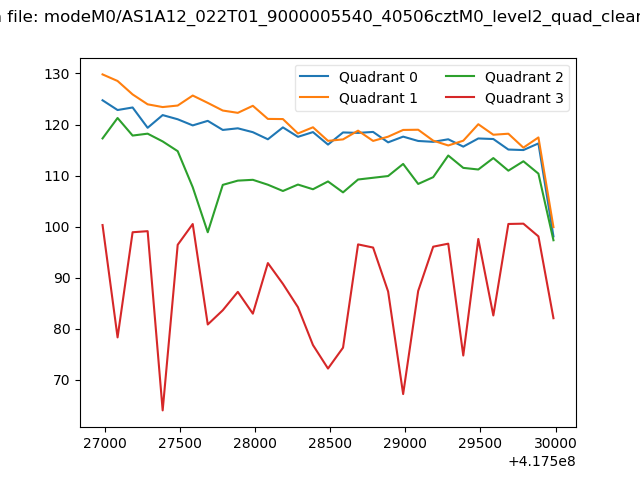 |
|
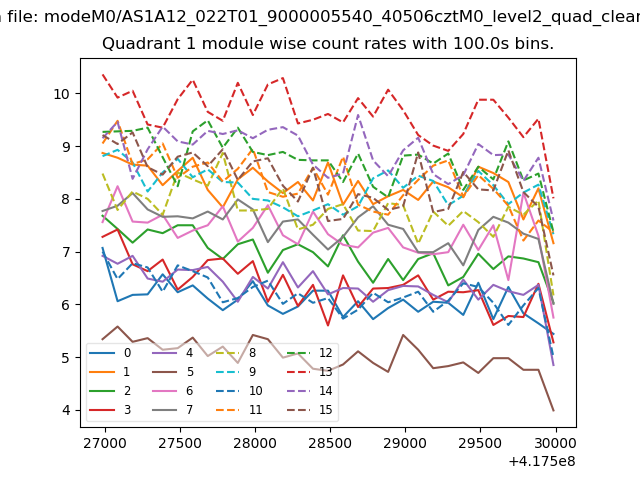
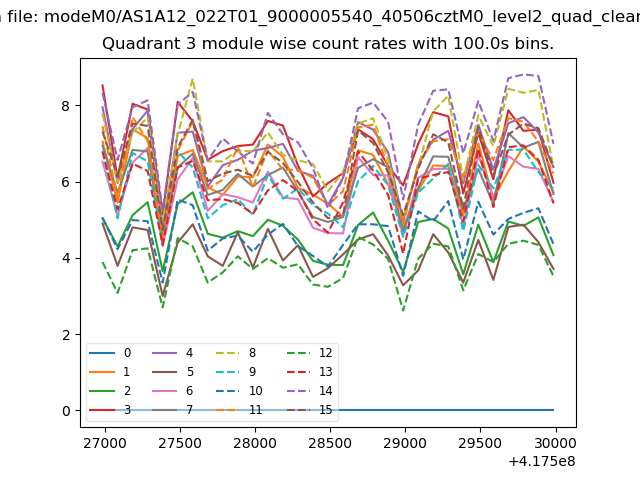
| Module-wise count rates for Quadrant A Data is divided into 100 sec bins |
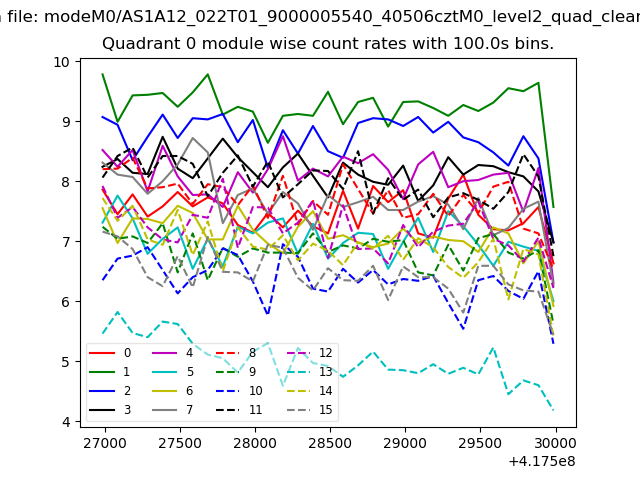 |
 |
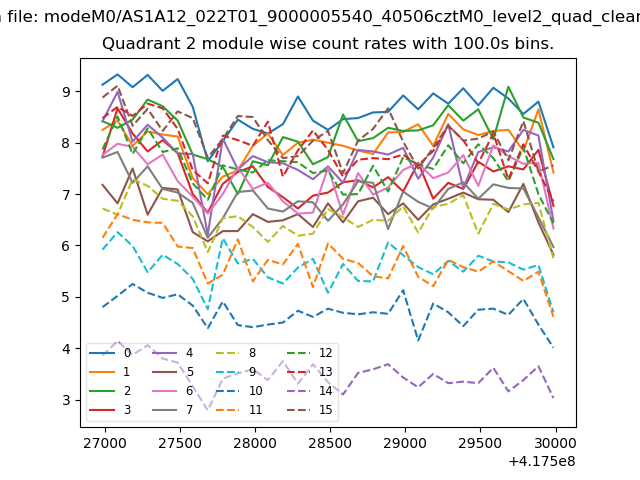
| Module-wise count rates for Quadrant B Data is divided into 100 sec bins |
 |
 |
| Module-wise count rates for Quadrant C Data is divided into 100 sec bins |
 |
 |
| Module-wise count rates for Quadrant D Data is divided into 100 sec bins |
 |
 |
| Parameter | Plot |
|---|---|
| CZT HV Monitor | 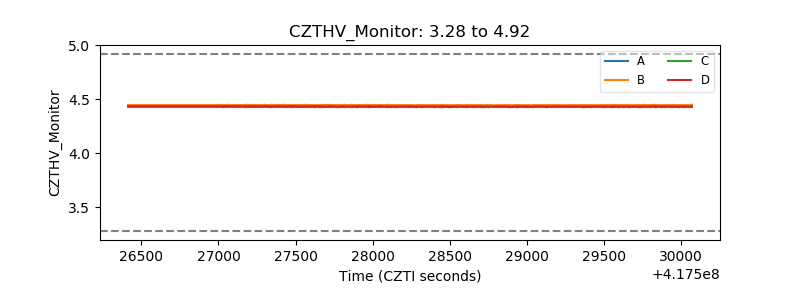 |
| D_VDD | 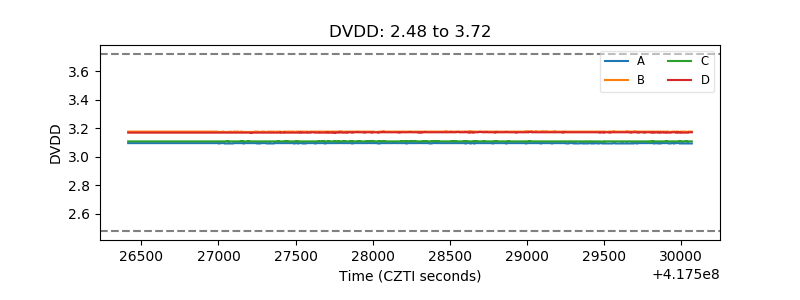 |
| Temperature 1 | 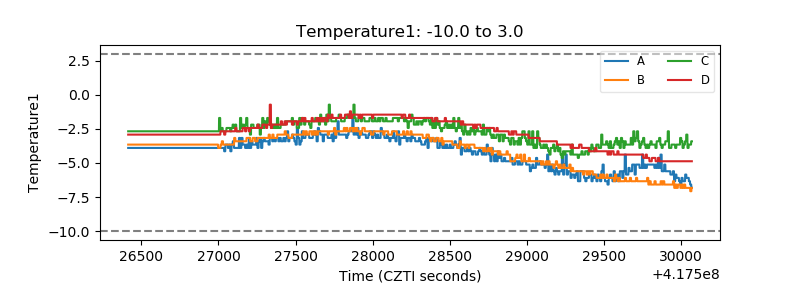 |
| Veto HV Monitor | 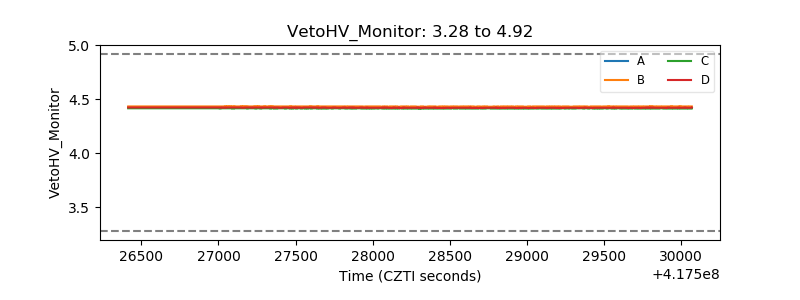 |
| Veto LLD | 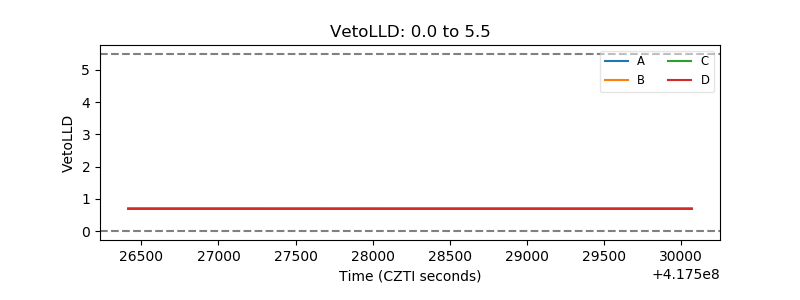 |
| Alpha Counter | 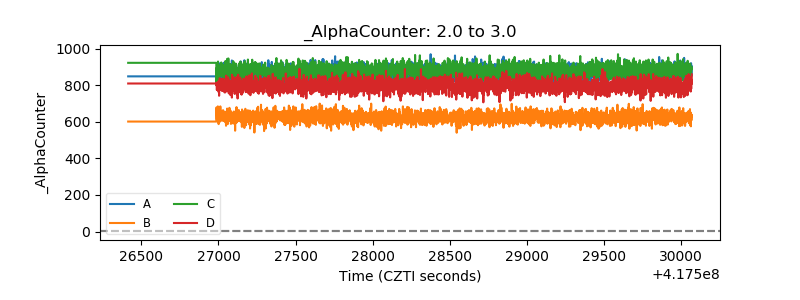 |
| _CPM_Rate | 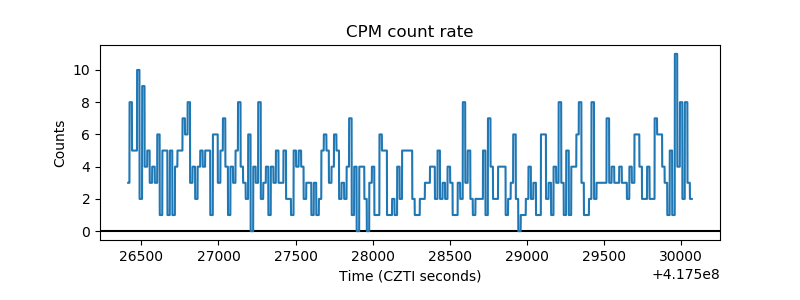 |
| CZT Counter | 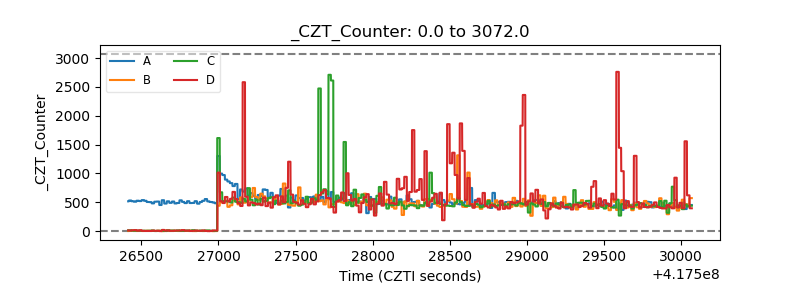 |
| +2.5 Volts monitor | 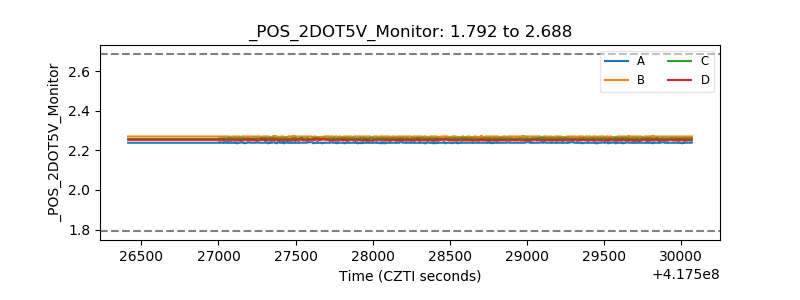 |
| +5 Volts monitor | 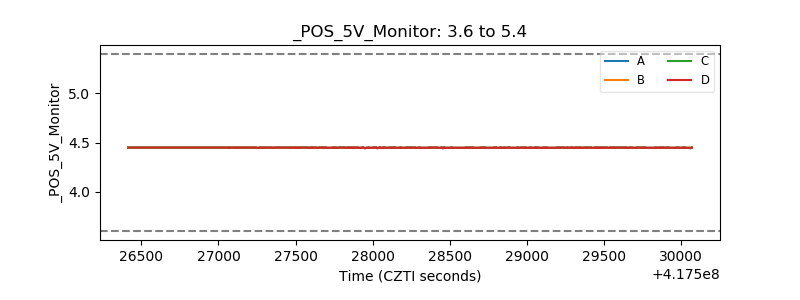 |
| _ROLL_ROT | 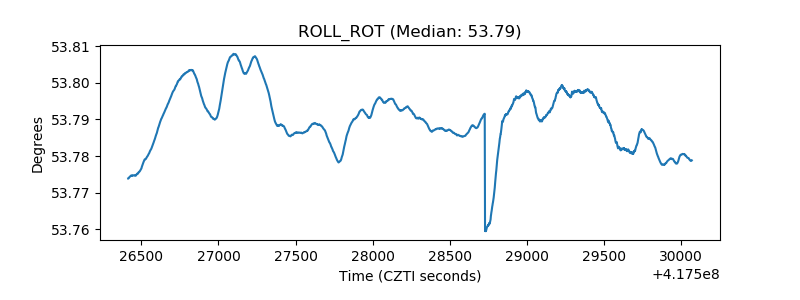 |
| _Roll_DEC | 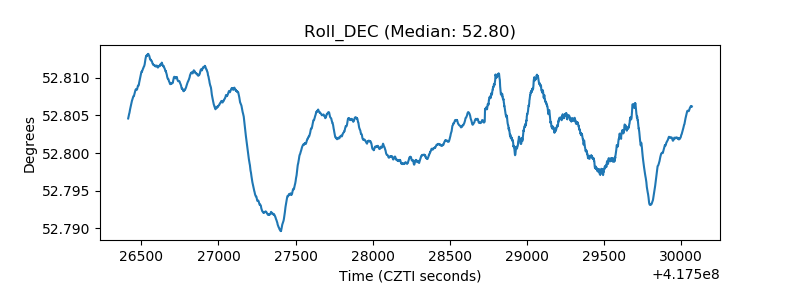 |
| _Roll_RA | 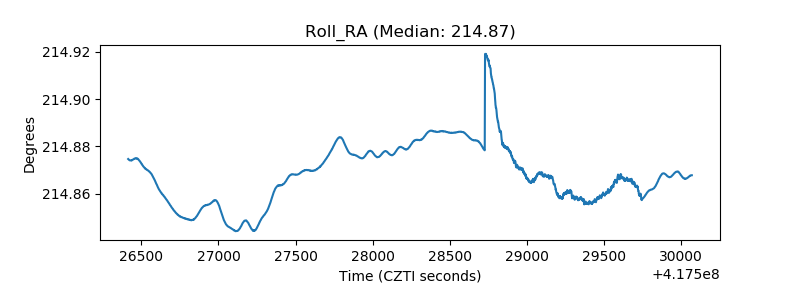 |
| Veto Counter | 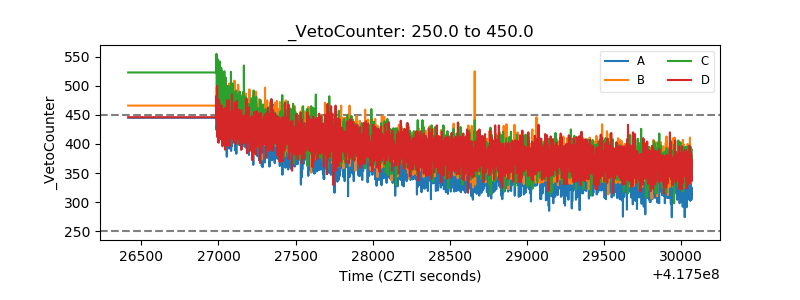 |