| Param | Original file | Final file |
|---|---|---|
| Filename | modeM0/AS1A12_097T02_9000005542_40507cztM0_level2.fits | modeM0/AS1A12_097T02_9000005542_40507cztM0_level2_quad_clean.evt |
| Size (bytes) | 353,963,520 | 88,588,800 |
| Size | 337.6 MB | 84.5 MB |
| Events in quadrant A | 2,994,585 | 619,302 |
| Events in quadrant B | 3,582,506 | 617,222 |
| Events in quadrant C | 2,749,501 | 600,645 |
| Events in quadrant D | 3,348,377 | 462,097 |
| Mode M0 | |||
|---|---|---|---|
| Quadrant | BADHDUFLAG | Total packets | Discarded packets |
| A | 0 | 12241 | 3 |
| B | 0 | 14355 | 2 |
| C | 0 | 11645 | 2 |
| D | 0 | 13642 | 2 |
| Mode SS | |||
|---|---|---|---|
| Quadrant | BADHDUFLAG | Total packets | Discarded packets |
| A | 0 | 110 | 0 |
| B | 0 | 110 | 0 |
| C | 0 | 110 | 0 |
| D | 0 | 110 | 0 |
| Mode M9 | |||
|---|---|---|---|
| Quadrant | BADHDUFLAG | Total packets | Discarded packets |
| A | 0 | 28 | 0 |
| B | 0 | 28 | 0 |
| C | 0 | 28 | 0 |
| D | 0 | 29 | 0 |
| Quadrant | Total seconds | Saturated seconds | Saturation percentage |
|---|---|---|---|
| A | 5478 | 20 | 0.365097% |
| B | 5478 | 176 | 3.212851% |
| C | 5478 | 39 | 0.711939% |
| D | 5478 | 1154 | 21.066083% |
Noise dominated data is calculated using 1-second bins in cleaned event files. If a bin has >2000 counts, and if more than 50% of those come from <1% of pixels, then it is considered to be noise-dominated and hence unusable.
| Quadrant | # 1 sec bins | Bins with >0 counts | Bins with >2000 counts | High rate bins dominated by noise | Noise dominated (total time) | Noise dominated (detector-on time) | Marked lightcurve |
|---|---|---|---|---|---|---|---|
| A | 7299 | 5479 | 5 | 5 | 0.07% | 0.09% | 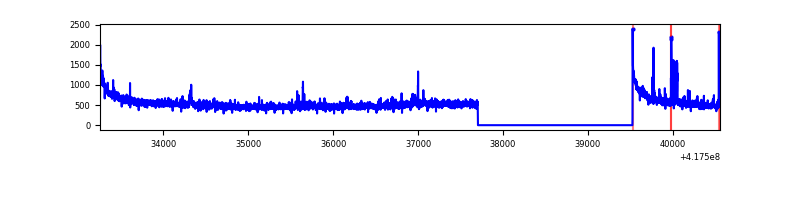 |
| B | 7299 | 5479 | 156 | 156 | 2.14% | 2.85% | 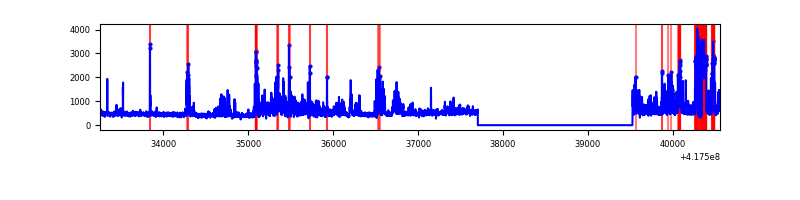 |
| C | 7299 | 5479 | 27 | 27 | 0.37% | 0.49% | 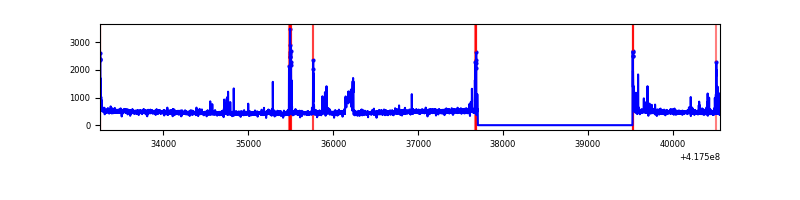 |
| D | 7298 | 5478 | 112 | 112 | 1.53% | 2.04% | 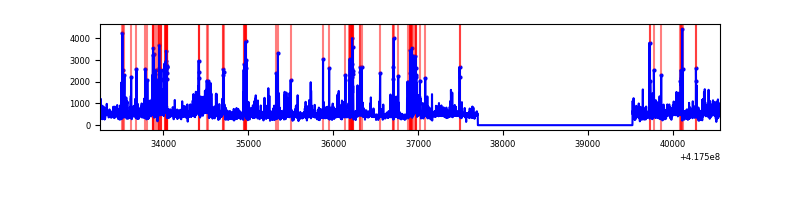 |
Top three noisy pixels from each quadrant. If the there are fewer than three noisy pixels in the level2.evt file, extra rows are filled as -1
| Pixel properties | Quadrant properties | ||||||
|---|---|---|---|---|---|---|---|
| Quadrant | DetID | PixID | Counts | Sigma | Mean | Median | Sigma |
| A | 10 | 83 | 532178 | 4312.4 | 598 | 587 | 123.3 |
| A | 12 | 189 | 85714 | 690.57 | 598 | 587 | 123.3 |
| A | 2 | 79 | 51438 | 412.52 | 598 | 587 | 123.3 |
| B | 4 | 170 | 517612 | 4480.84 | 587 | 571 | 115.4 |
| B | 5 | 32 | 331653 | 2869.26 | 587 | 571 | 115.4 |
| B | 3 | 112 | 290476 | 2512.41 | 587 | 571 | 115.4 |
| C | 15 | 214 | 236878 | 1715.55 | 582 | 585 | 137.7 |
| C | 14 | 254 | 138350 | 1000.21 | 582 | 585 | 137.7 |
| C | 10 | 20 | 55206 | 396.56 | 582 | 585 | 137.7 |
| D | 12 | 227 | 542933 | 4120.06 | 525 | 511 | 131.7 |
| D | 12 | 191 | 262957 | 1993.45 | 525 | 511 | 131.7 |
| D | 2 | 250 | 141263 | 1069.11 | 525 | 511 | 131.7 |
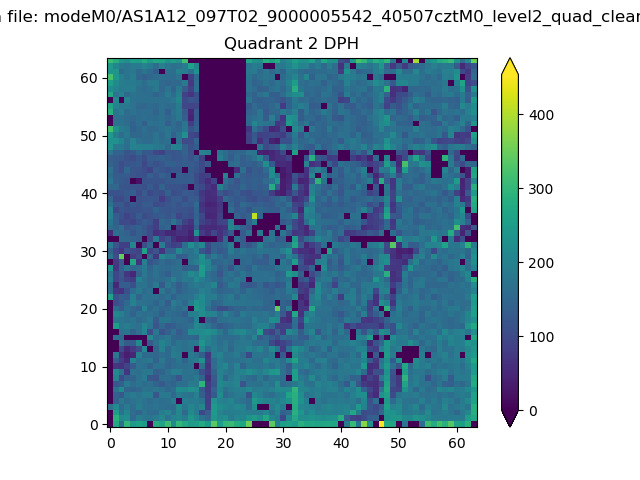
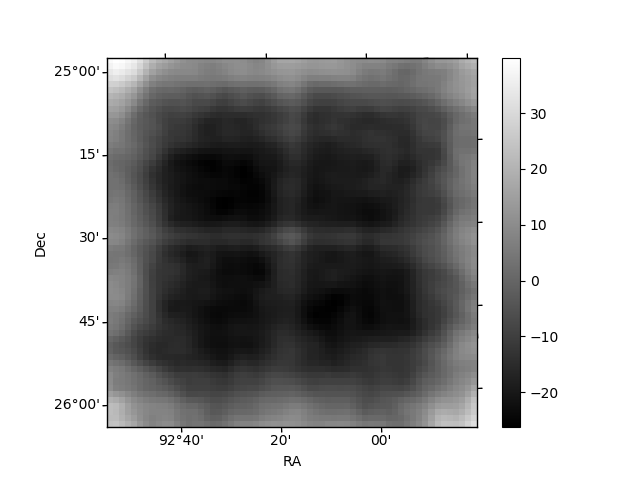
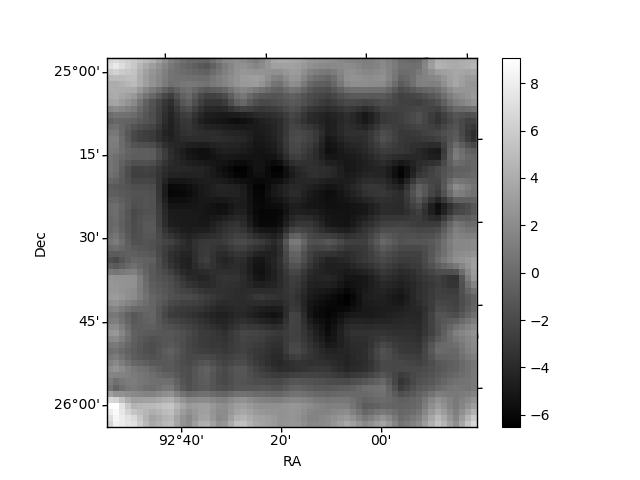
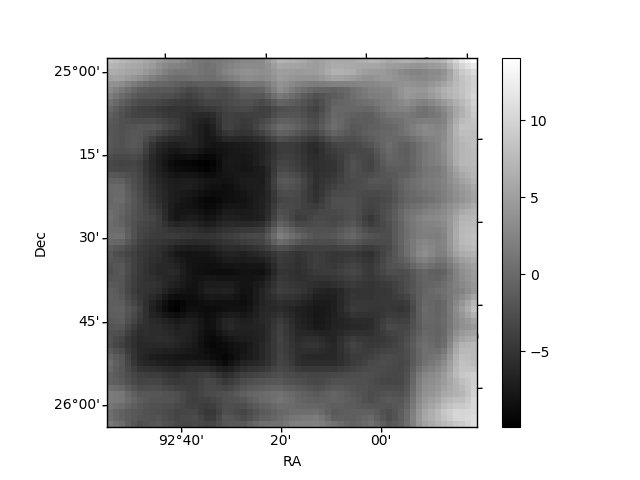
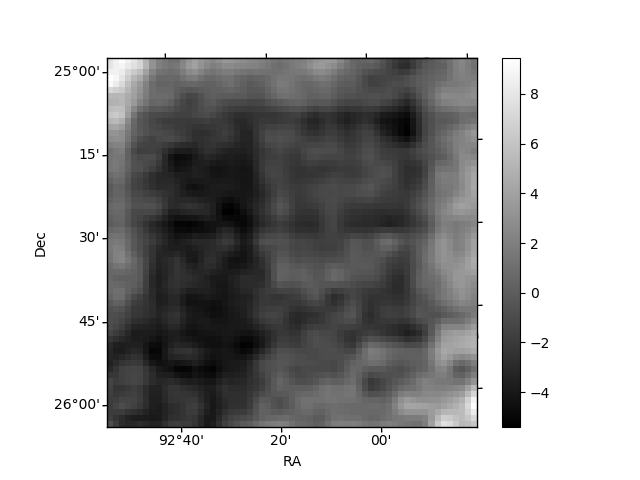
Histogram calculated using DETX and DETY for each event in the final _common_clean file
| Quadrant A | 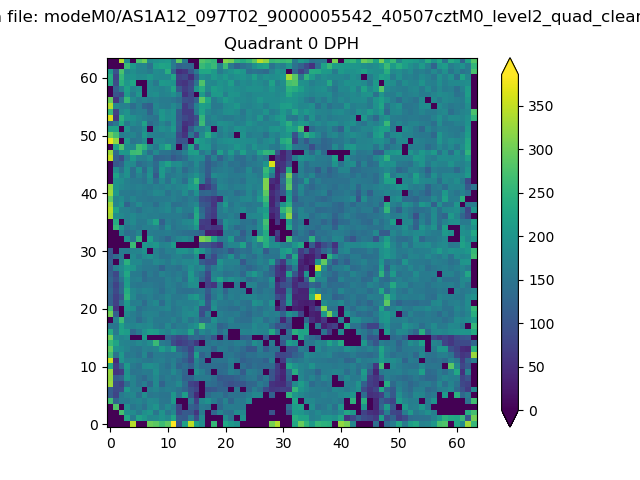 |
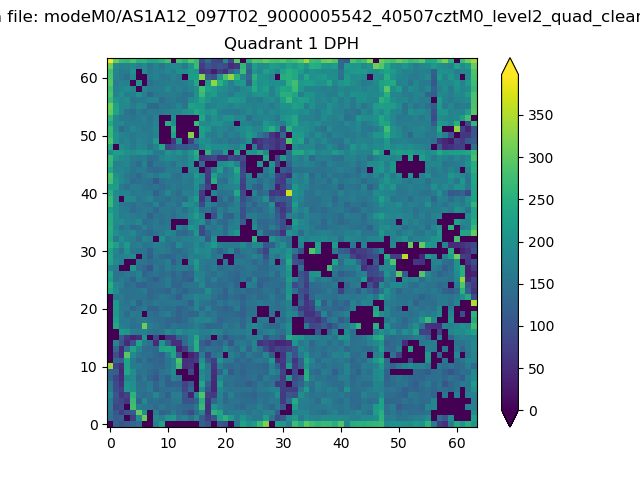 |
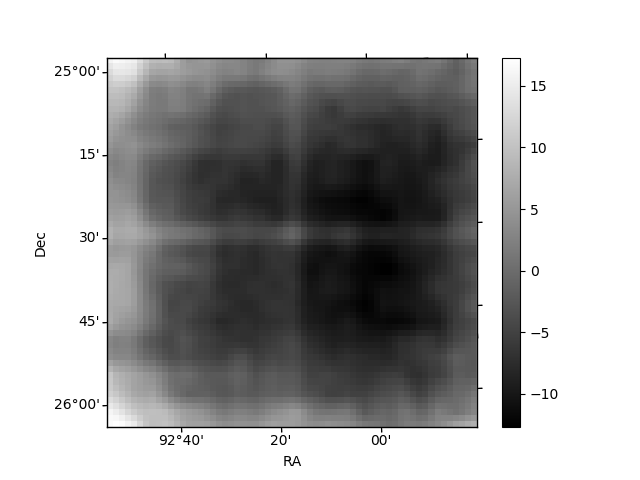
Quadrant B |
|---|---|---|---|
| Quadrant D | 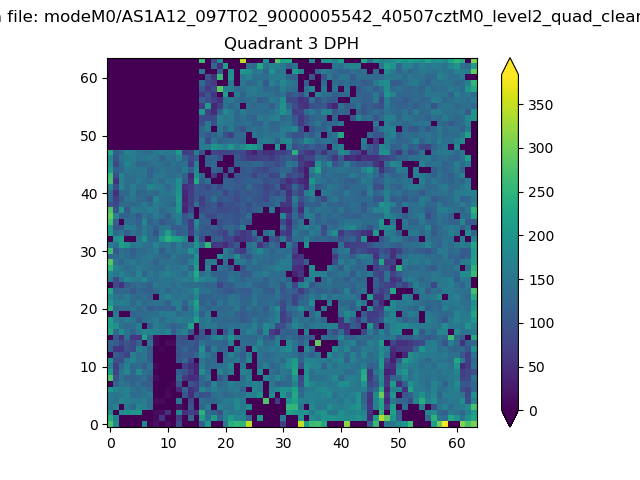 |
 |
Quadrant C |
| Plot type | Count rate plots | Images |
|---|---|---|
| Comparison with Poisson distribution Blue bars denote a histogram of data divided into 1 sec bins. Red curve is a Poisson curve with rate = median count rate of data. |
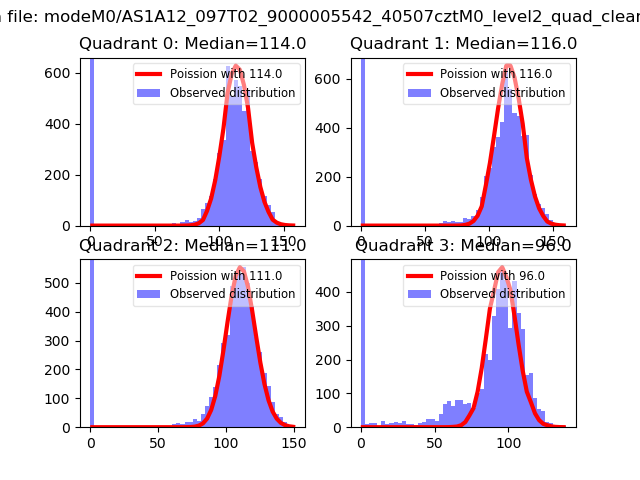 |
 |
| Quadrant-wise count rates Data is divided into 100 sec bins |
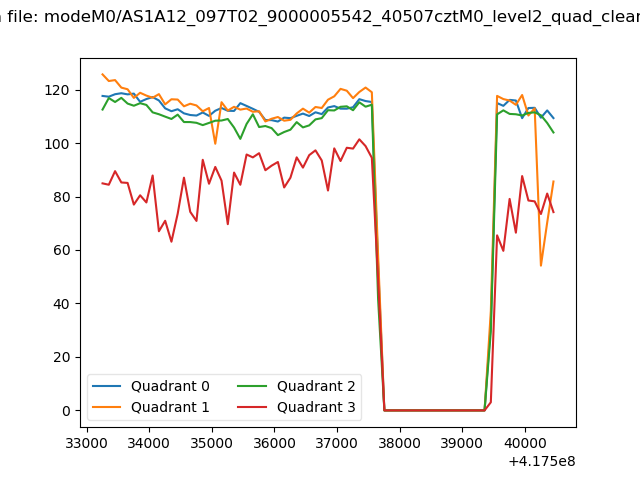 |
|
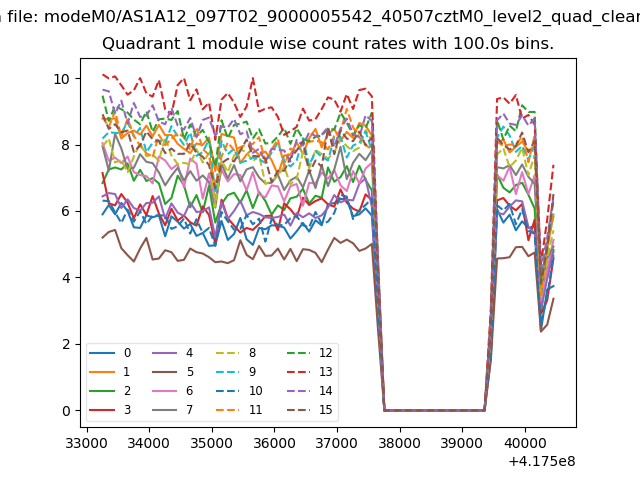
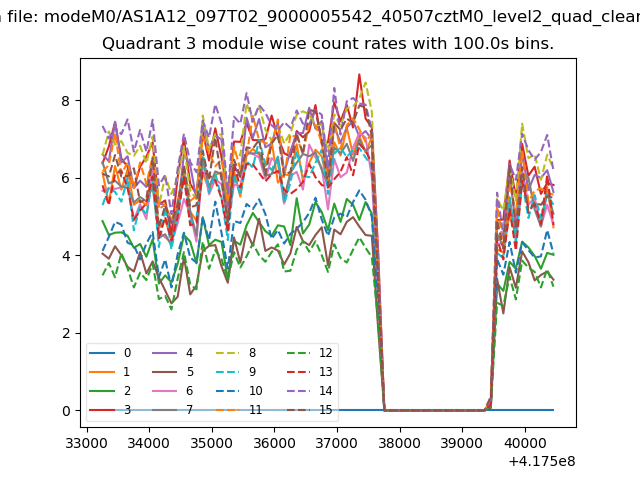
| Module-wise count rates for Quadrant A Data is divided into 100 sec bins |
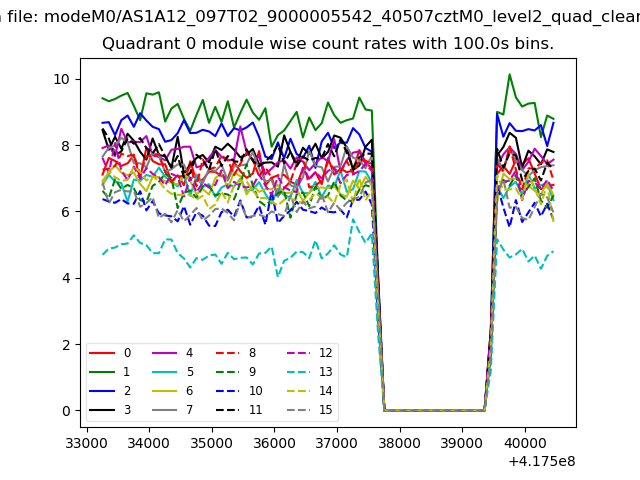 |
 |
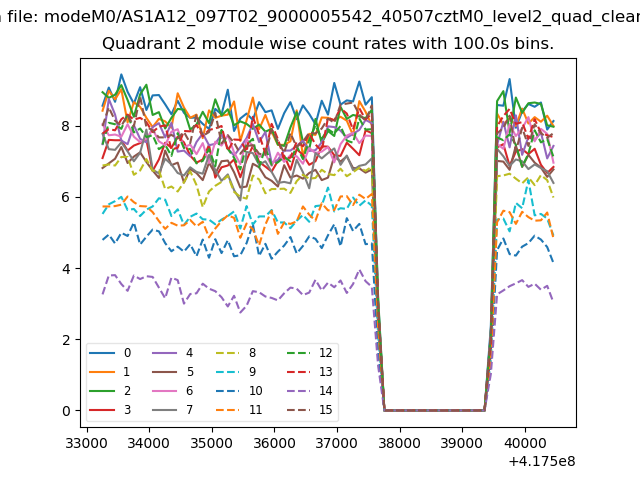
| Module-wise count rates for Quadrant B Data is divided into 100 sec bins |
 |
 |
| Module-wise count rates for Quadrant C Data is divided into 100 sec bins |
 |
 |
| Module-wise count rates for Quadrant D Data is divided into 100 sec bins |
 |
 |
| Parameter | Plot |
|---|---|
| CZT HV Monitor | 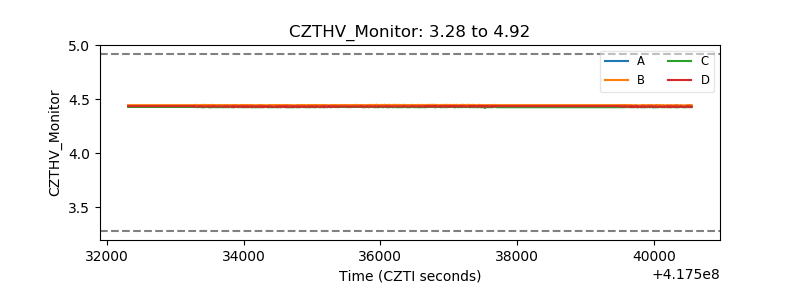 |
| D_VDD | 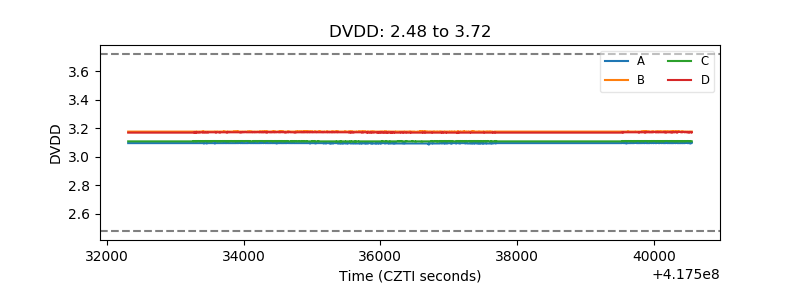 |
| Temperature 1 | 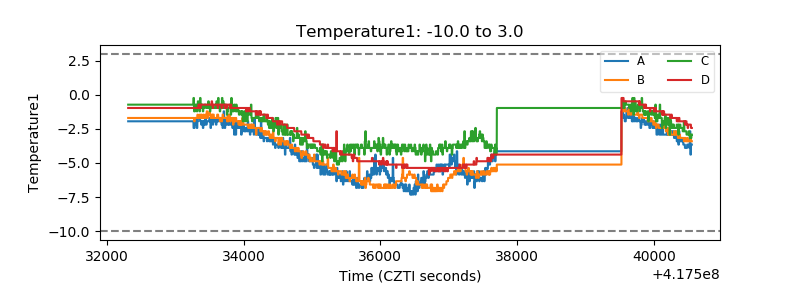 |
| Veto HV Monitor | 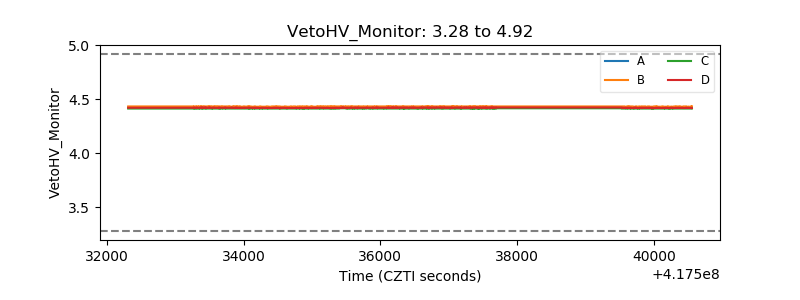 |
| Veto LLD | 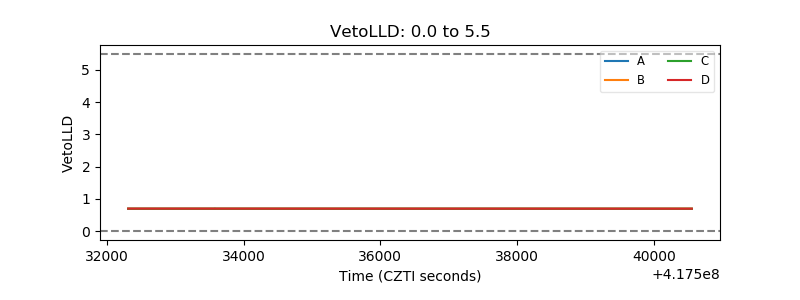 |
| Alpha Counter | 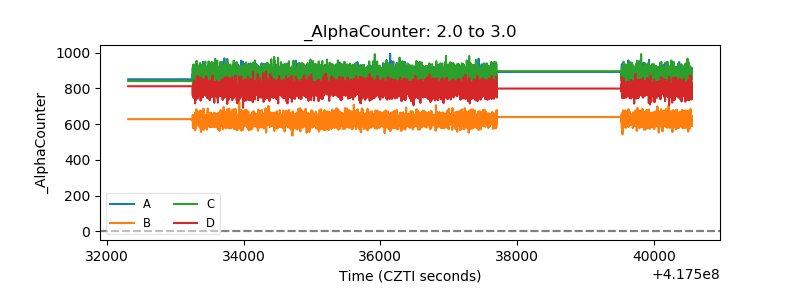 |
| _CPM_Rate | 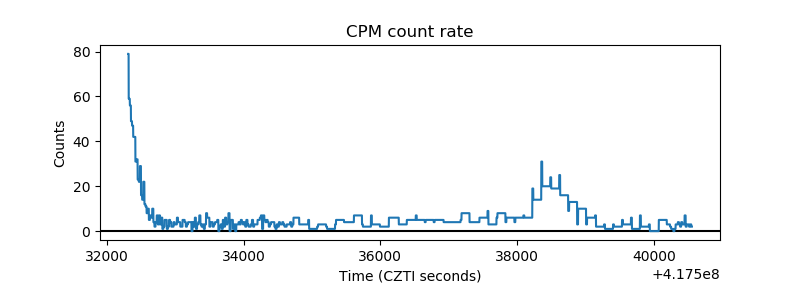 |
| CZT Counter | 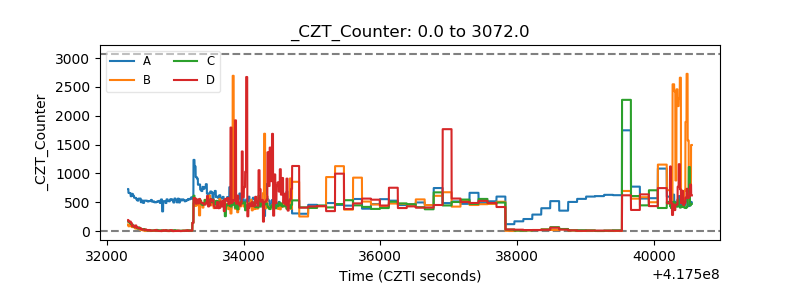 |
| +2.5 Volts monitor | 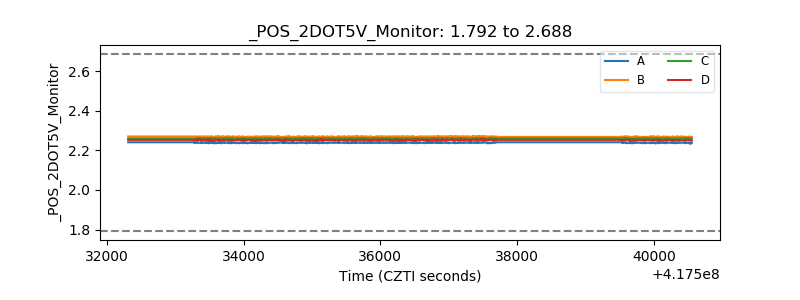 |
| +5 Volts monitor | 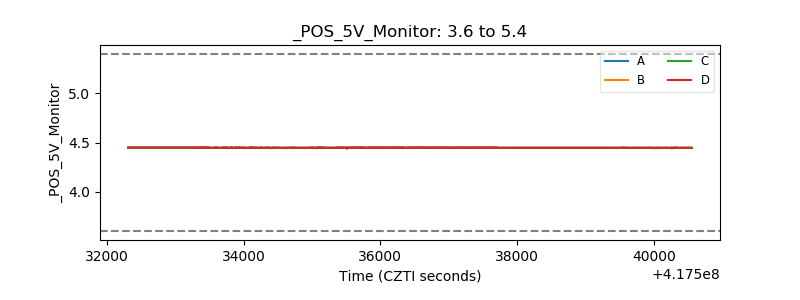 |
| _ROLL_ROT | 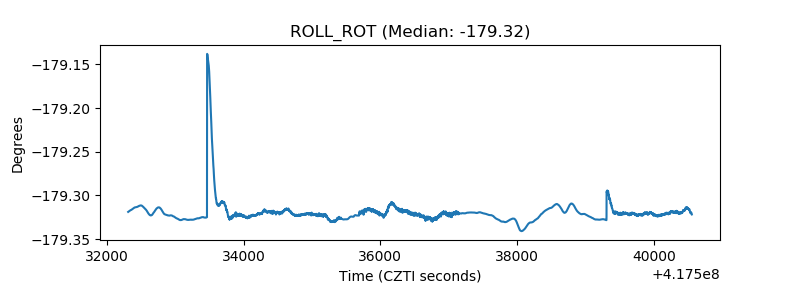 |
| _Roll_DEC | 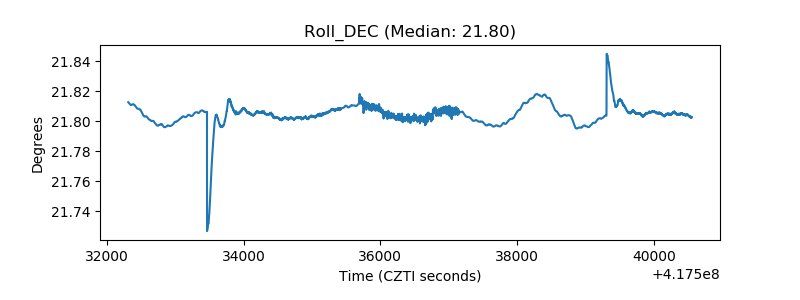 |
| _Roll_RA | 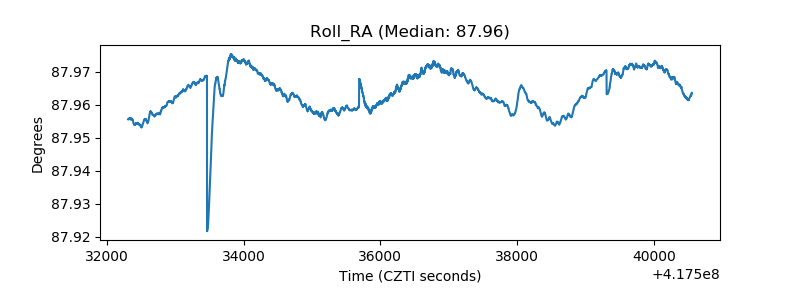 |
| Veto Counter | 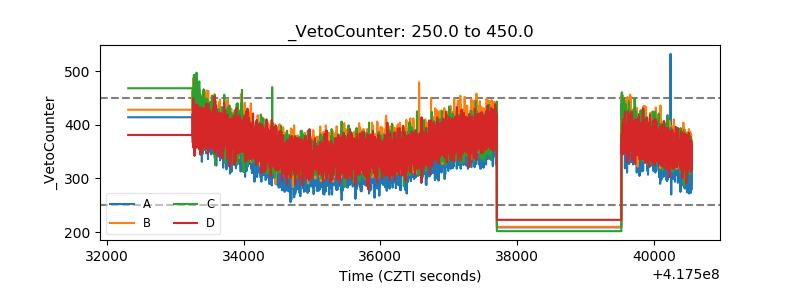 |