| Param | Original file | Final file |
|---|---|---|
| Filename | modeM0/AS1A12_097T02_9000005542_40508cztM0_level2.fits | modeM0/AS1A12_097T02_9000005542_40508cztM0_level2_quad_clean.evt |
| Size (bytes) | 381,945,600 | 87,946,560 |
| Size | 364.3 MB | 83.9 MB |
| Events in quadrant A | 3,056,882 | 622,710 |
| Events in quadrant B | 4,071,559 | 617,447 |
| Events in quadrant C | 3,250,985 | 595,140 |
| Events in quadrant D | 3,321,101 | 435,012 |
| Mode M0 | |||
|---|---|---|---|
| Quadrant | BADHDUFLAG | Total packets | Discarded packets |
| A | 0 | 12519 | 3 |
| B | 0 | 15809 | 2 |
| C | 0 | 13185 | 2 |
| D | 0 | 13627 | 2 |
| Mode SS | |||
|---|---|---|---|
| Quadrant | BADHDUFLAG | Total packets | Discarded packets |
| A | 0 | 114 | 0 |
| B | 0 | 114 | 0 |
| C | 0 | 114 | 0 |
| D | 0 | 114 | 0 |
| Mode M9 | |||
|---|---|---|---|
| Quadrant | BADHDUFLAG | Total packets | Discarded packets |
| A | 0 | 25 | 0 |
| B | 0 | 25 | 0 |
| C | 0 | 25 | 0 |
| D | 0 | 26 | 0 |
| Quadrant | Total seconds | Saturated seconds | Saturation percentage |
|---|---|---|---|
| A | 5608 | 27 | 0.481455% |
| B | 5608 | 245 | 4.368759% |
| C | 5608 | 165 | 2.942225% |
| D | 5608 | 1501 | 26.765335% |
Noise dominated data is calculated using 1-second bins in cleaned event files. If a bin has >2000 counts, and if more than 50% of those come from <1% of pixels, then it is considered to be noise-dominated and hence unusable.
| Quadrant | # 1 sec bins | Bins with >0 counts | Bins with >2000 counts | High rate bins dominated by noise | Noise dominated (total time) | Noise dominated (detector-on time) | Marked lightcurve |
|---|---|---|---|---|---|---|---|
| A | 7101 | 5609 | 9 | 9 | 0.13% | 0.16% | 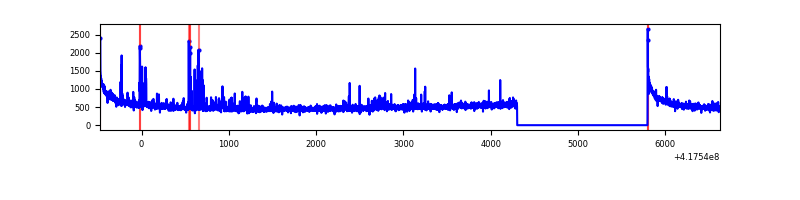 |
| B | 7101 | 5609 | 195 | 195 | 2.75% | 3.48% | 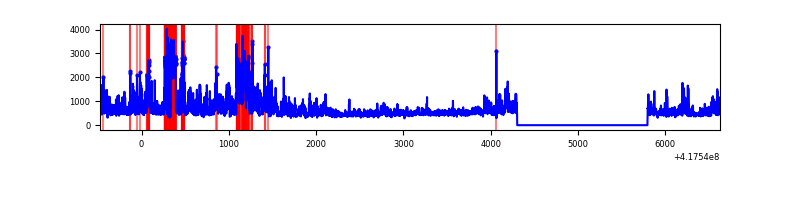 |
| C | 7101 | 5609 | 139 | 139 | 1.96% | 2.48% | 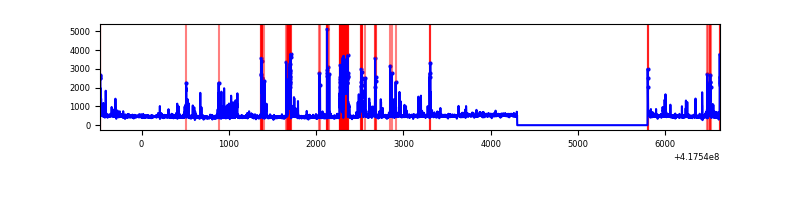 |
| D | 7101 | 5609 | 138 | 138 | 1.94% | 2.46% | 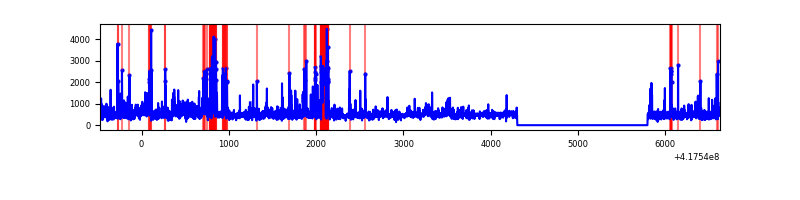 |
Top three noisy pixels from each quadrant. If the there are fewer than three noisy pixels in the level2.evt file, extra rows are filled as -1
| Pixel properties | Quadrant properties | ||||||
|---|---|---|---|---|---|---|---|
| Quadrant | DetID | PixID | Counts | Sigma | Mean | Median | Sigma |
| A | 10 | 83 | 540187 | 4260.12 | 610 | 597 | 126.7 |
| A | 2 | 79 | 109411 | 859.1 | 610 | 597 | 126.7 |
| A | 12 | 189 | 31400 | 243.19 | 610 | 597 | 126.7 |
| B | 3 | 112 | 714934 | 6092.4 | 601 | 585 | 117.3 |
| B | 5 | 32 | 358731 | 3054.49 | 601 | 585 | 117.3 |
| B | 4 | 170 | 278526 | 2370.45 | 601 | 585 | 117.3 |
| C | 14 | 254 | 641282 | 4563.08 | 592 | 596 | 140.4 |
| C | 15 | 214 | 242810 | 1725.09 | 592 | 596 | 140.4 |
| C | 0 | 10 | 28573 | 199.26 | 592 | 596 | 140.4 |
| D | 12 | 191 | 296600 | 2242.53 | 522 | 506 | 132.0 |
| D | 2 | 250 | 289403 | 2188.03 | 522 | 506 | 132.0 |
| D | 12 | 227 | 217067 | 1640.17 | 522 | 506 | 132.0 |
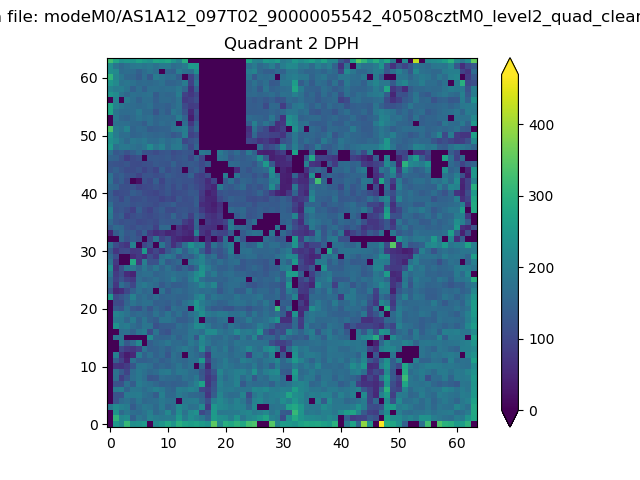
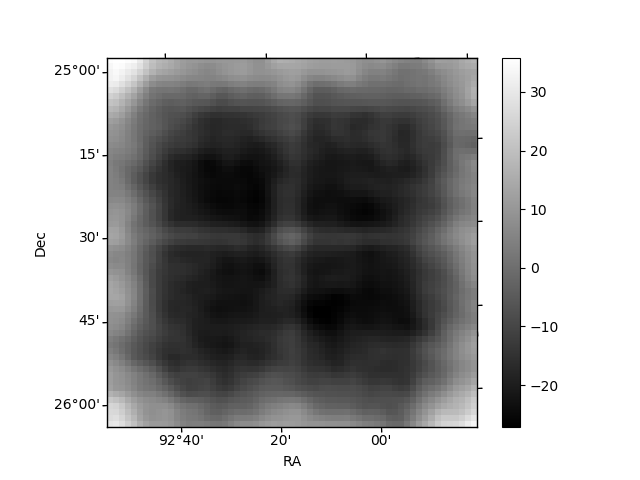
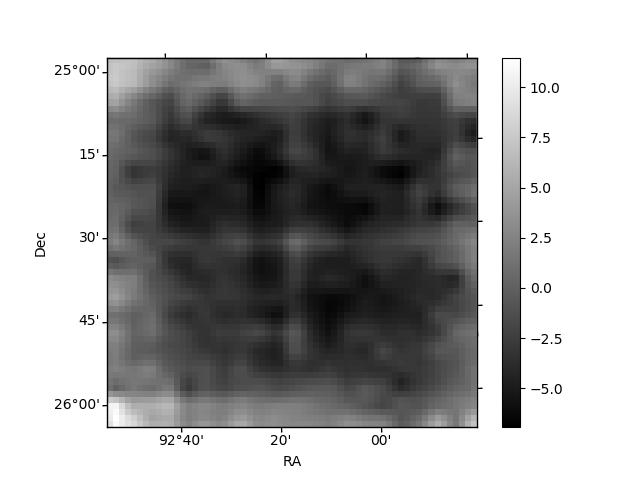
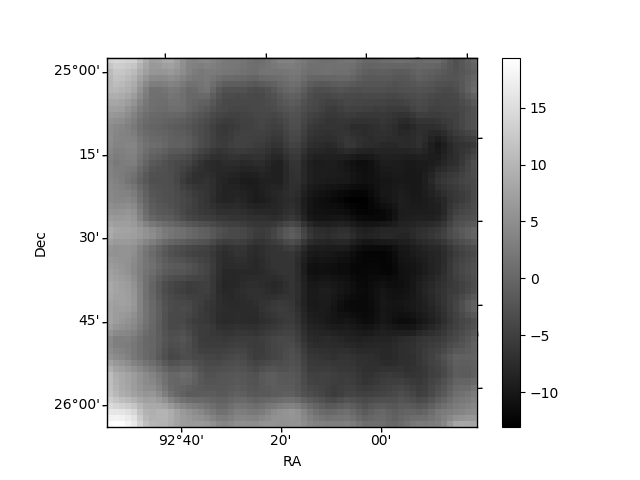
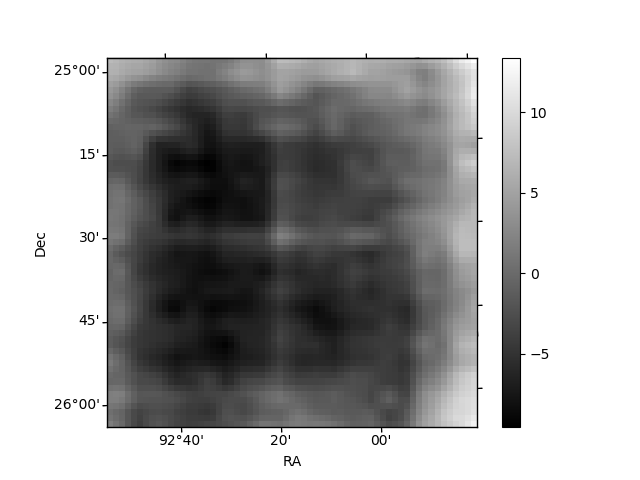
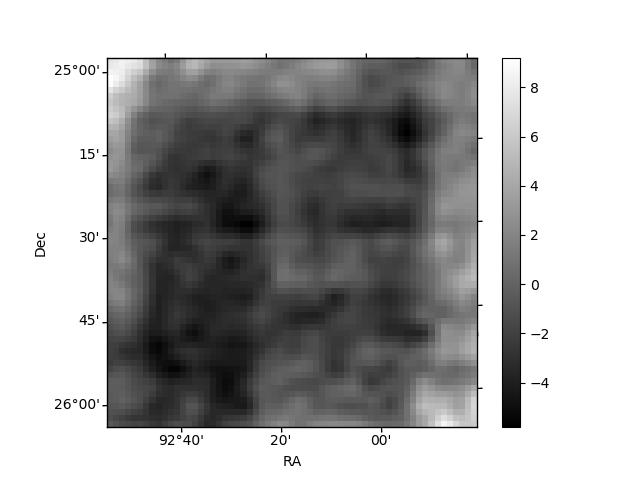
Histogram calculated using DETX and DETY for each event in the final _common_clean file
| Quadrant A | 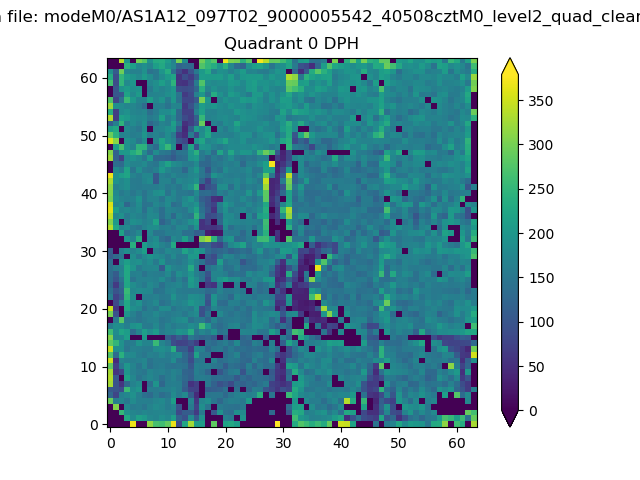 |
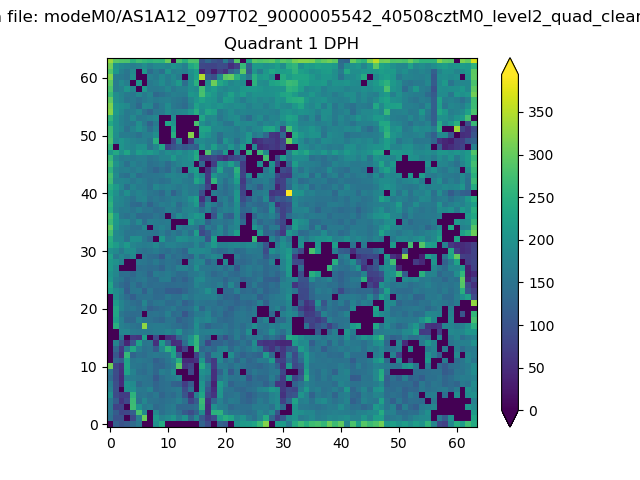 |
Quadrant B |
|---|---|---|---|
| Quadrant D | 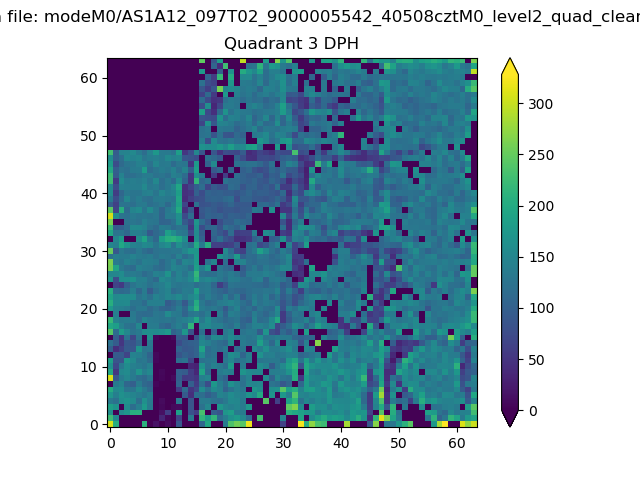 |
 |
Quadrant C |
| Plot type | Count rate plots | Images |
|---|---|---|
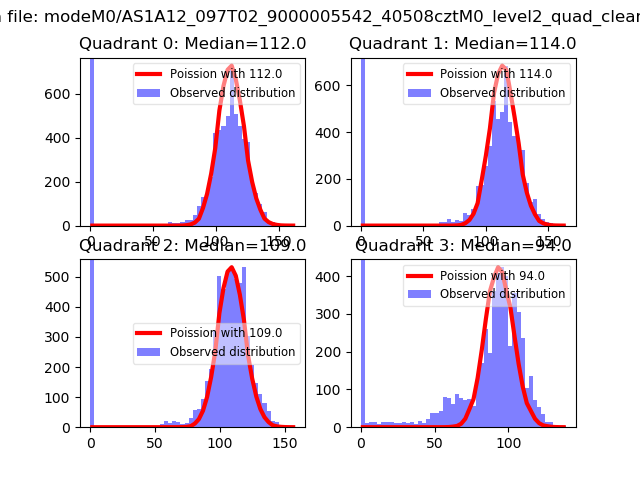
| Comparison with Poisson distribution Blue bars denote a histogram of data divided into 1 sec bins. Red curve is a Poisson curve with rate = median count rate of data. |
 |
 |
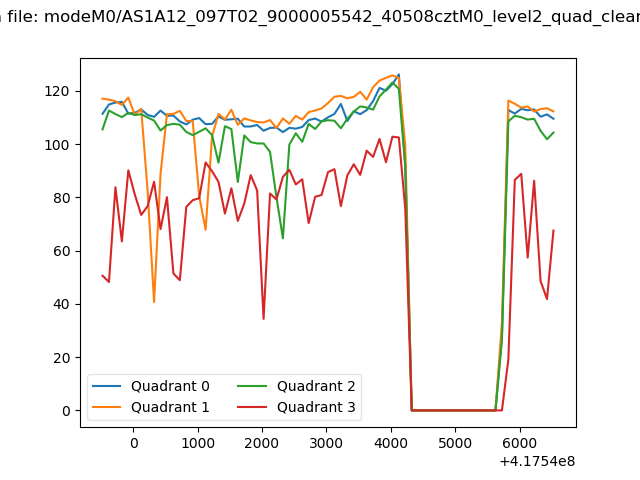
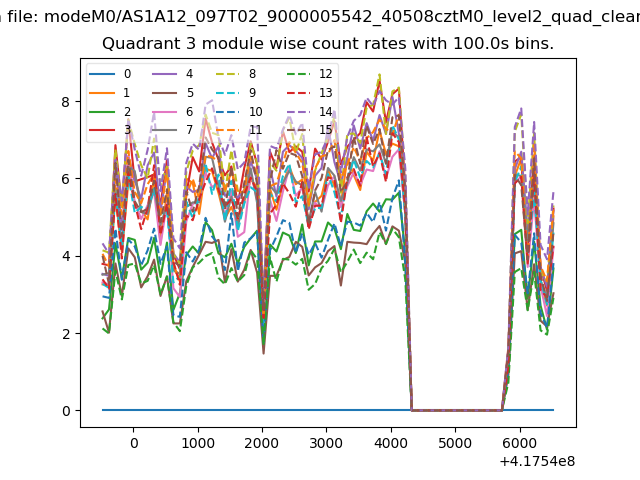
| Quadrant-wise count rates Data is divided into 100 sec bins |
 |
|
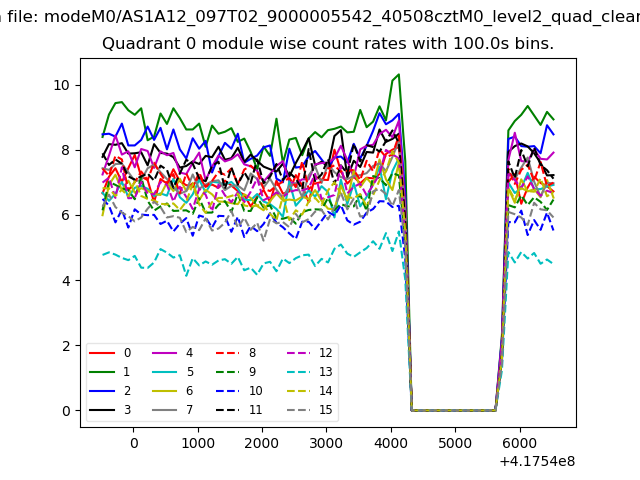
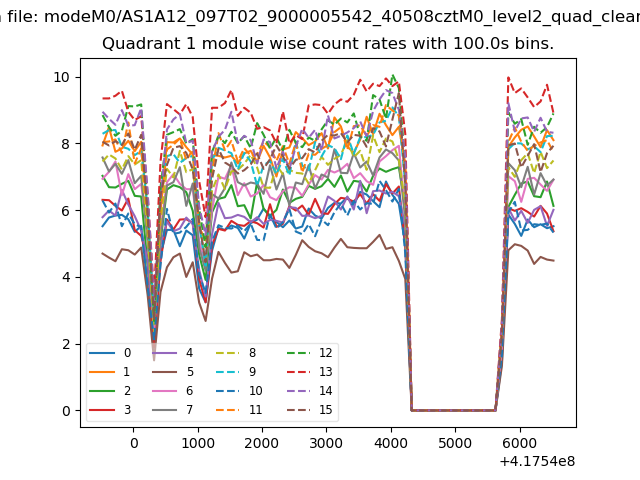
| Module-wise count rates for Quadrant A Data is divided into 100 sec bins |
 |
 |
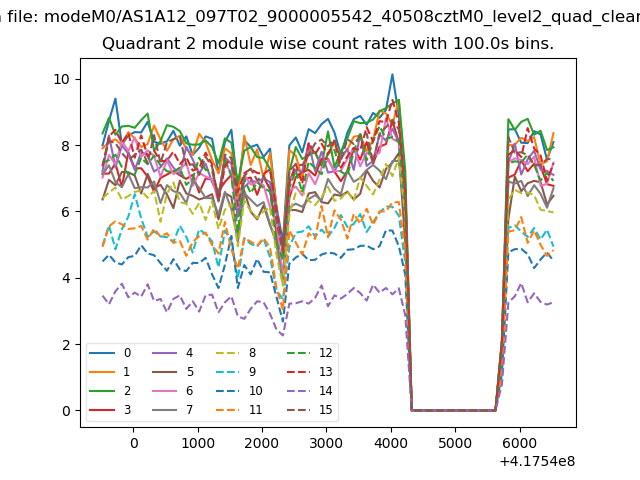
| Module-wise count rates for Quadrant B Data is divided into 100 sec bins |
 |
 |
| Module-wise count rates for Quadrant C Data is divided into 100 sec bins |
 |
 |
| Module-wise count rates for Quadrant D Data is divided into 100 sec bins |
 |
 |
| Parameter | Plot |
|---|---|
| CZT HV Monitor | 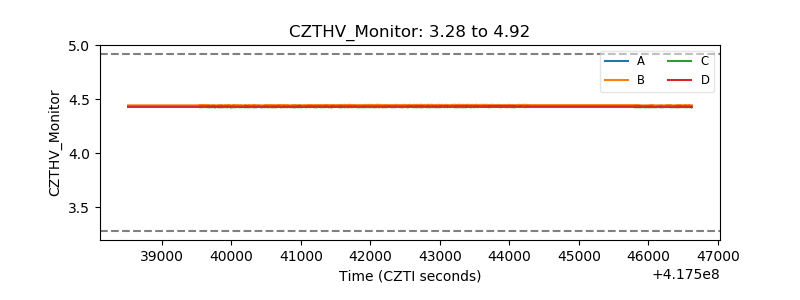 |
| D_VDD | 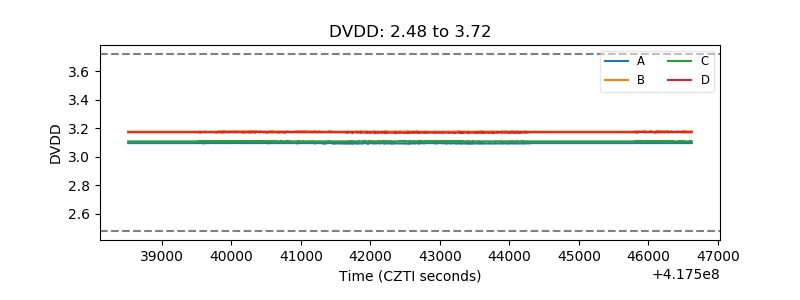 |
| Temperature 1 | 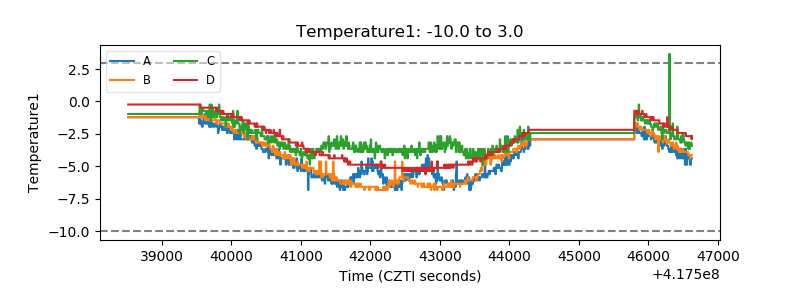 |
| Veto HV Monitor | 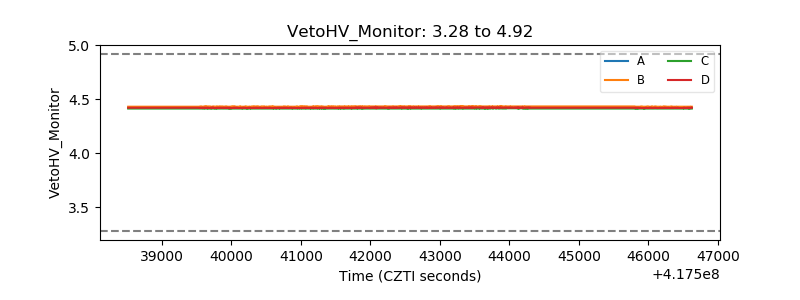 |
| Veto LLD | 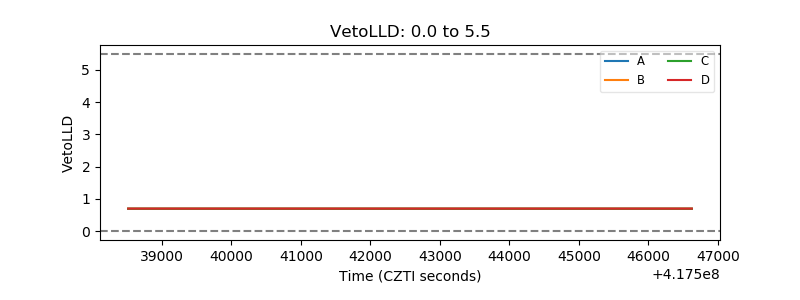 |
| Alpha Counter | 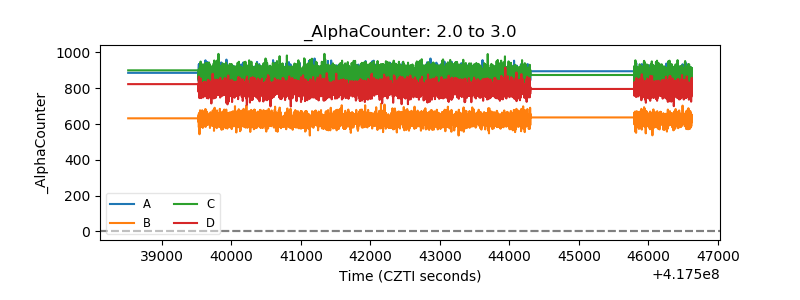 |
| _CPM_Rate | 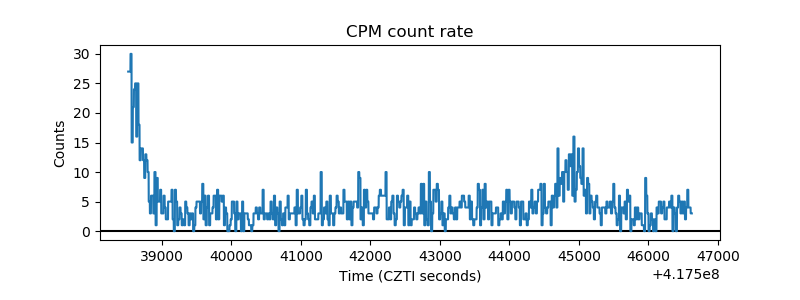 |
| CZT Counter | 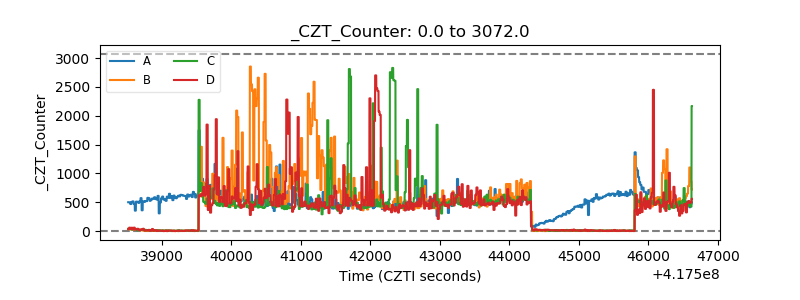 |
| +2.5 Volts monitor | 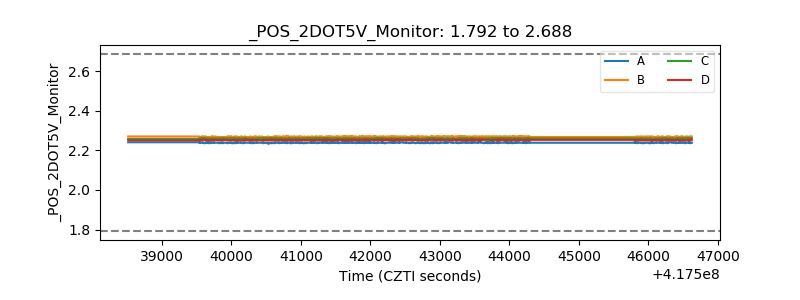 |
| +5 Volts monitor | 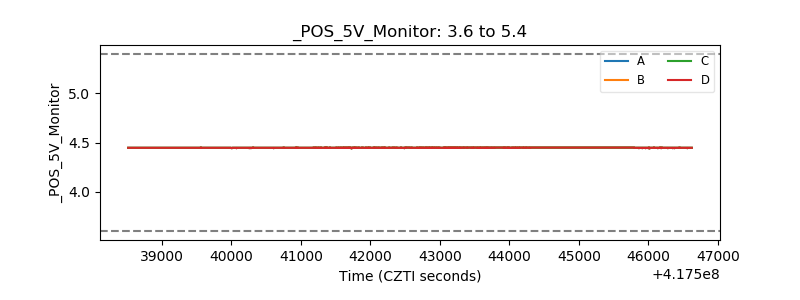 |
| _ROLL_ROT | 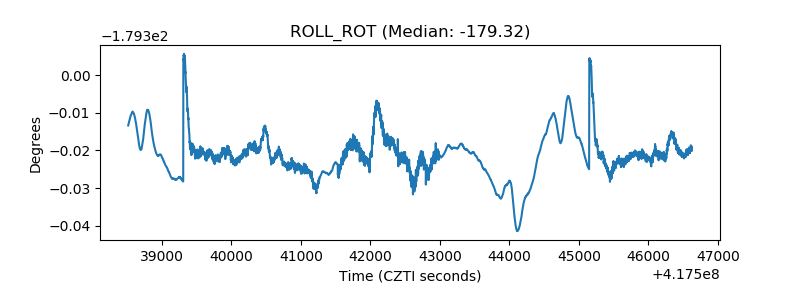 |
| _Roll_DEC | 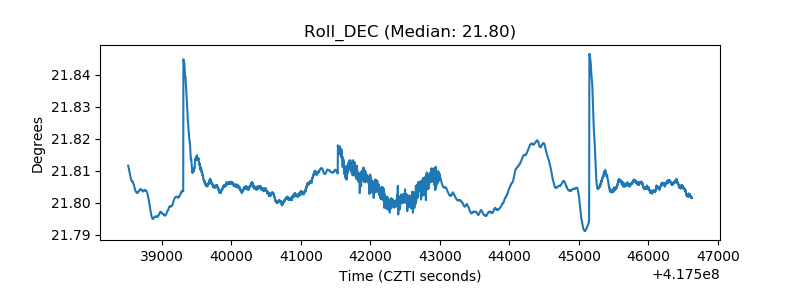 |
| _Roll_RA | 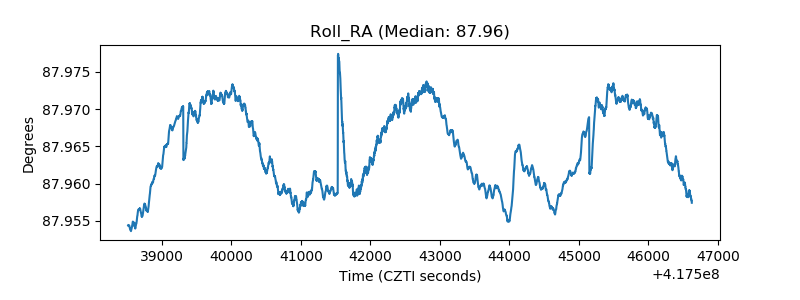 |
| Veto Counter | 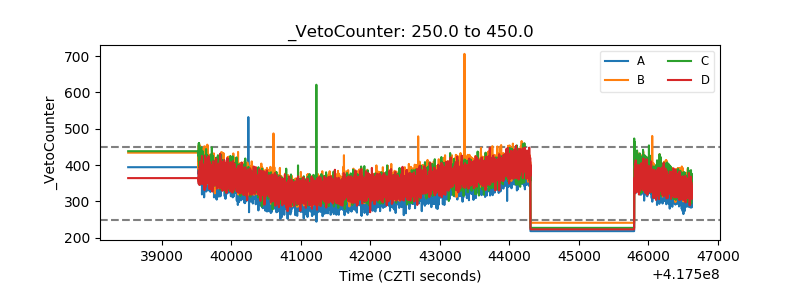 |