| Param | Original file | Final file |
|---|---|---|
| Filename | modeM0/AS1A12_097T02_9000005542_40509cztM0_level2.fits | modeM0/AS1A12_097T02_9000005542_40509cztM0_level2_quad_clean.evt |
| Size (bytes) | 374,503,680 | 91,800,000 |
| Size | 357.2 MB | 87.5 MB |
| Events in quadrant A | 3,120,006 | 636,158 |
| Events in quadrant B | 3,779,301 | 644,680 |
| Events in quadrant C | 3,015,130 | 620,358 |
| Events in quadrant D | 3,495,362 | 471,937 |
| Mode M0 | |||
|---|---|---|---|
| Quadrant | BADHDUFLAG | Total packets | Discarded packets |
| A | 0 | 12921 | 3 |
| B | 0 | 15167 | 2 |
| C | 0 | 12678 | 2 |
| D | 0 | 14252 | 2 |
| Mode SS | |||
|---|---|---|---|
| Quadrant | BADHDUFLAG | Total packets | Discarded packets |
| A | 0 | 120 | 0 |
| B | 0 | 120 | 0 |
| C | 0 | 120 | 0 |
| D | 0 | 120 | 0 |
| Mode M9 | |||
|---|---|---|---|
| Quadrant | BADHDUFLAG | Total packets | Discarded packets |
| A | 0 | 25 | 0 |
| B | 0 | 25 | 0 |
| C | 0 | 25 | 0 |
| D | 0 | 26 | 0 |
| Quadrant | Total seconds | Saturated seconds | Saturation percentage |
|---|---|---|---|
| A | 5805 | 21 | 0.361757% |
| B | 5805 | 133 | 2.291128% |
| C | 5805 | 61 | 1.050818% |
| D | 5805 | 1282 | 22.084410% |
Noise dominated data is calculated using 1-second bins in cleaned event files. If a bin has >2000 counts, and if more than 50% of those come from <1% of pixels, then it is considered to be noise-dominated and hence unusable.
| Quadrant | # 1 sec bins | Bins with >0 counts | Bins with >2000 counts | High rate bins dominated by noise | Noise dominated (total time) | Noise dominated (detector-on time) | Marked lightcurve |
|---|---|---|---|---|---|---|---|
| A | 7118 | 5806 | 8 | 8 | 0.11% | 0.14% | 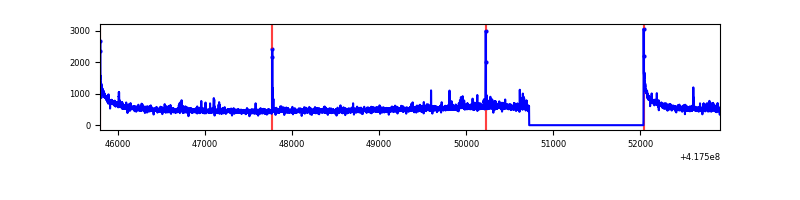 |
| B | 7118 | 5806 | 97 | 97 | 1.36% | 1.67% | 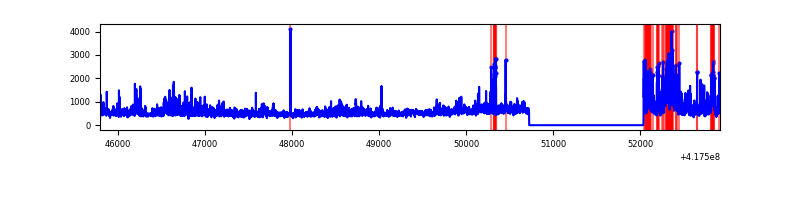 |
| C | 7118 | 5806 | 55 | 55 | 0.77% | 0.95% | 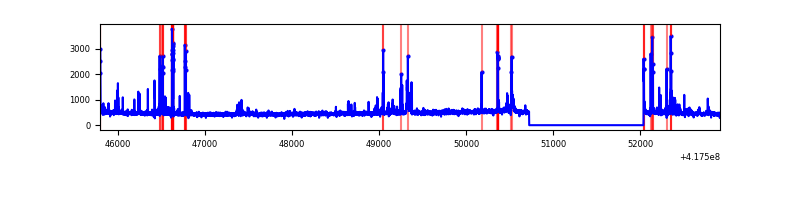 |
| D | 7118 | 5806 | 113 | 113 | 1.59% | 1.95% | 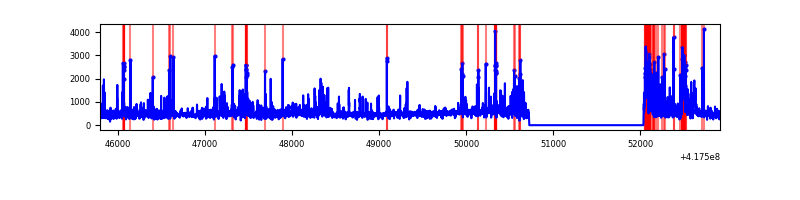 |
Top three noisy pixels from each quadrant. If the there are fewer than three noisy pixels in the level2.evt file, extra rows are filled as -1
| Pixel properties | Quadrant properties | ||||||
|---|---|---|---|---|---|---|---|
| Quadrant | DetID | PixID | Counts | Sigma | Mean | Median | Sigma |
| A | 10 | 83 | 549153 | 4199.24 | 634 | 621 | 130.6 |
| A | 12 | 189 | 65619 | 497.59 | 634 | 621 | 130.6 |
| A | 2 | 79 | 21054 | 156.42 | 634 | 621 | 130.6 |
| B | 3 | 112 | 621058 | 5063.14 | 627 | 610 | 122.5 |
| B | 4 | 171 | 333489 | 2716.45 | 627 | 610 | 122.5 |
| B | 5 | 32 | 134627 | 1093.64 | 627 | 610 | 122.5 |
| C | 14 | 254 | 313280 | 2147.76 | 618 | 622 | 145.6 |
| C | 15 | 214 | 250571 | 1716.99 | 618 | 622 | 145.6 |
| C | 0 | 10 | 18011 | 119.45 | 618 | 622 | 145.6 |
| D | 12 | 227 | 312280 | 2236.02 | 559 | 545 | 139.4 |
| D | 12 | 191 | 309435 | 2215.62 | 559 | 545 | 139.4 |
| D | 2 | 250 | 209443 | 1498.39 | 559 | 545 | 139.4 |
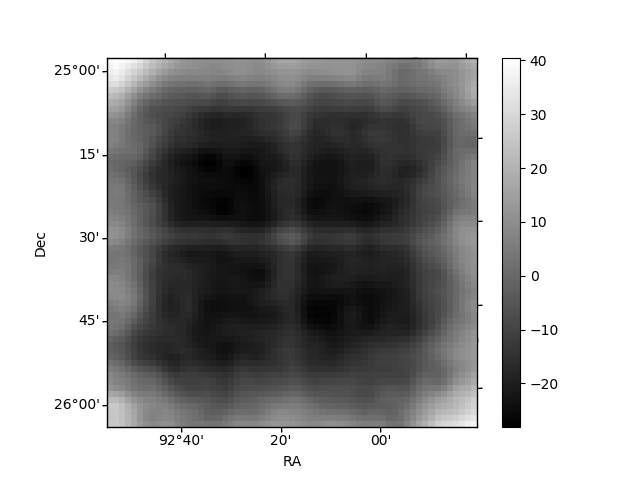
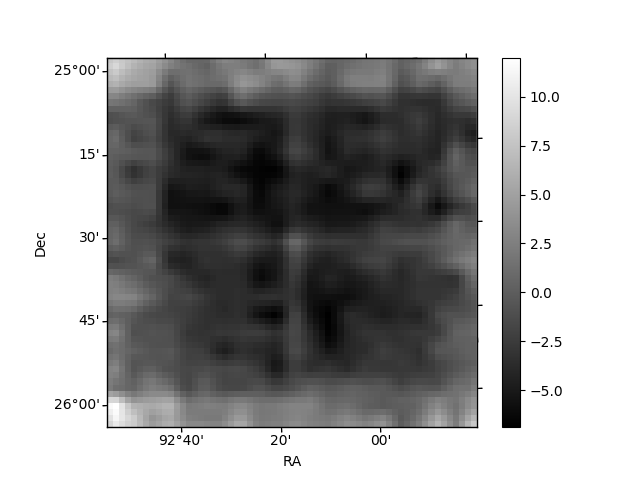
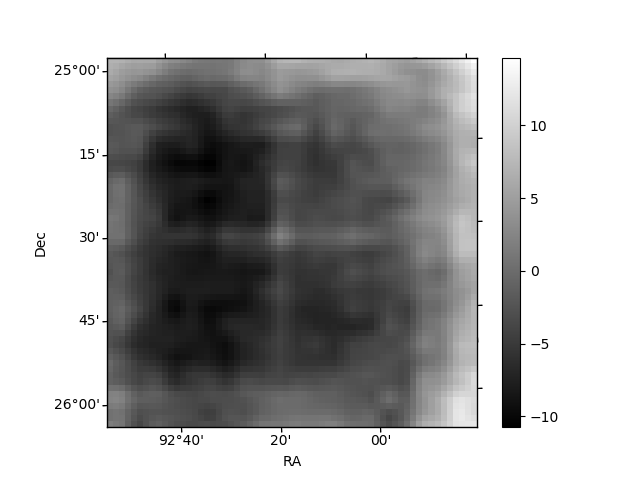
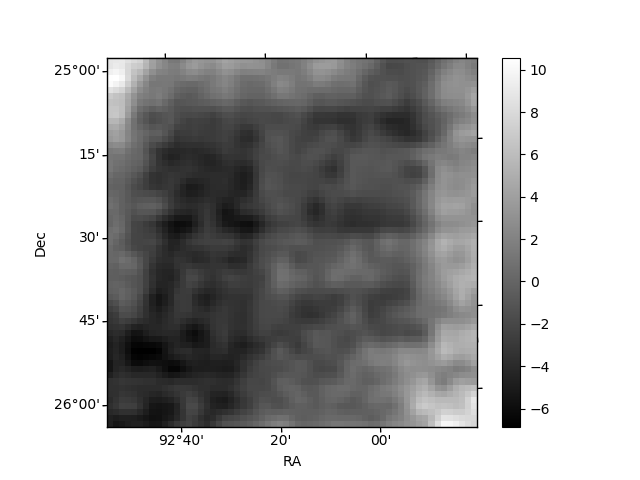
Histogram calculated using DETX and DETY for each event in the final _common_clean file
| Quadrant A | 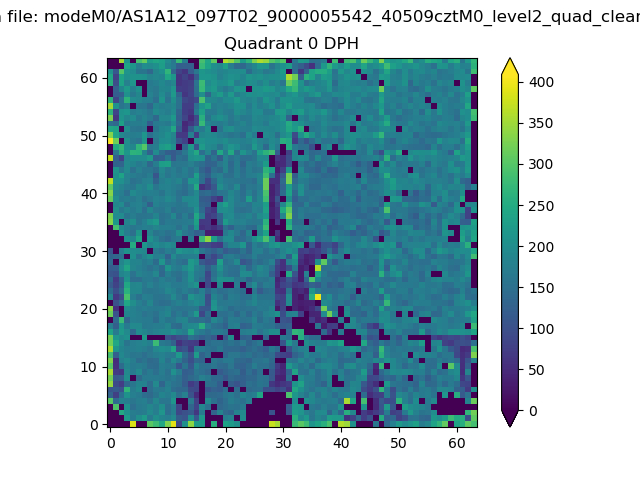 |
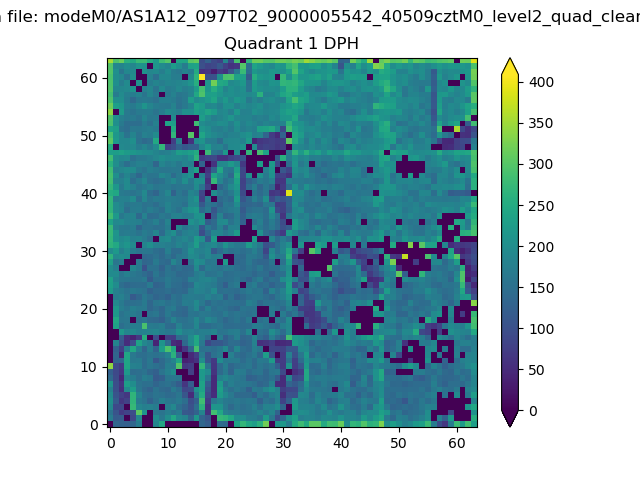 |
Quadrant B |
|---|---|---|---|
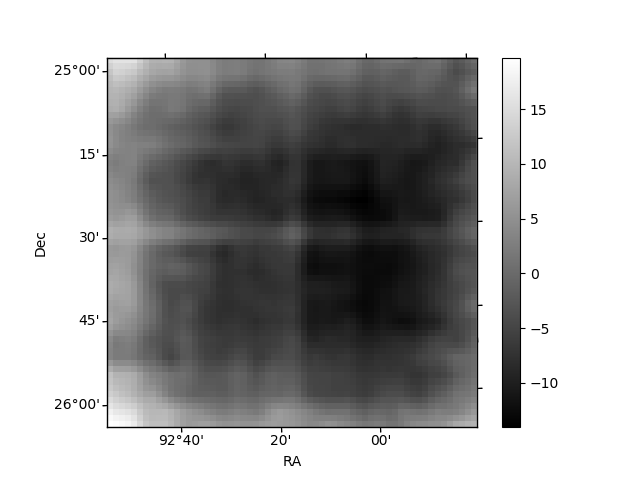
| Quadrant D | 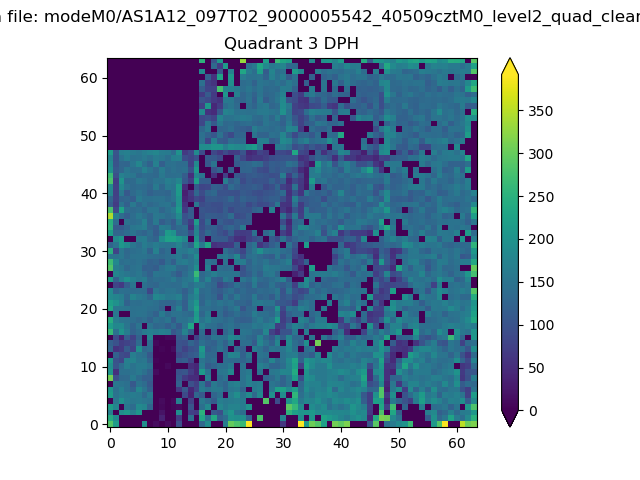 |
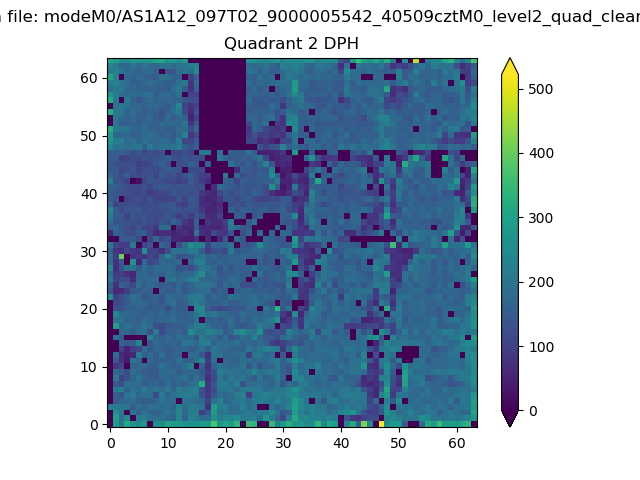 |
Quadrant C |
| Plot type | Count rate plots | Images |
|---|---|---|
| Comparison with Poisson distribution Blue bars denote a histogram of data divided into 1 sec bins. Red curve is a Poisson curve with rate = median count rate of data. |
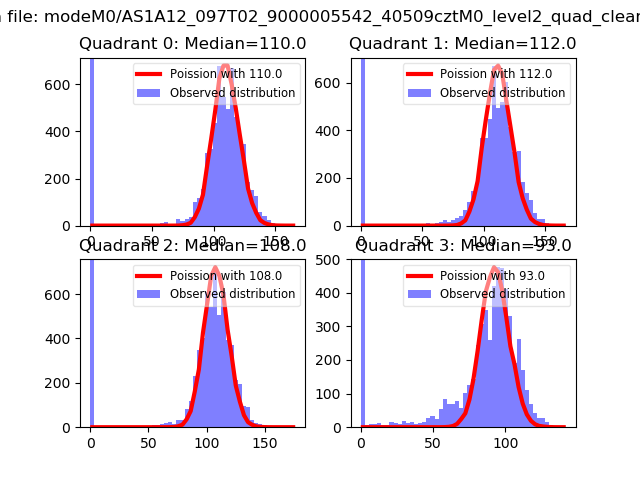 |
 |
| Quadrant-wise count rates Data is divided into 100 sec bins |
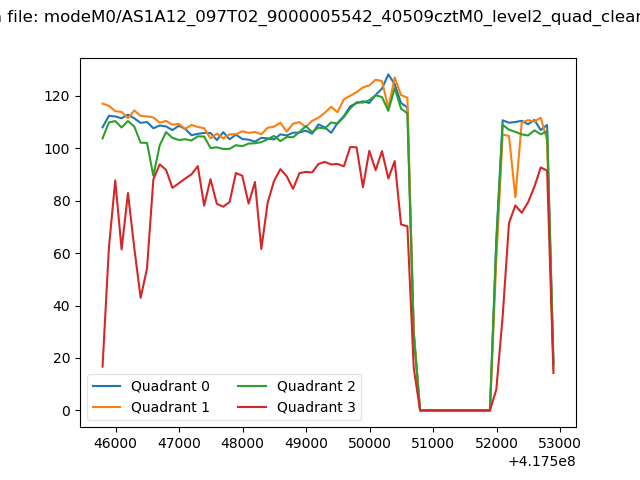 |
|
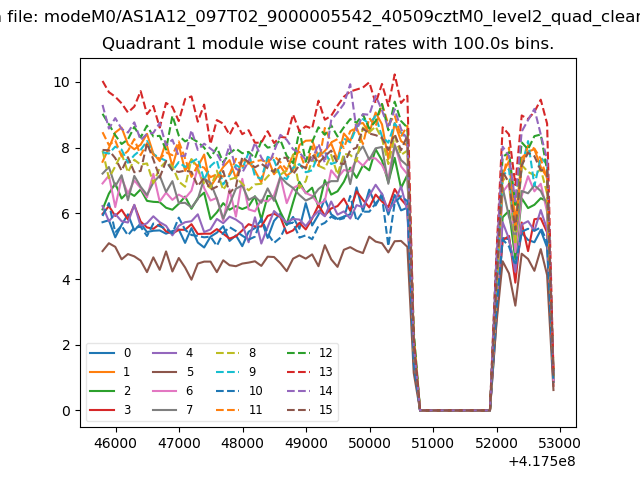
| Module-wise count rates for Quadrant A Data is divided into 100 sec bins |
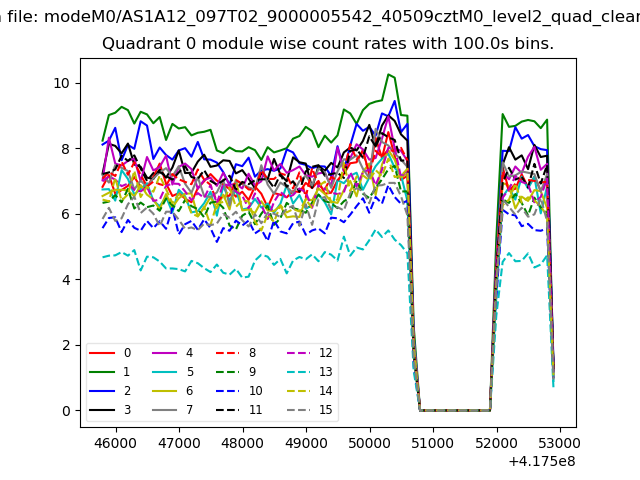 |
 |
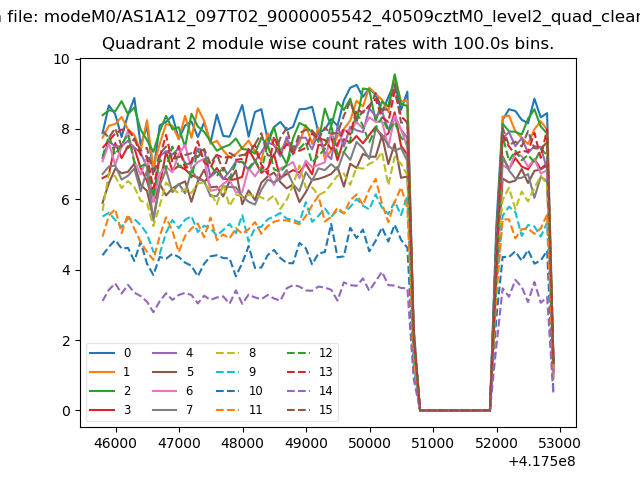
| Module-wise count rates for Quadrant B Data is divided into 100 sec bins |
 |
 |
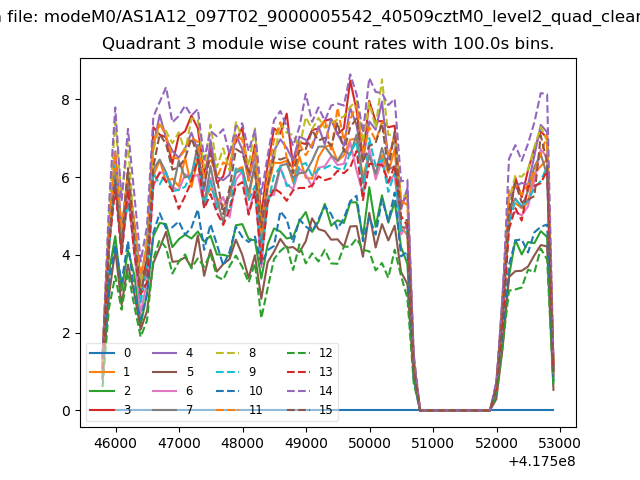
| Module-wise count rates for Quadrant C Data is divided into 100 sec bins |
 |
 |
| Module-wise count rates for Quadrant D Data is divided into 100 sec bins |
 |
 |
| Parameter | Plot |
|---|---|
| CZT HV Monitor | 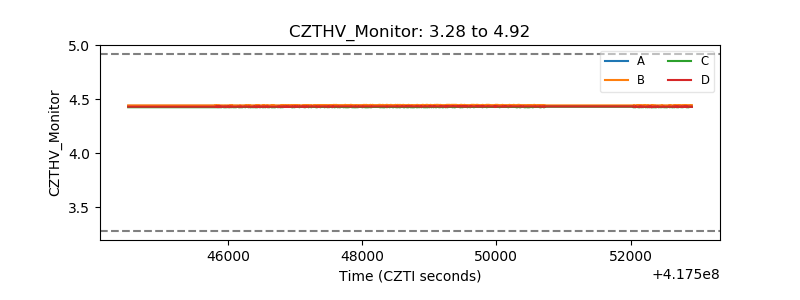 |
| D_VDD | 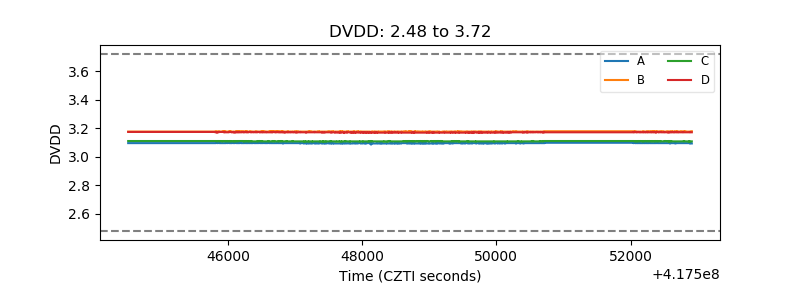 |
| Temperature 1 | 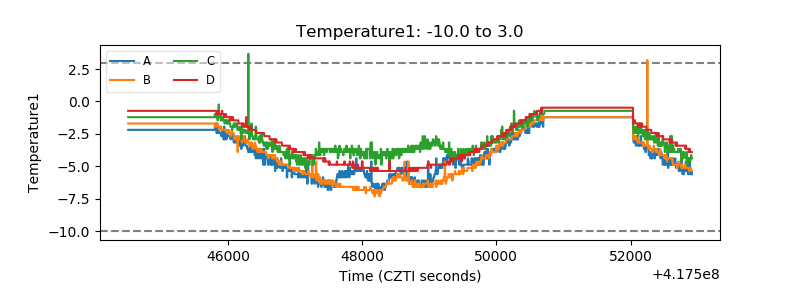 |
| Veto HV Monitor | 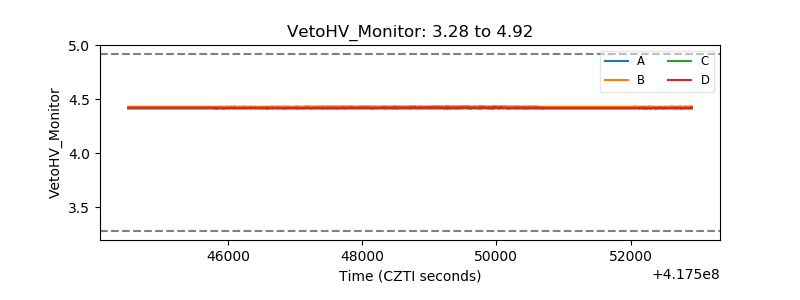 |
| Veto LLD | 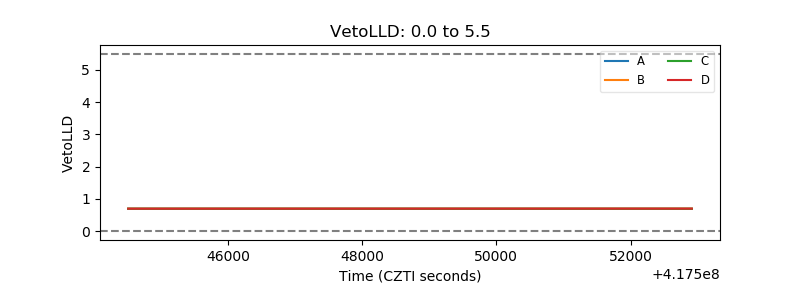 |
| Alpha Counter | 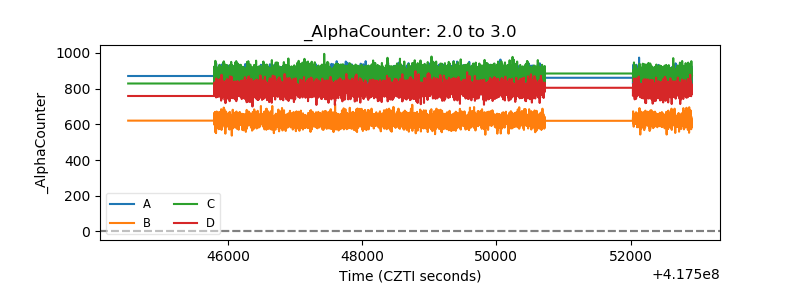 |
| _CPM_Rate | 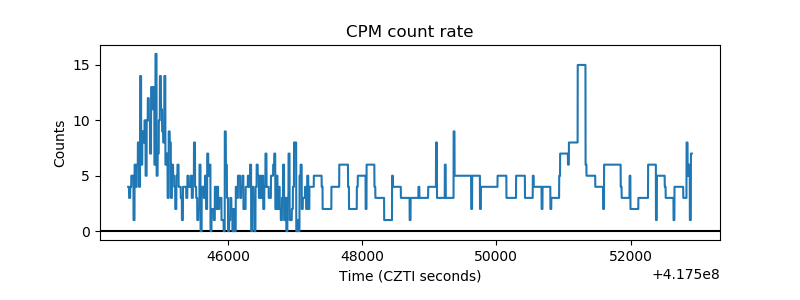 |
| CZT Counter | 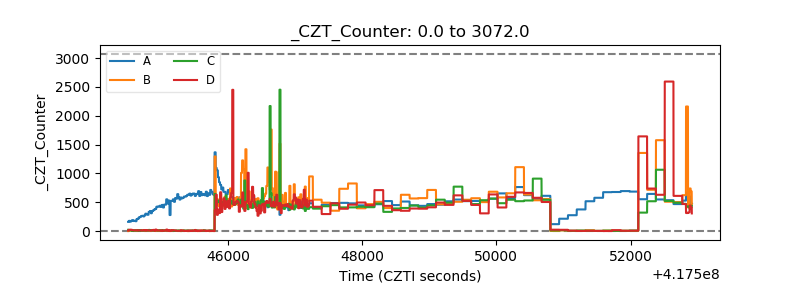 |
| +2.5 Volts monitor | 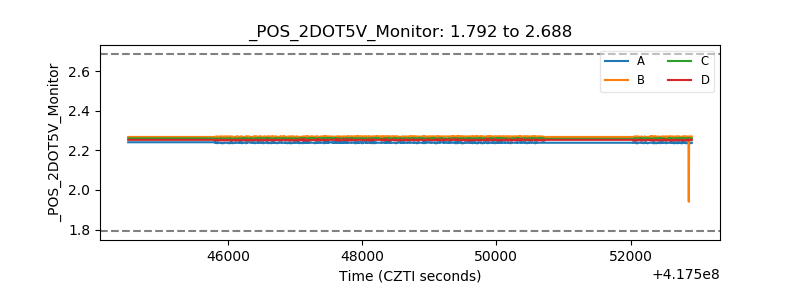 |
| +5 Volts monitor | 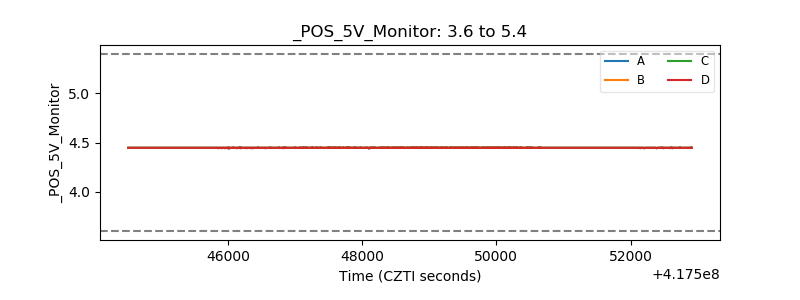 |
| _ROLL_ROT | 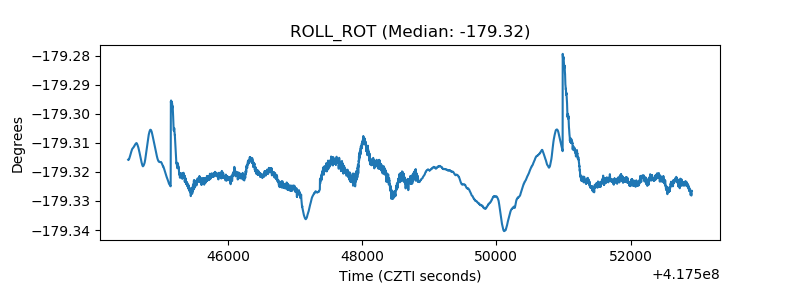 |
| _Roll_DEC | 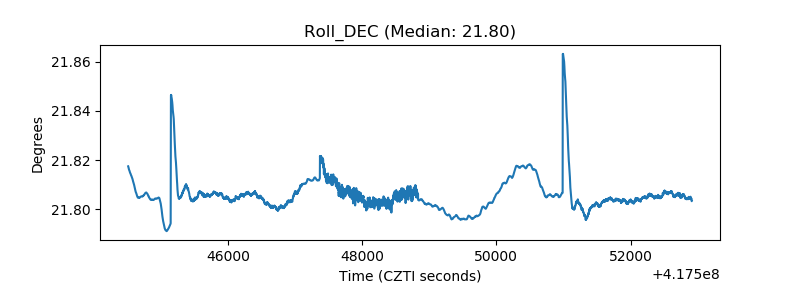 |
| _Roll_RA | 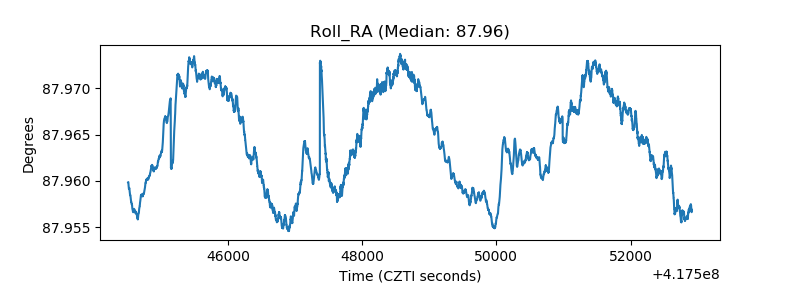 |
| Veto Counter | 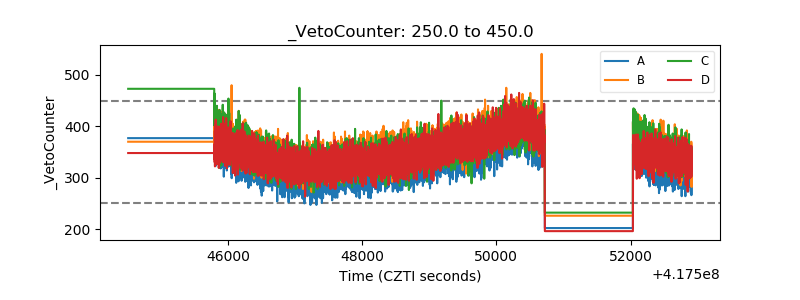 |