| Param | Original file | Final file |
|---|---|---|
| Filename | modeM0/AS1A12_097T02_9000005542_40512cztM0_level2.fits | modeM0/AS1A12_097T02_9000005542_40512cztM0_level2_quad_clean.evt |
| Size (bytes) | 879,960,960 | 213,655,680 |
| Size | 839.2 MB | 203.8 MB |
| Events in quadrant A | 7,499,115 | 1,464,457 |
| Events in quadrant B | 8,299,280 | 1,493,943 |
| Events in quadrant C | 6,702,279 | 1,445,649 |
| Events in quadrant D | 9,009,708 | 1,117,650 |
| Mode M0 | |||
|---|---|---|---|
| Quadrant | BADHDUFLAG | Total packets | Discarded packets |
| A | 0 | 30738 | 4 |
| B | 0 | 33977 | 3 |
| C | 0 | 28545 | 3 |
| D | 0 | 36534 | 3 |
| Mode SS | |||
|---|---|---|---|
| Quadrant | BADHDUFLAG | Total packets | Discarded packets |
| A | 0 | 282 | 0 |
| B | 0 | 282 | 0 |
| C | 0 | 282 | 0 |
| D | 0 | 282 | 0 |
| Mode M9 | |||
|---|---|---|---|
| Quadrant | BADHDUFLAG | Total packets | Discarded packets |
| A | 0 | 38 | 0 |
| B | 0 | 38 | 0 |
| C | 0 | 38 | 0 |
| D | 0 | 38 | 0 |
| Quadrant | Total seconds | Saturated seconds | Saturation percentage |
|---|---|---|---|
| A | 13700 | 54 | 0.394161% |
| B | 13700 | 238 | 1.737226% |
| C | 13700 | 29 | 0.211679% |
| D | 13700 | 2226 | 16.248175% |
Noise dominated data is calculated using 1-second bins in cleaned event files. If a bin has >2000 counts, and if more than 50% of those come from <1% of pixels, then it is considered to be noise-dominated and hence unusable.
| Quadrant | # 1 sec bins | Bins with >0 counts | Bins with >2000 counts | High rate bins dominated by noise | Noise dominated (total time) | Noise dominated (detector-on time) | Marked lightcurve |
|---|---|---|---|---|---|---|---|
| A | 17638 | 13703 | 38 | 38 | 0.22% | 0.28% | 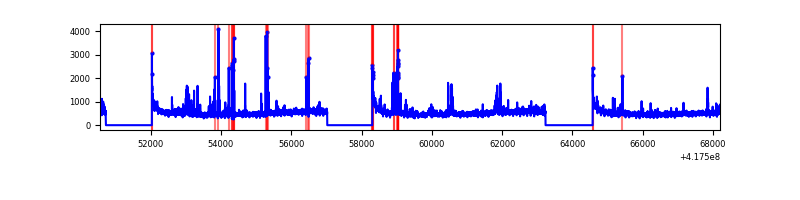 |
| B | 17638 | 13703 | 143 | 143 | 0.81% | 1.04% | 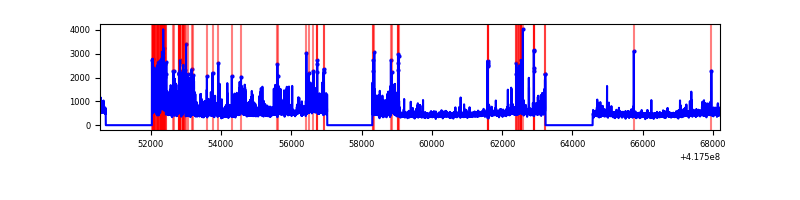 |
| C | 17638 | 13703 | 22 | 22 | 0.12% | 0.16% | 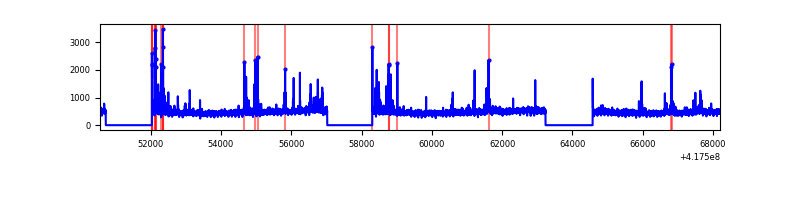 |
| D | 17638 | 13702 | 676 | 676 | 3.83% | 4.93% | 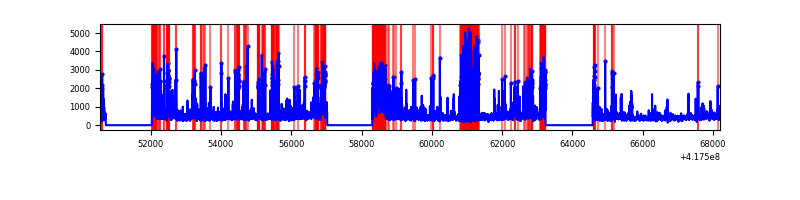 |
Top three noisy pixels from each quadrant. If the there are fewer than three noisy pixels in the level2.evt file, extra rows are filled as -1
| Pixel properties | Quadrant properties | ||||||
|---|---|---|---|---|---|---|---|
| Quadrant | DetID | PixID | Counts | Sigma | Mean | Median | Sigma |
| A | 10 | 83 | 1091495 | 3538.31 | 1505 | 1472 | 308.1 |
| A | 12 | 189 | 389284 | 1258.87 | 1505 | 1472 | 308.1 |
| A | 6 | 10 | 61215 | 193.93 | 1505 | 1472 | 308.1 |
| B | 4 | 171 | 1005216 | 3454.21 | 1494 | 1454 | 290.6 |
| B | 3 | 112 | 829336 | 2848.96 | 1494 | 1454 | 290.6 |
| B | 0 | 183 | 160173 | 546.19 | 1494 | 1454 | 290.6 |
| C | 15 | 214 | 581930 | 1685.16 | 1471 | 1483 | 344.4 |
| C | 14 | 254 | 240974 | 695.29 | 1471 | 1483 | 344.4 |
| C | 9 | 187 | 69445 | 197.31 | 1471 | 1483 | 344.4 |
| D | 12 | 227 | 1624807 | 4831.35 | 1344 | 1306 | 336.0 |
| D | 2 | 250 | 1171342 | 3481.89 | 1344 | 1306 | 336.0 |
| D | 12 | 191 | 422985 | 1254.87 | 1344 | 1306 | 336.0 |
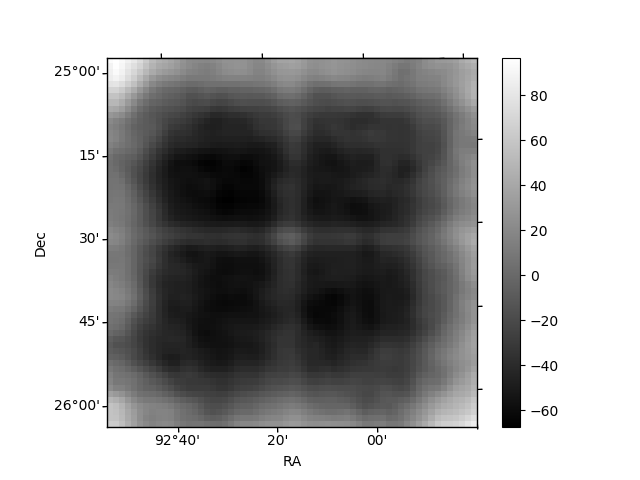
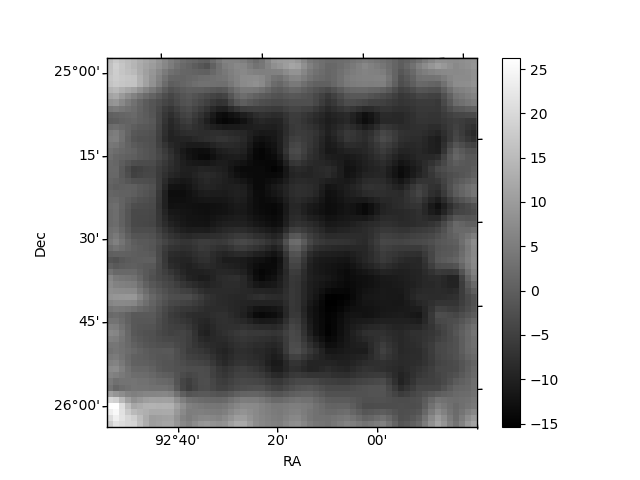
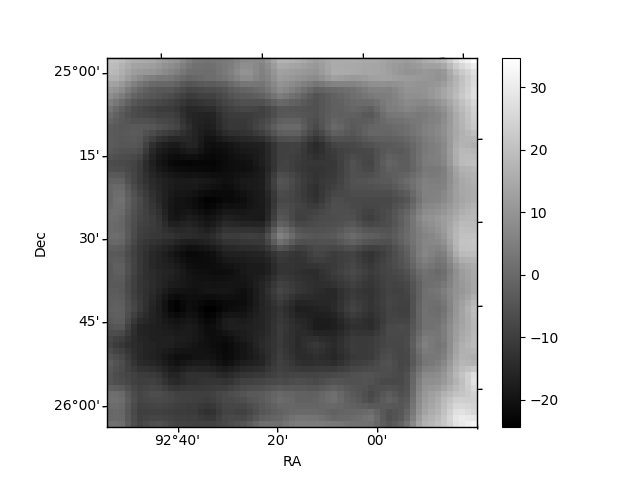
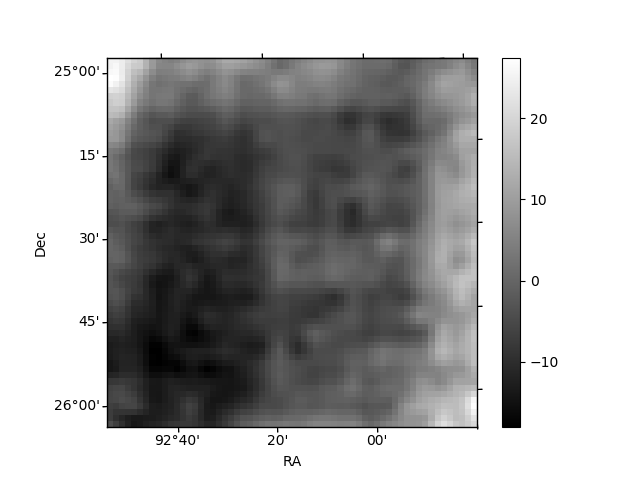
Histogram calculated using DETX and DETY for each event in the final _common_clean file
| Quadrant A | 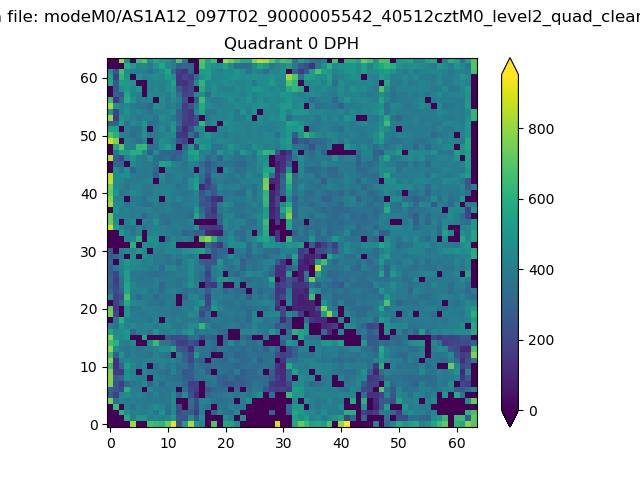 |
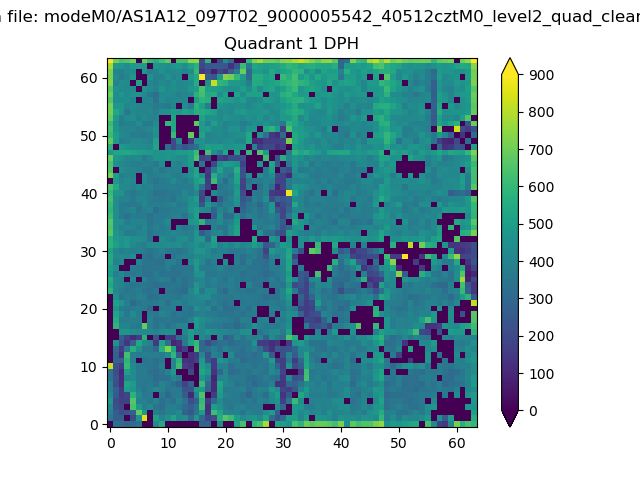 |
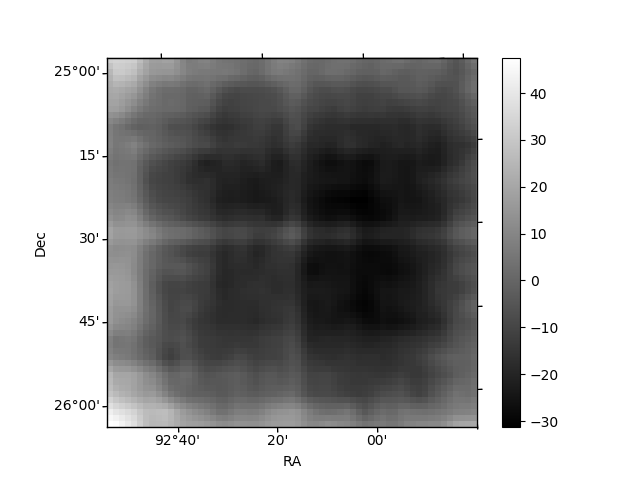
Quadrant B |
|---|---|---|---|
| Quadrant D | 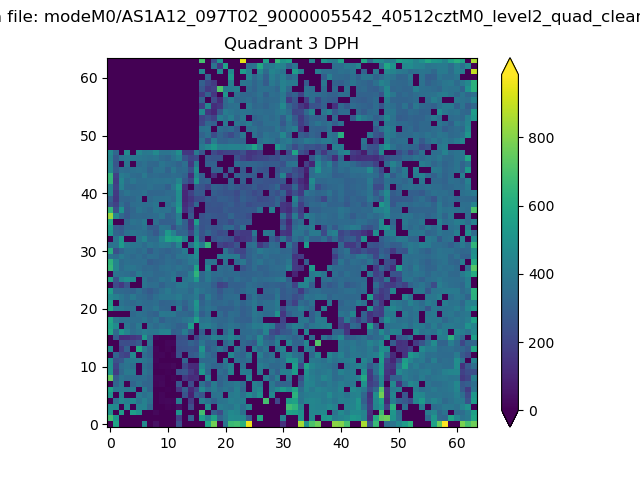 |
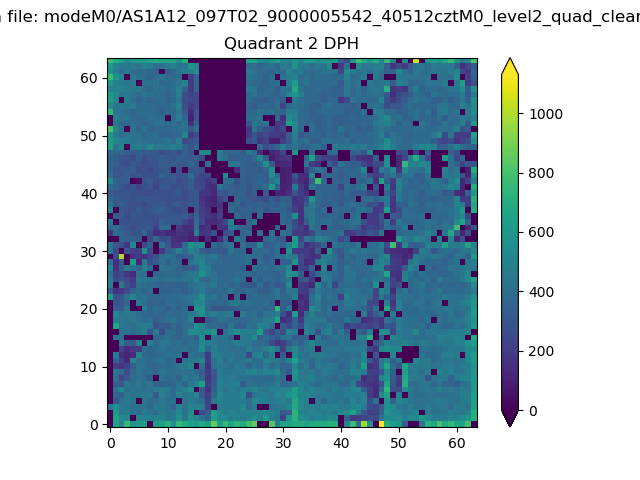 |
Quadrant C |
| Plot type | Count rate plots | Images |
|---|---|---|
| Comparison with Poisson distribution Blue bars denote a histogram of data divided into 1 sec bins. Red curve is a Poisson curve with rate = median count rate of data. |
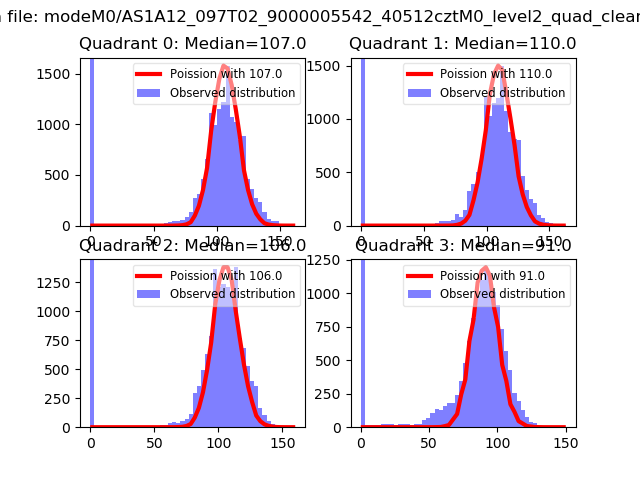 |
 |
| Quadrant-wise count rates Data is divided into 100 sec bins |
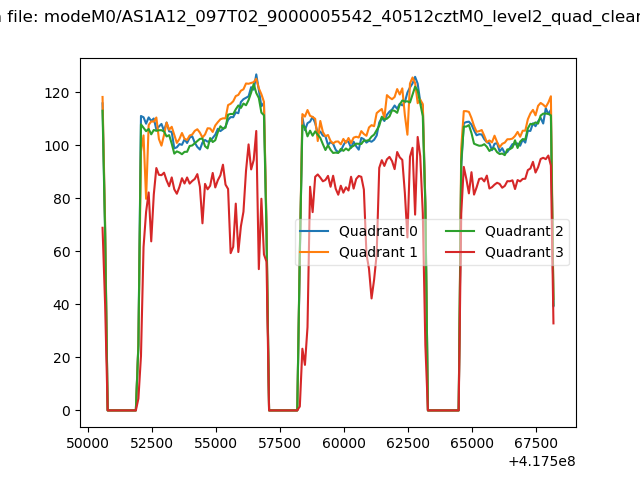 |
|
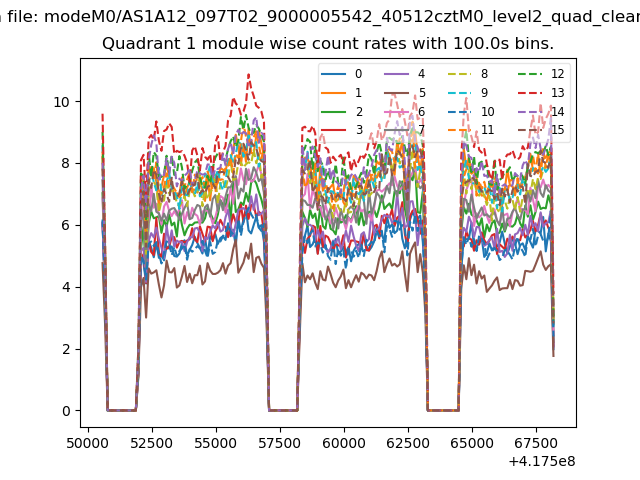
| Module-wise count rates for Quadrant A Data is divided into 100 sec bins |
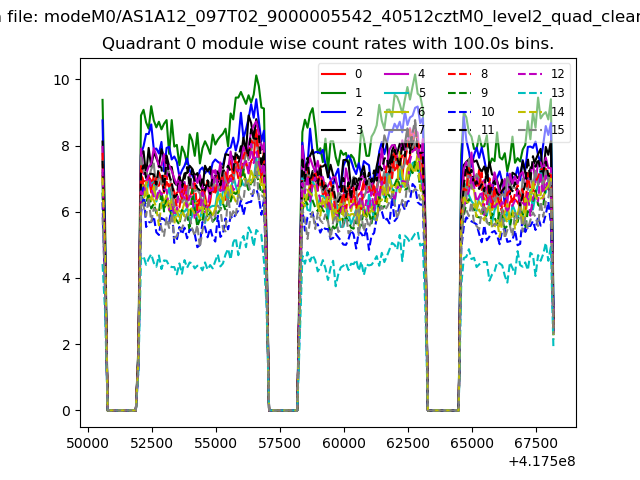 |
 |
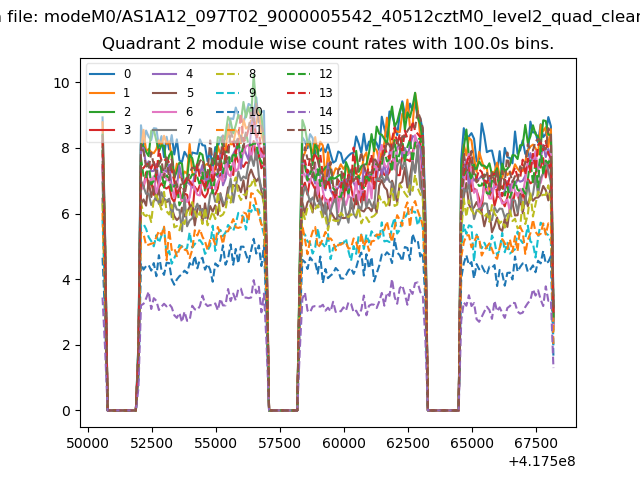
| Module-wise count rates for Quadrant B Data is divided into 100 sec bins |
 |
 |
| Module-wise count rates for Quadrant C Data is divided into 100 sec bins |
 |
 |
| Module-wise count rates for Quadrant D Data is divided into 100 sec bins |
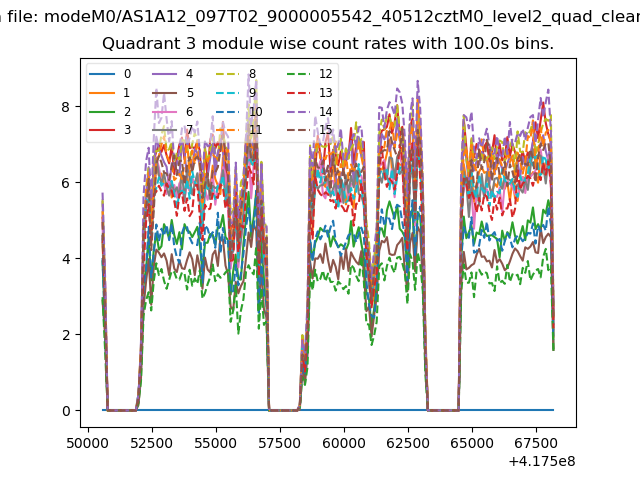 |
 |
| Parameter | Plot |
|---|---|
| CZT HV Monitor | 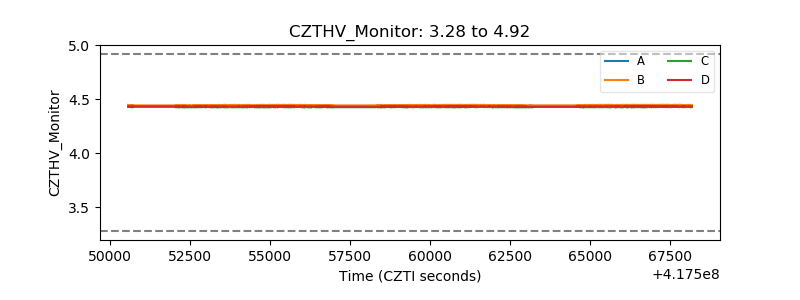 |
| D_VDD | 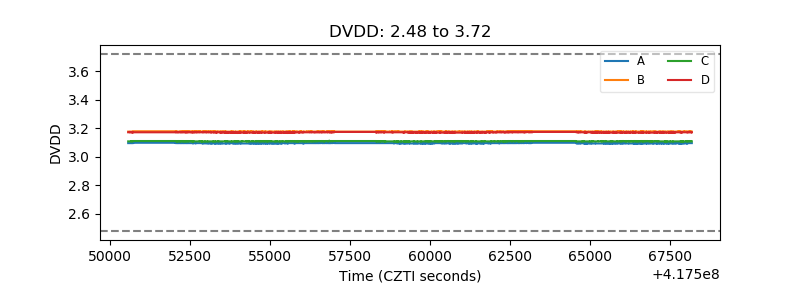 |
| Temperature 1 | 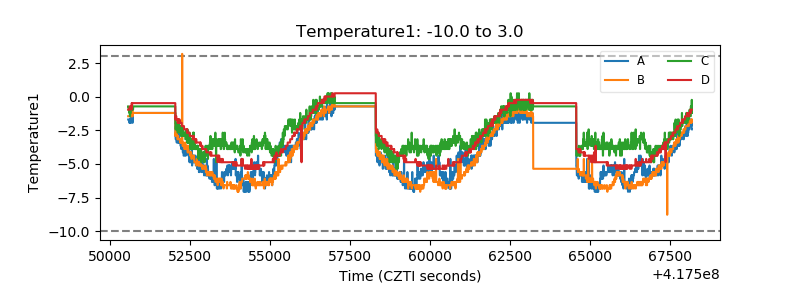 |
| Veto HV Monitor | 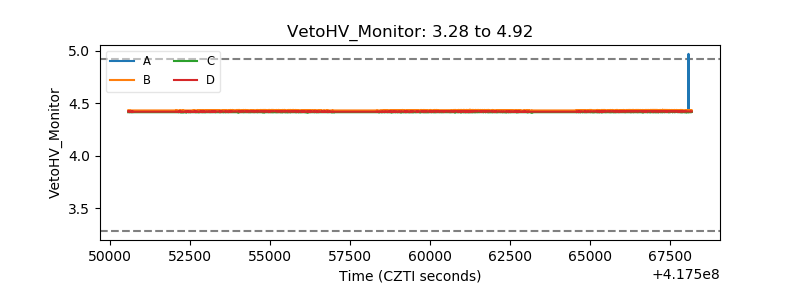 |
| Veto LLD | 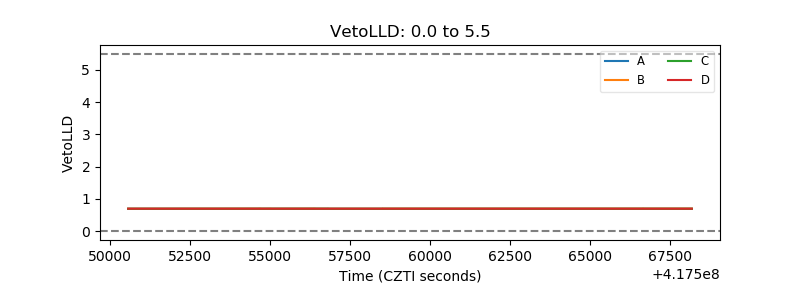 |
| Alpha Counter | 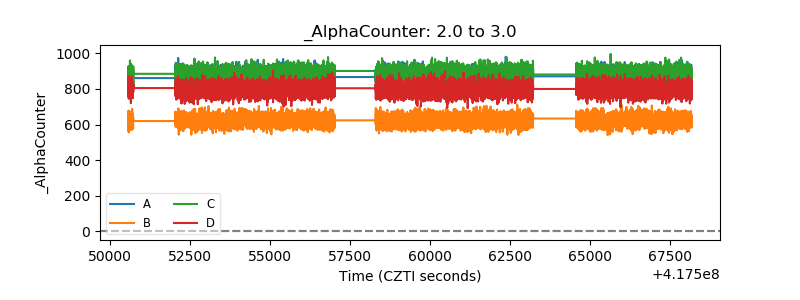 |
| _CPM_Rate | 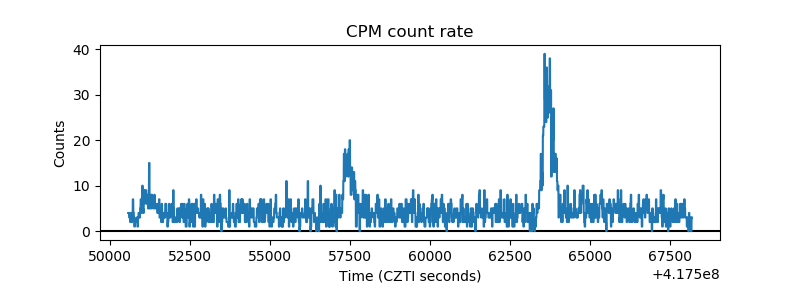 |
| CZT Counter | 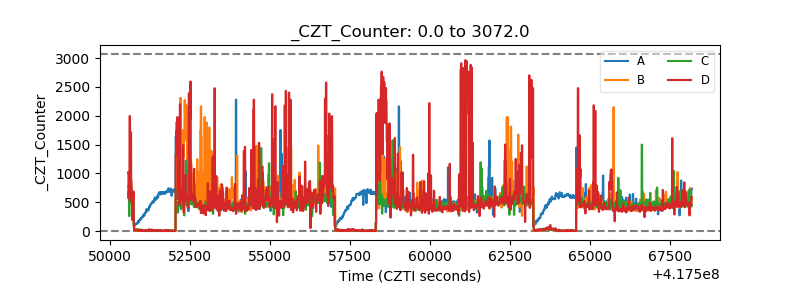 |
| +2.5 Volts monitor | 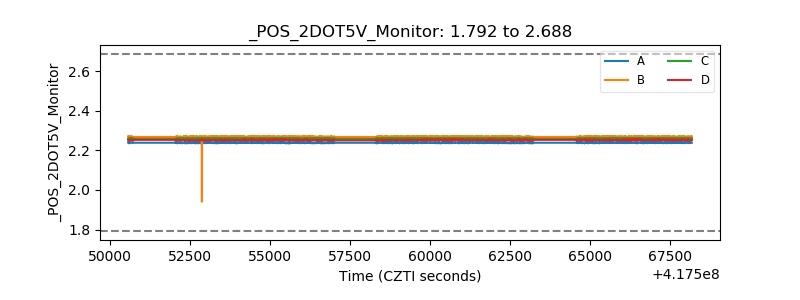 |
| +5 Volts monitor | 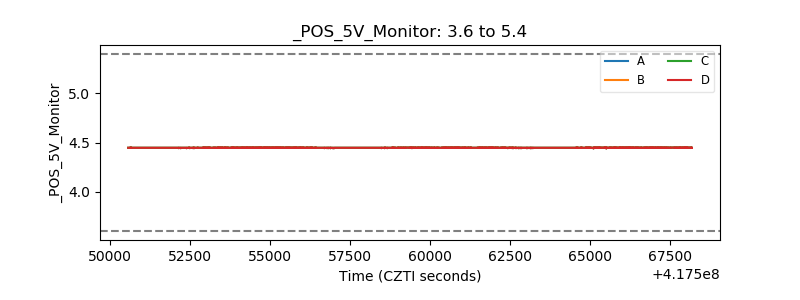 |
| _ROLL_ROT | 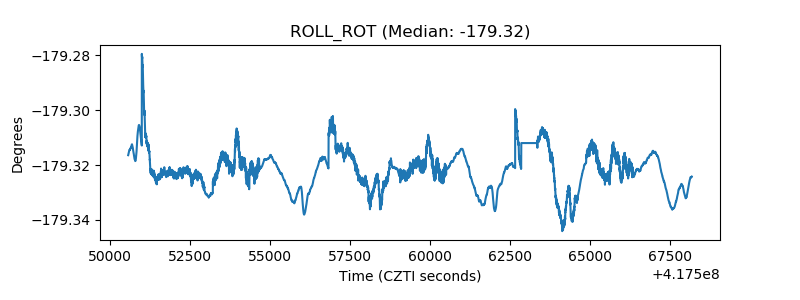 |
| _Roll_DEC | 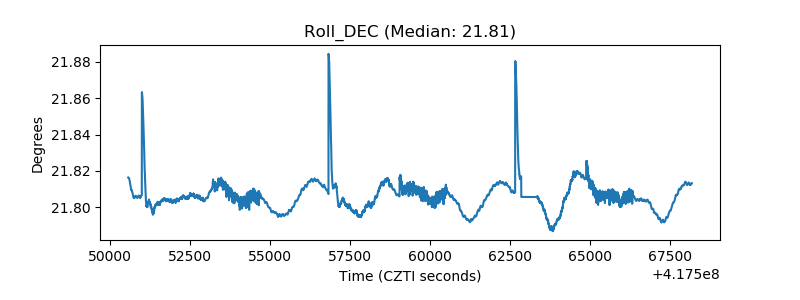 |
| _Roll_RA | 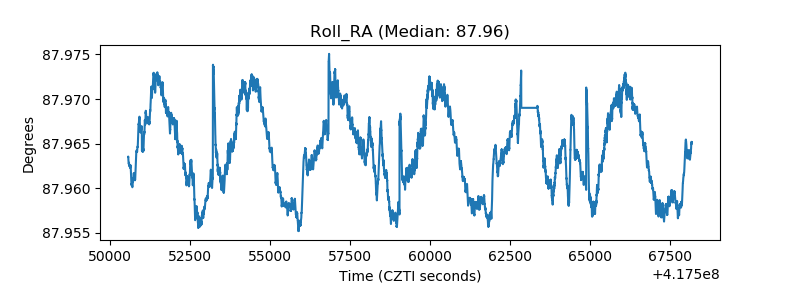 |
| Veto Counter | 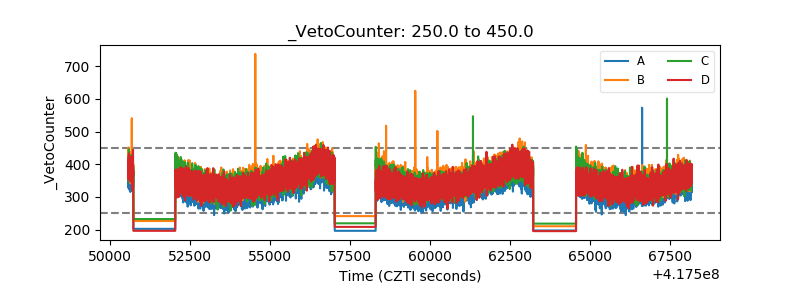 |