| Param | Original file | Final file |
|---|---|---|
| Filename | modeM0/AS1T05_070T01_9000005544_40516cztM0_level2.fits | modeM0/AS1T05_070T01_9000005544_40516cztM0_level2_quad_clean.evt |
| Size (bytes) | 230,852,160 | 57,683,520 |
| Size | 220.2 MB | 55.0 MB |
| Events in quadrant A | 1,903,201 | 404,246 |
| Events in quadrant B | 1,843,670 | 415,024 |
| Events in quadrant C | 1,816,505 | 386,835 |
| Events in quadrant D | 2,712,336 | 297,271 |
| Mode M0 | |||
|---|---|---|---|
| Quadrant | BADHDUFLAG | Total packets | Discarded packets |
| A | 0 | 7616 | 2 |
| B | 0 | 7698 | 1 |
| C | 0 | 7486 | 1 |
| D | 0 | 10450 | 1 |
| Mode M9 | |||
|---|---|---|---|
| Quadrant | BADHDUFLAG | Total packets | Discarded packets |
| A | 0 | 19 | 0 |
| B | 0 | 19 | 0 |
| C | 0 | 19 | 0 |
| D | 0 | 19 | 0 |
| Mode SS | |||
|---|---|---|---|
| Quadrant | BADHDUFLAG | Total packets | Discarded packets |
| A | 0 | 68 | 0 |
| B | 0 | 68 | 0 |
| C | 0 | 68 | 0 |
| D | 0 | 68 | 0 |
| Quadrant | Total seconds | Saturated seconds | Saturation percentage |
|---|---|---|---|
| A | 3439 | 8 | 0.232626% |
| B | 3439 | 13 | 0.378017% |
| C | 3439 | 43 | 1.250363% |
| D | 3439 | 705 | 20.500145% |
Noise dominated data is calculated using 1-second bins in cleaned event files. If a bin has >2000 counts, and if more than 50% of those come from <1% of pixels, then it is considered to be noise-dominated and hence unusable.
| Quadrant | # 1 sec bins | Bins with >0 counts | Bins with >2000 counts | High rate bins dominated by noise | Noise dominated (total time) | Noise dominated (detector-on time) | Marked lightcurve |
|---|---|---|---|---|---|---|---|
| A | 5262 | 3440 | 3 | 3 | 0.06% | 0.09% | 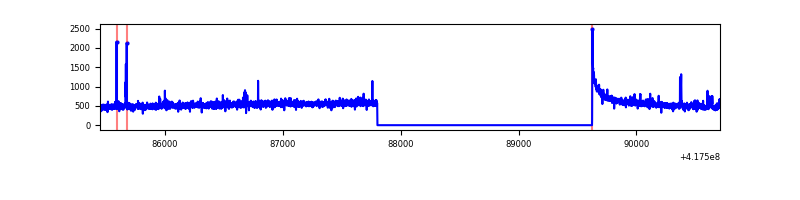 |
| B | 5262 | 3440 | 4 | 4 | 0.08% | 0.12% | 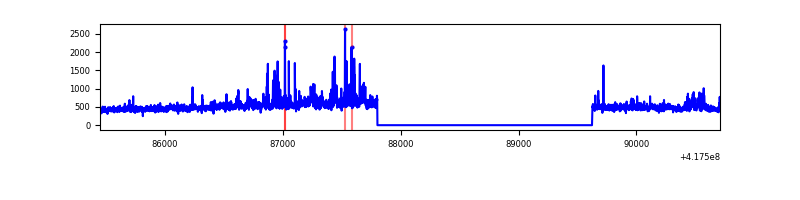 |
| C | 5262 | 3440 | 33 | 33 | 0.63% | 0.96% | 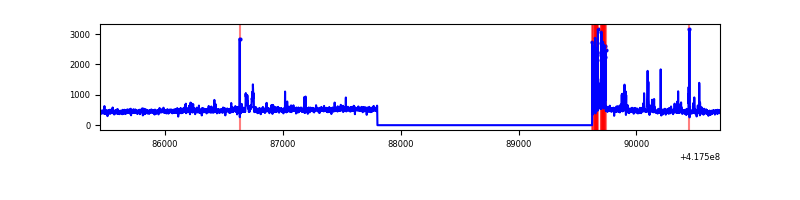 |
| D | 5262 | 3440 | 303 | 303 | 5.76% | 8.81% | 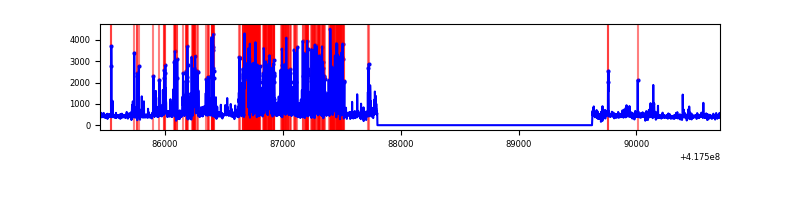 |
Top three noisy pixels from each quadrant. If the there are fewer than three noisy pixels in the level2.evt file, extra rows are filled as -1
| Pixel properties | Quadrant properties | ||||||
|---|---|---|---|---|---|---|---|
| Quadrant | DetID | PixID | Counts | Sigma | Mean | Median | Sigma |
| A | 10 | 83 | 321962 | 3925.93 | 391 | 384 | 81.9 |
| A | 12 | 189 | 45362 | 549.11 | 391 | 384 | 81.9 |
| A | 2 | 79 | 11797 | 139.33 | 391 | 384 | 81.9 |
| B | 0 | 183 | 117196 | 1536.45 | 389 | 378 | 76.0 |
| B | 3 | 112 | 90198 | 1181.36 | 389 | 378 | 76.0 |
| B | 0 | 230 | 41090 | 535.46 | 389 | 378 | 76.0 |
| C | 15 | 214 | 151192 | 1706.73 | 377 | 379 | 88.4 |
| C | 14 | 254 | 148858 | 1680.32 | 377 | 379 | 88.4 |
| C | 10 | 20 | 31244 | 349.3 | 377 | 379 | 88.4 |
| D | 12 | 227 | 947059 | 10932.39 | 343 | 333 | 86.6 |
| D | 2 | 250 | 177553 | 2046.46 | 343 | 333 | 86.6 |
| D | 12 | 191 | 97946 | 1127.19 | 343 | 333 | 86.6 |
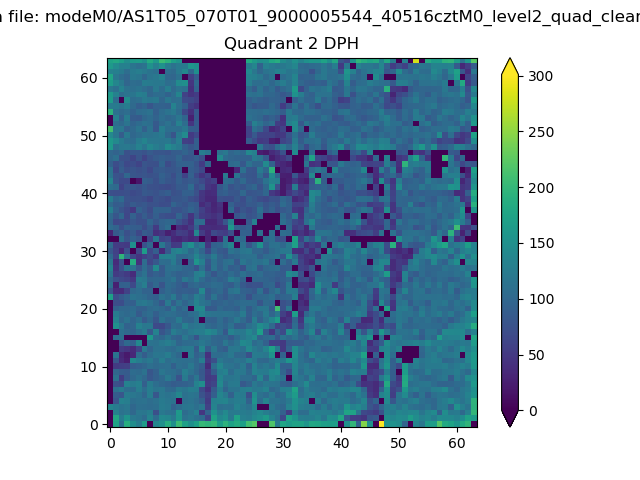
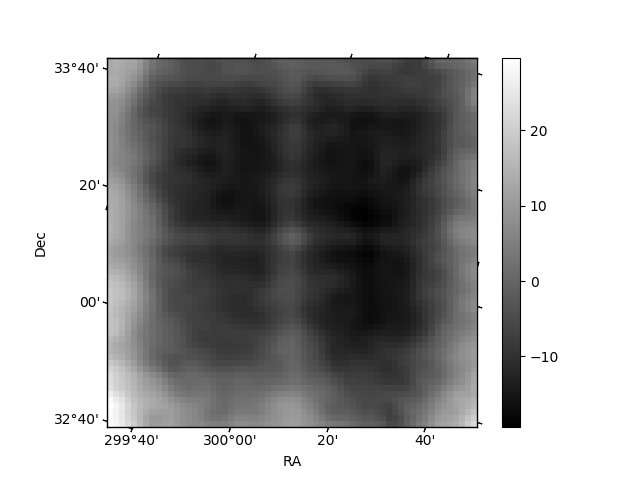
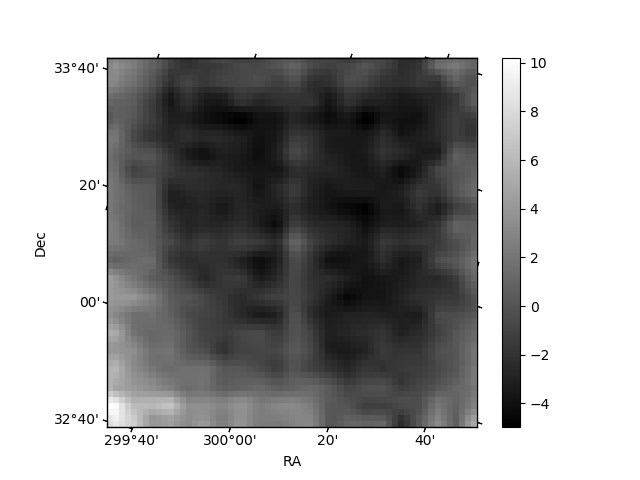
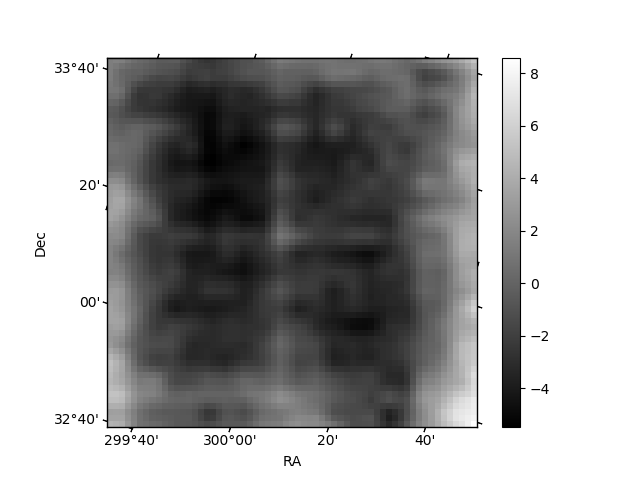
Histogram calculated using DETX and DETY for each event in the final _common_clean file
| Quadrant A | 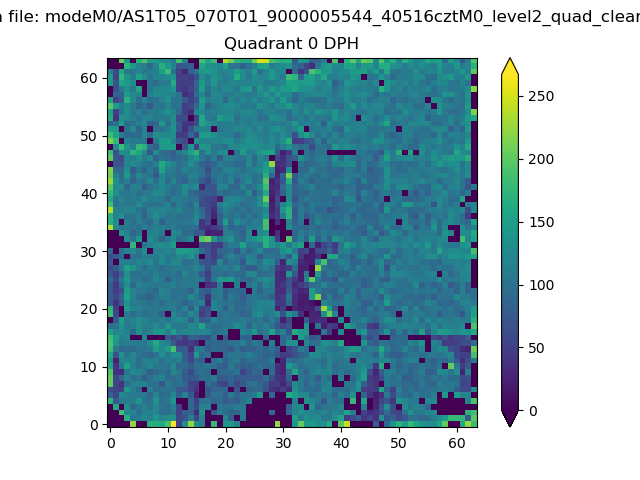 |
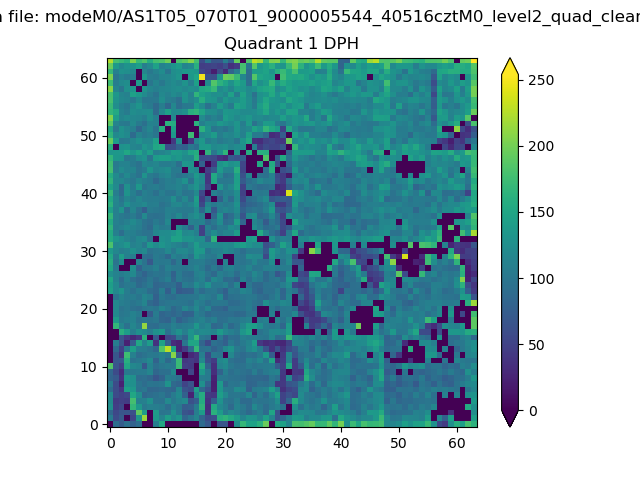 |
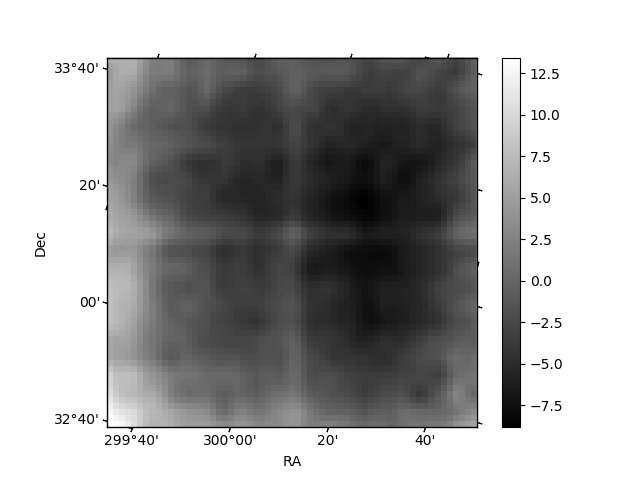
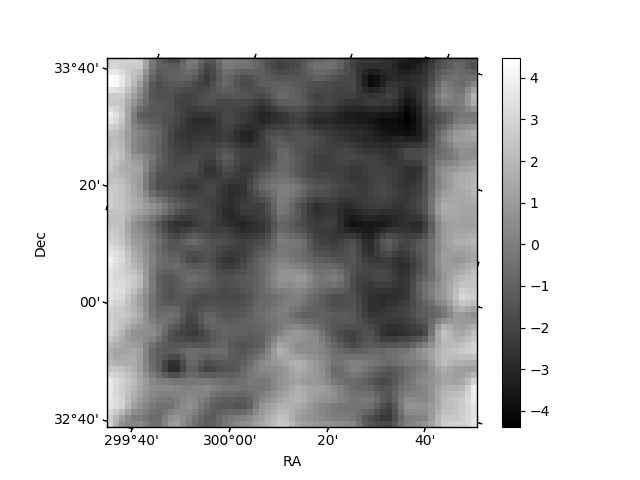
Quadrant B |
|---|---|---|---|
| Quadrant D | 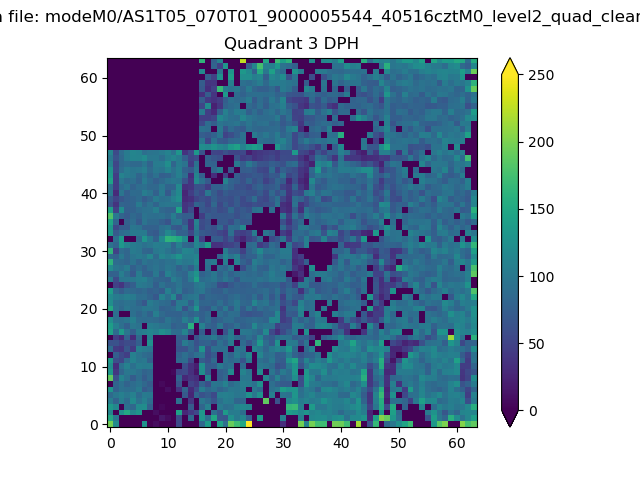 |
 |
Quadrant C |
| Plot type | Count rate plots | Images |
|---|---|---|
| Comparison with Poisson distribution Blue bars denote a histogram of data divided into 1 sec bins. Red curve is a Poisson curve with rate = median count rate of data. |
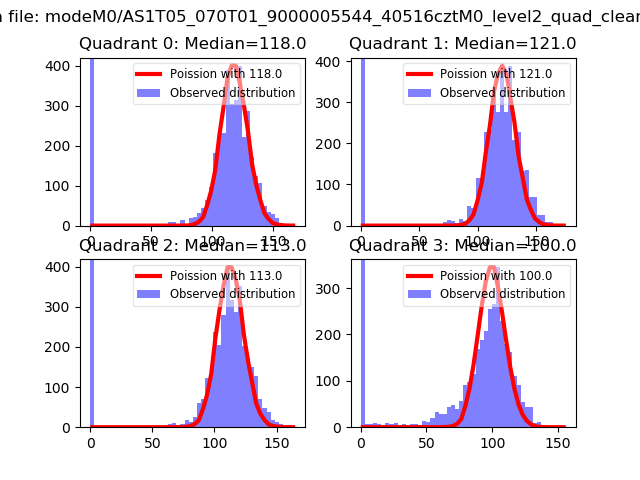 |
 |
| Quadrant-wise count rates Data is divided into 100 sec bins |
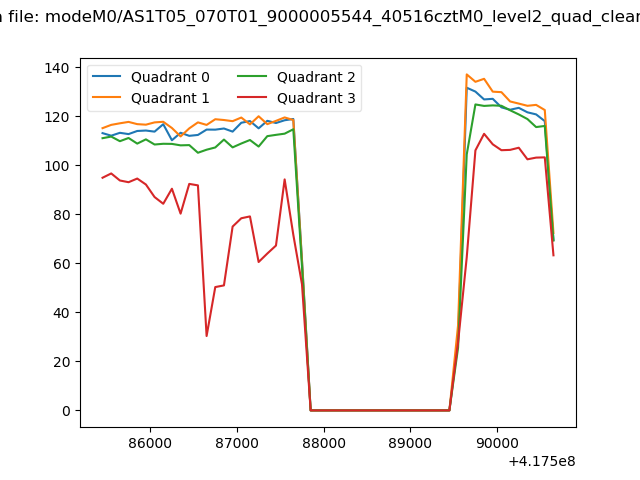 |
|
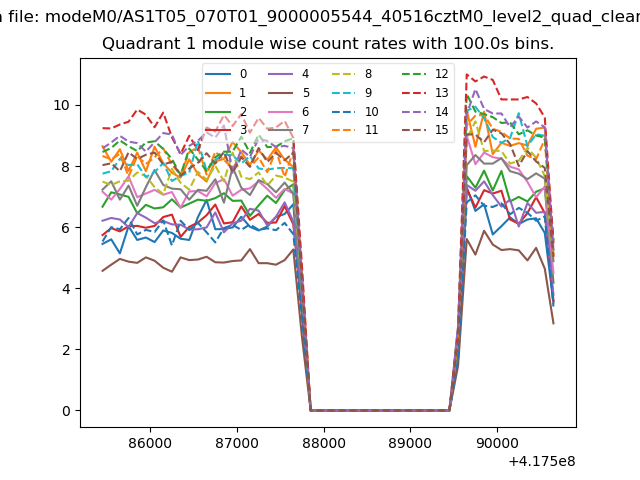
| Module-wise count rates for Quadrant A Data is divided into 100 sec bins |
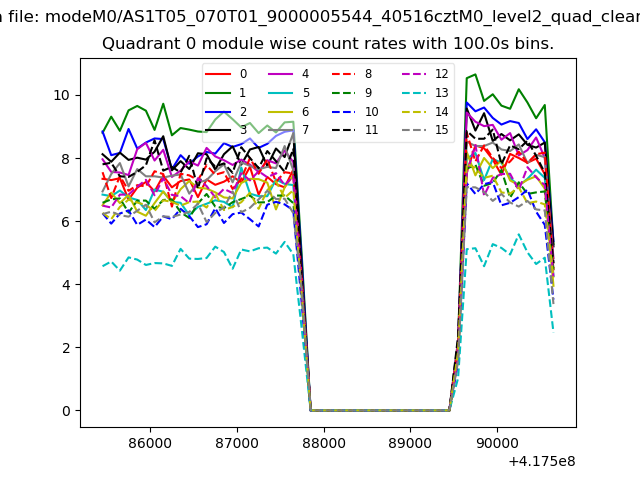 |
 |
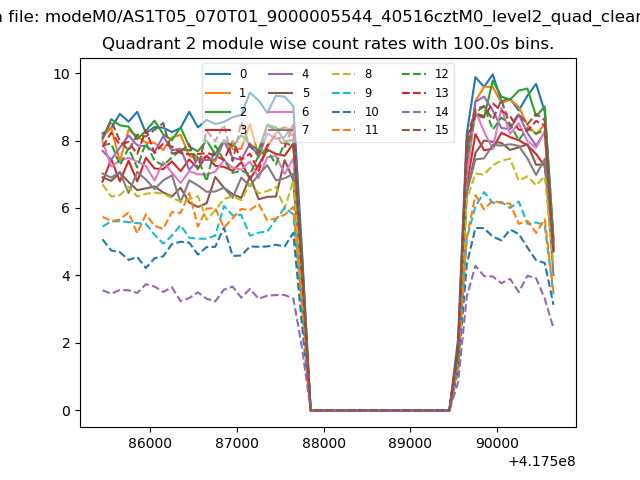
| Module-wise count rates for Quadrant B Data is divided into 100 sec bins |
 |
 |
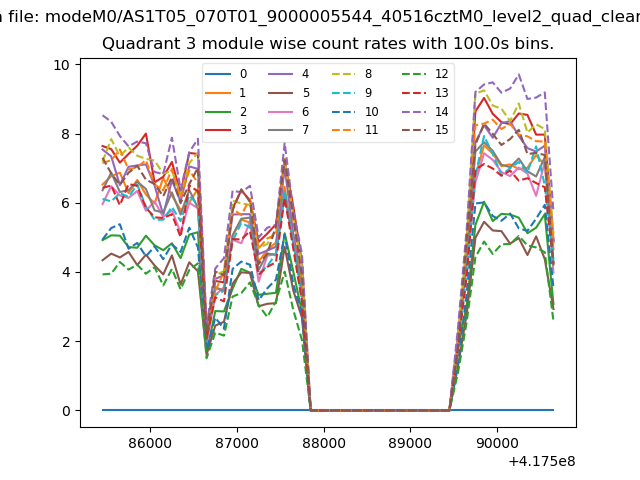
| Module-wise count rates for Quadrant C Data is divided into 100 sec bins |
 |
 |
| Module-wise count rates for Quadrant D Data is divided into 100 sec bins |
 |
 |
| Parameter | Plot |
|---|---|
| CZT HV Monitor | 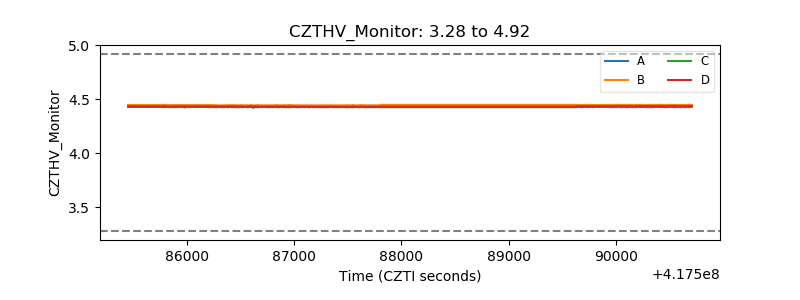 |
| D_VDD | 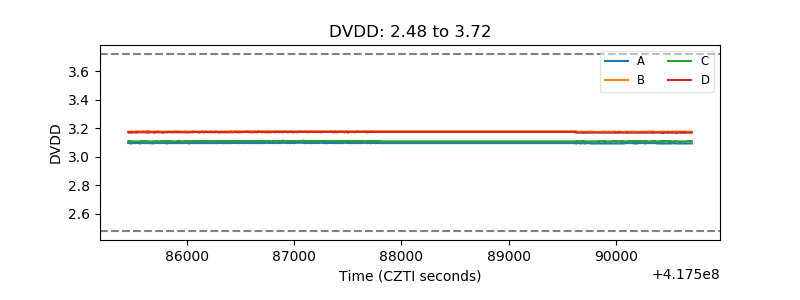 |
| Temperature 1 | 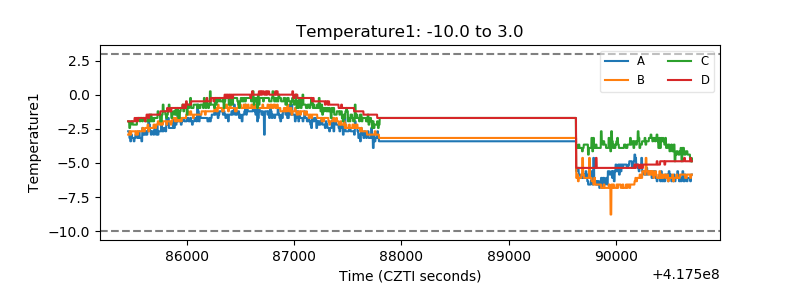 |
| Veto HV Monitor | 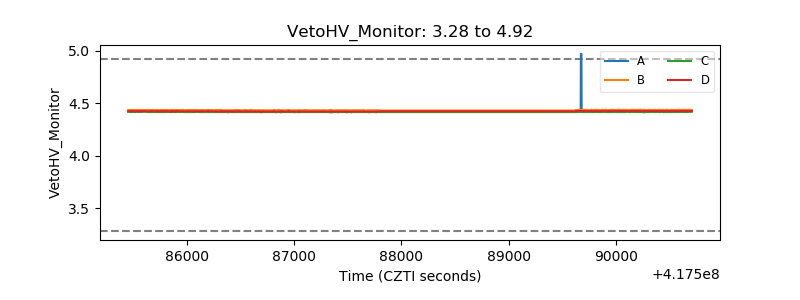 |
| Veto LLD | 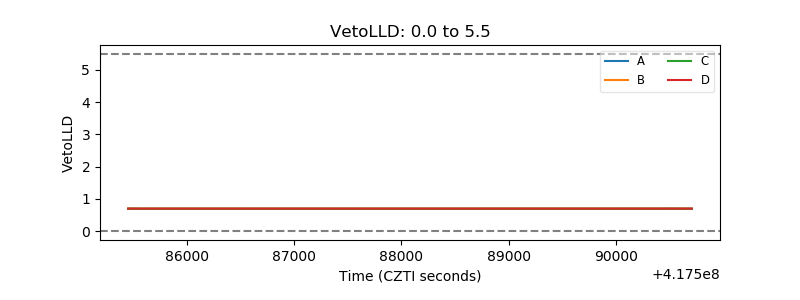 |
| Alpha Counter | 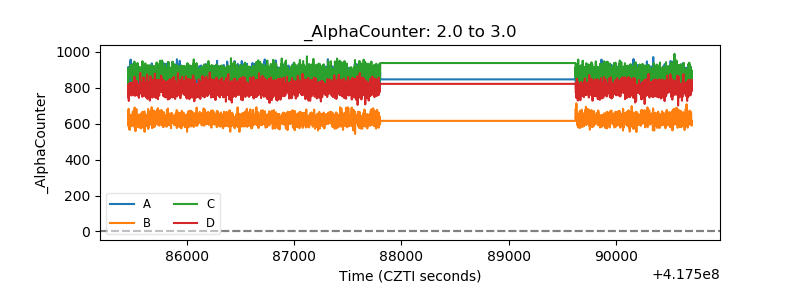 |
| _CPM_Rate | 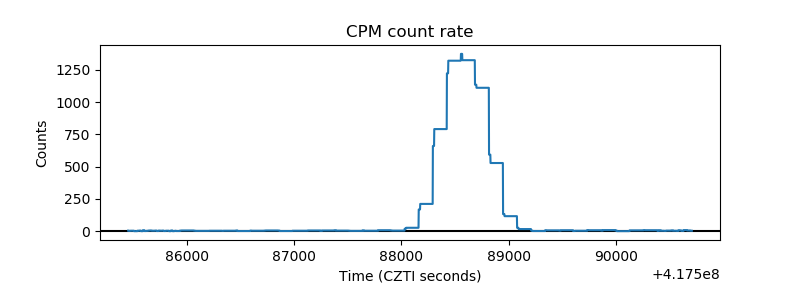 |
| CZT Counter | 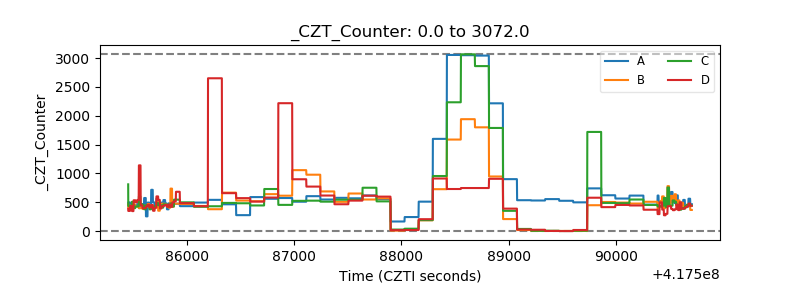 |
| +2.5 Volts monitor | 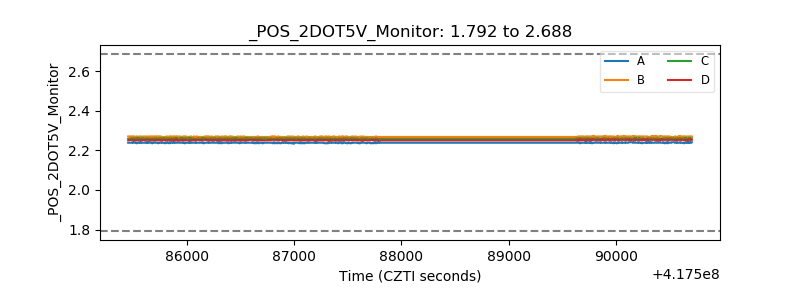 |
| +5 Volts monitor | 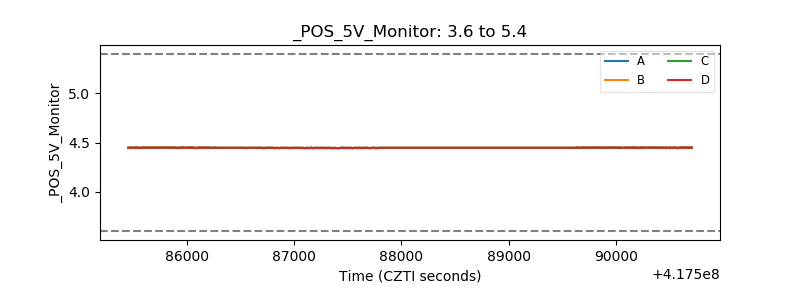 |
| _ROLL_ROT | 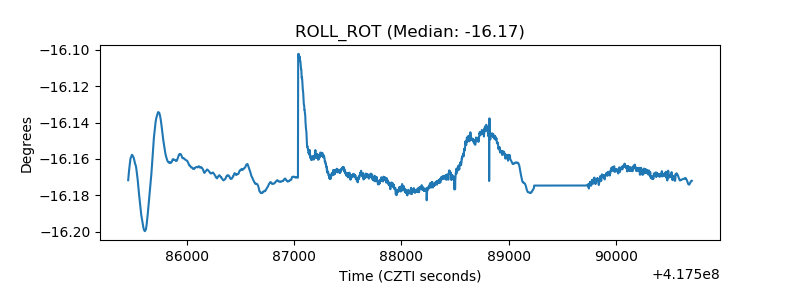 |
| _Roll_DEC | 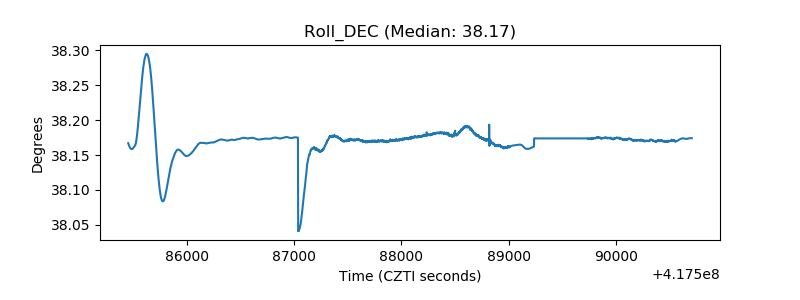 |
| _Roll_RA | 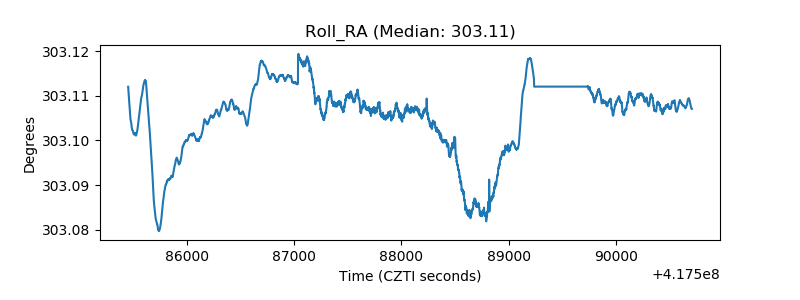 |
| Veto Counter | 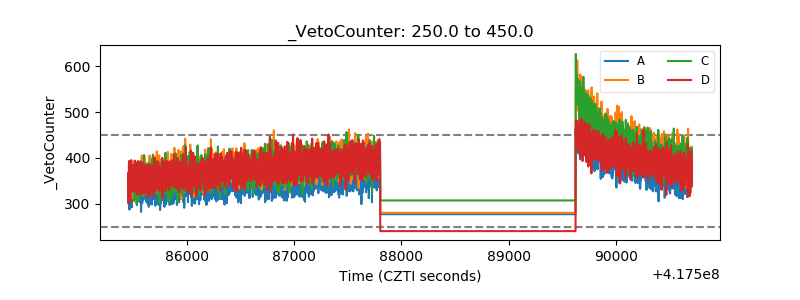 |