| Param | Original file | Final file |
|---|---|---|
| Filename | modeM0/AS1T05_070T01_9000005544_40517cztM0_level2.fits | modeM0/AS1T05_070T01_9000005544_40517cztM0_level2_quad_clean.evt |
| Size (bytes) | 302,310,720 | 91,128,960 |
| Size | 288.3 MB | 86.9 MB |
| Events in quadrant A | 2,850,535 | 623,353 |
| Events in quadrant B | 2,629,740 | 644,414 |
| Events in quadrant C | 2,669,946 | 605,695 |
| Events in quadrant D | 2,632,098 | 519,165 |
| Mode M0 | |||
|---|---|---|---|
| Quadrant | BADHDUFLAG | Total packets | Discarded packets |
| A | 0 | 11520 | 2 |
| B | 0 | 11185 | 1 |
| C | 0 | 11149 | 1 |
| D | 0 | 11441 | 1 |
| Mode M9 | |||
|---|---|---|---|
| Quadrant | BADHDUFLAG | Total packets | Discarded packets |
| A | 0 | 19 | 0 |
| B | 0 | 19 | 0 |
| C | 0 | 19 | 0 |
| D | 0 | 19 | 0 |
| Mode SS | |||
|---|---|---|---|
| Quadrant | BADHDUFLAG | Total packets | Discarded packets |
| A | 0 | 108 | 0 |
| B | 0 | 108 | 0 |
| C | 0 | 108 | 0 |
| D | 0 | 108 | 0 |
| Quadrant | Total seconds | Saturated seconds | Saturation percentage |
|---|---|---|---|
| A | 5232 | 6 | 0.114679% |
| B | 5232 | 27 | 0.516055% |
| C | 5232 | 45 | 0.860092% |
| D | 5232 | 415 | 7.931957% |
Noise dominated data is calculated using 1-second bins in cleaned event files. If a bin has >2000 counts, and if more than 50% of those come from <1% of pixels, then it is considered to be noise-dominated and hence unusable.
| Quadrant | # 1 sec bins | Bins with >0 counts | Bins with >2000 counts | High rate bins dominated by noise | Noise dominated (total time) | Noise dominated (detector-on time) | Marked lightcurve |
|---|---|---|---|---|---|---|---|
| A | 7175 | 5233 | 4 | 4 | 0.06% | 0.08% | 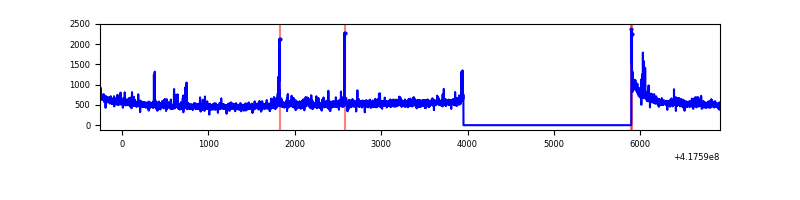 |
| B | 7175 | 5233 | 16 | 16 | 0.22% | 0.31% | 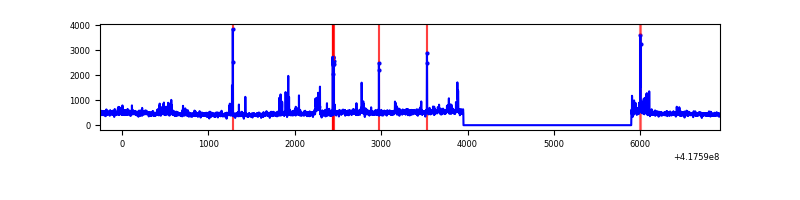 |
| C | 7175 | 5233 | 39 | 39 | 0.54% | 0.75% | 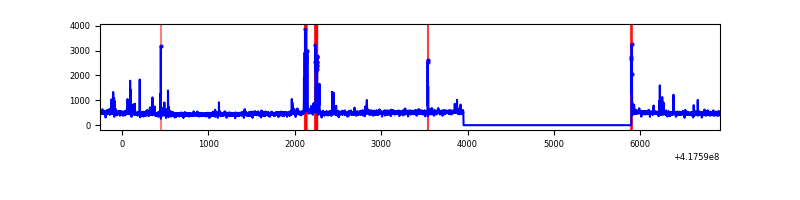 |
| D | 7175 | 5233 | 30 | 30 | 0.42% | 0.57% | 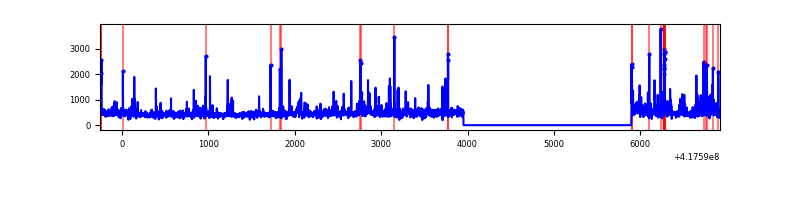 |
Top three noisy pixels from each quadrant. If the there are fewer than three noisy pixels in the level2.evt file, extra rows are filled as -1
| Pixel properties | Quadrant properties | ||||||
|---|---|---|---|---|---|---|---|
| Quadrant | DetID | PixID | Counts | Sigma | Mean | Median | Sigma |
| A | 10 | 83 | 442540 | 3628.84 | 588 | 578 | 121.8 |
| A | 12 | 189 | 99846 | 815.06 | 588 | 578 | 121.8 |
| A | 2 | 79 | 17096 | 135.63 | 588 | 578 | 121.8 |
| B | 3 | 112 | 103716 | 914.05 | 584 | 569 | 112.8 |
| B | 0 | 230 | 67411 | 592.33 | 584 | 569 | 112.8 |
| B | 4 | 171 | 65208 | 572.81 | 584 | 569 | 112.8 |
| C | 15 | 214 | 228277 | 1700.66 | 567 | 570 | 133.9 |
| C | 14 | 254 | 168579 | 1254.8 | 567 | 570 | 133.9 |
| C | 10 | 20 | 36218 | 266.24 | 567 | 570 | 133.9 |
| D | 12 | 6 | 158680 | 1185.78 | 541 | 525 | 133.4 |
| D | 12 | 191 | 150777 | 1126.52 | 541 | 525 | 133.4 |
| D | 2 | 250 | 65987 | 490.81 | 541 | 525 | 133.4 |
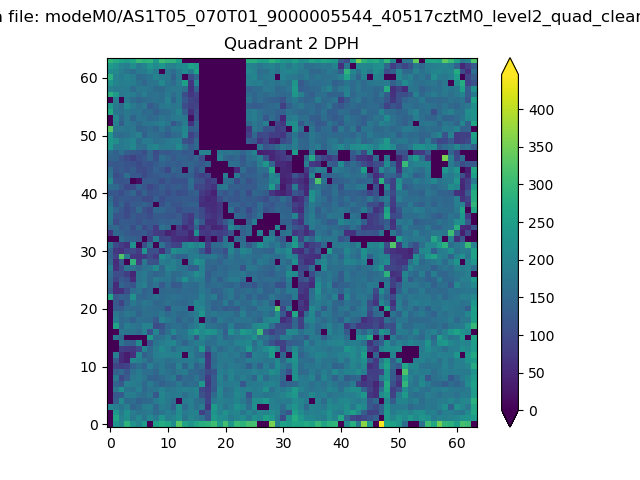
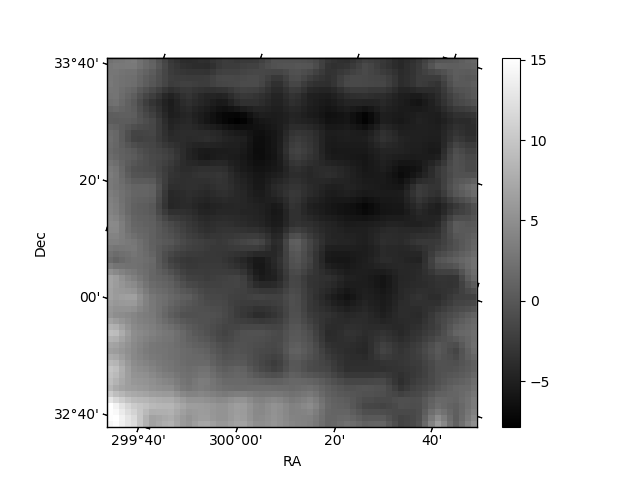
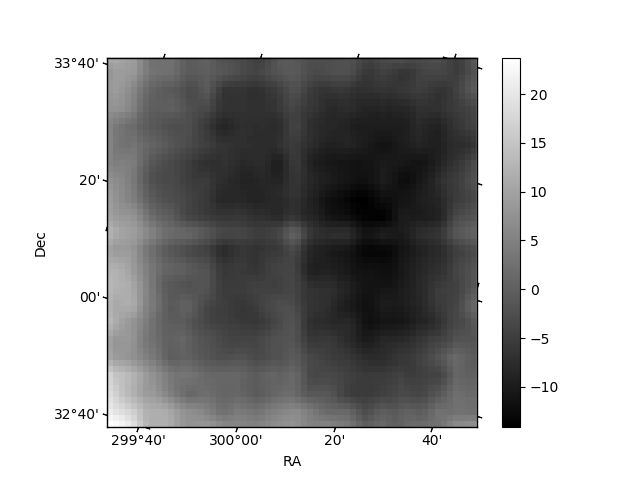
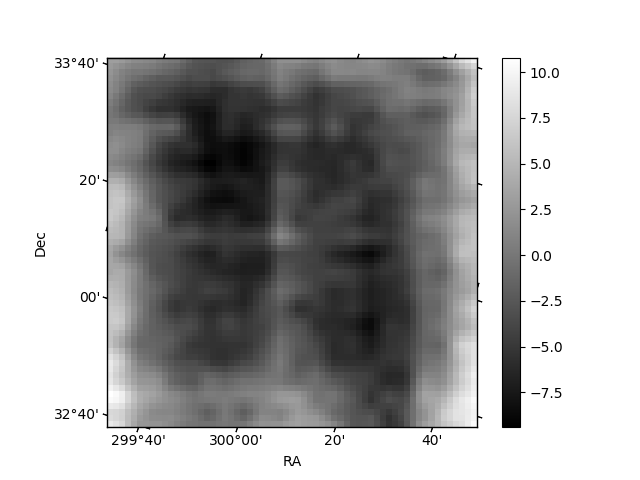
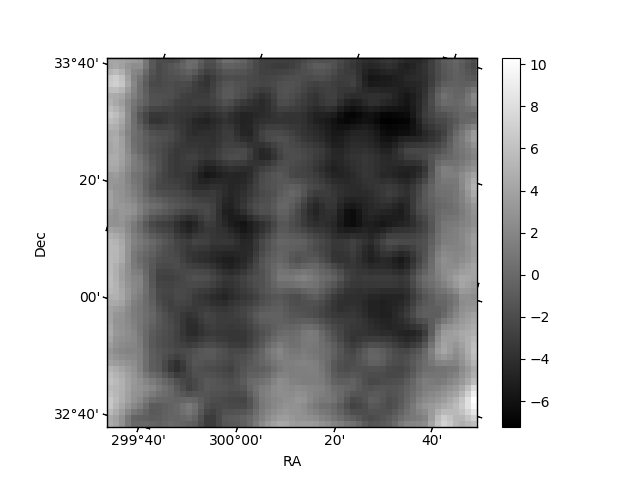
Histogram calculated using DETX and DETY for each event in the final _common_clean file
| Quadrant A | 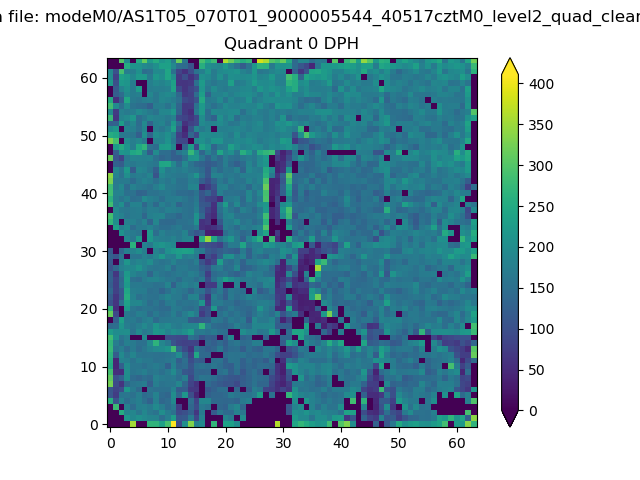 |
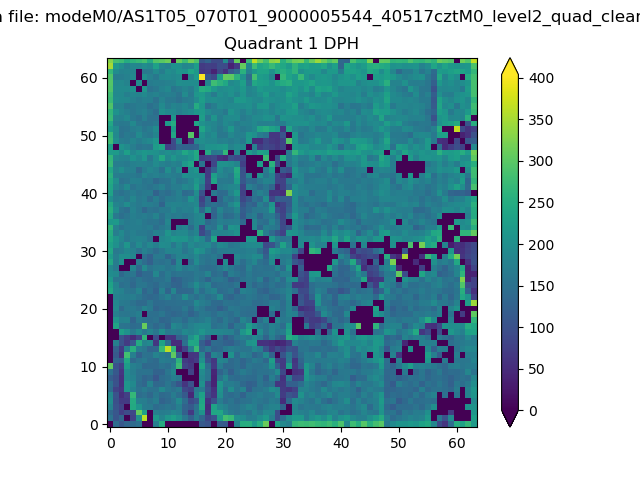 |
Quadrant B |
|---|---|---|---|
| Quadrant D | 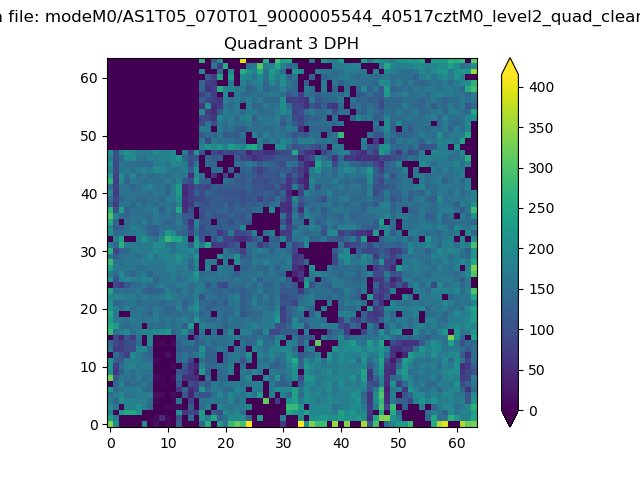 |
 |
Quadrant C |
| Plot type | Count rate plots | Images |
|---|---|---|
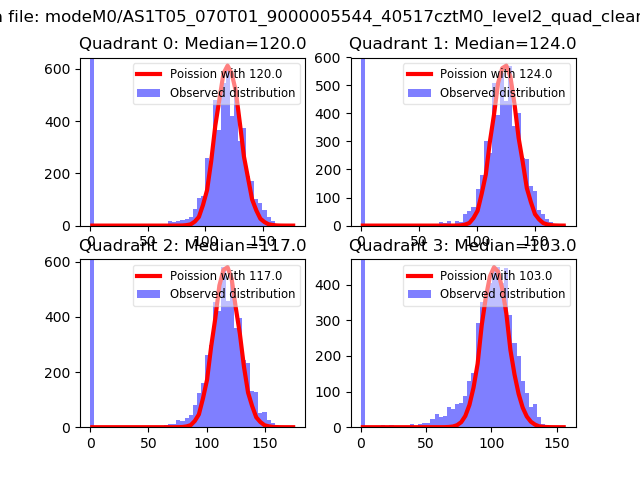
| Comparison with Poisson distribution Blue bars denote a histogram of data divided into 1 sec bins. Red curve is a Poisson curve with rate = median count rate of data. |
 |
 |
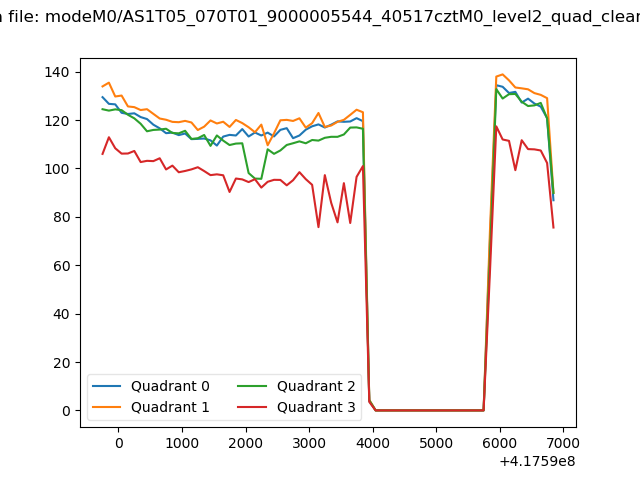
| Quadrant-wise count rates Data is divided into 100 sec bins |
 |
|
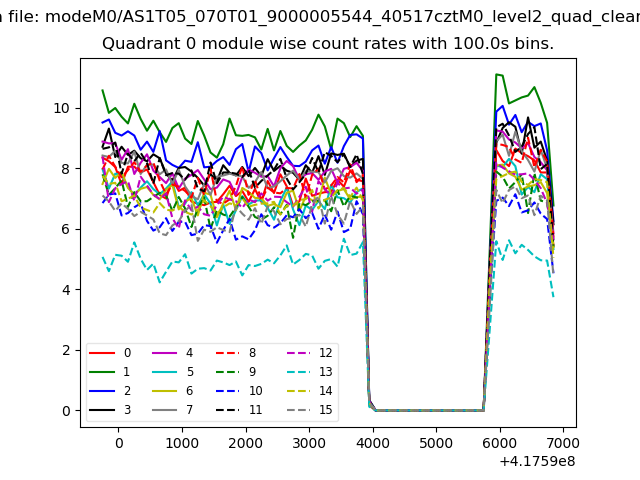
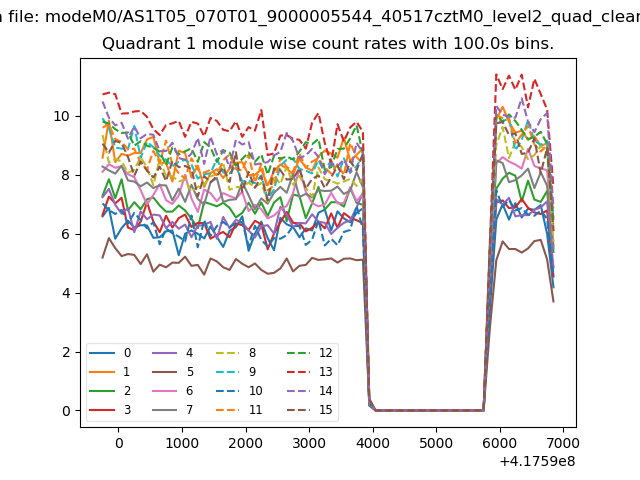
| Module-wise count rates for Quadrant A Data is divided into 100 sec bins |
 |
 |
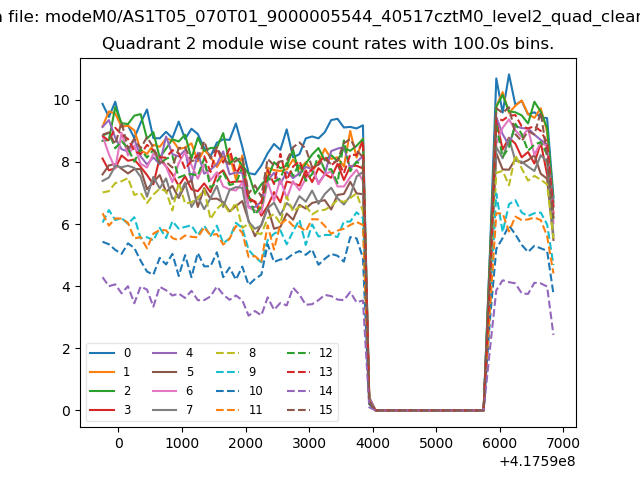
| Module-wise count rates for Quadrant B Data is divided into 100 sec bins |
 |
 |
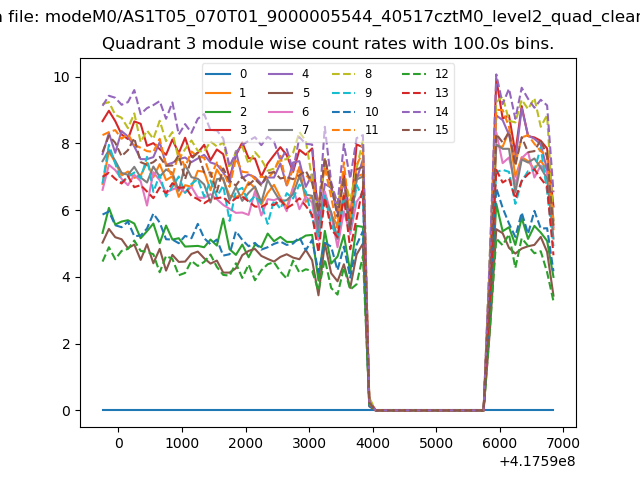
| Module-wise count rates for Quadrant C Data is divided into 100 sec bins |
 |
 |
| Module-wise count rates for Quadrant D Data is divided into 100 sec bins |
 |
 |
| Parameter | Plot |
|---|---|
| CZT HV Monitor | 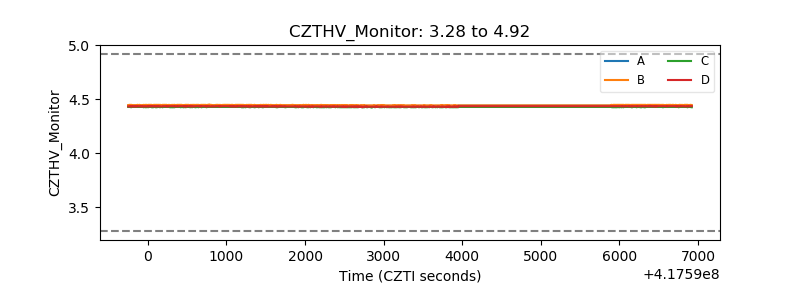 |
| D_VDD | 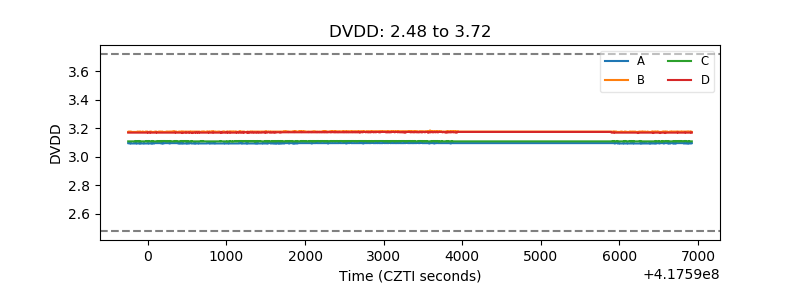 |
| Temperature 1 | 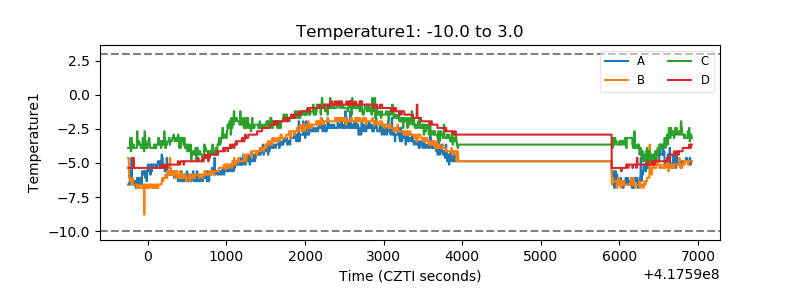 |
| Veto HV Monitor | 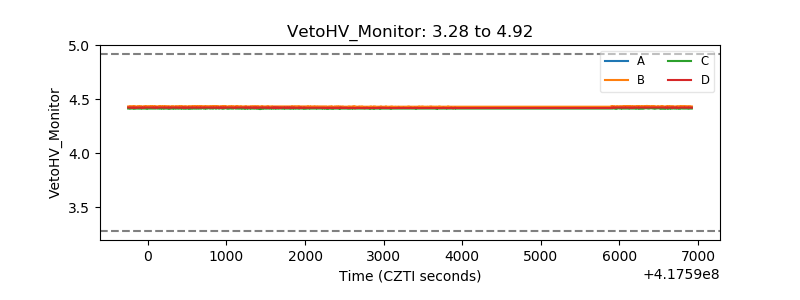 |
| Veto LLD | 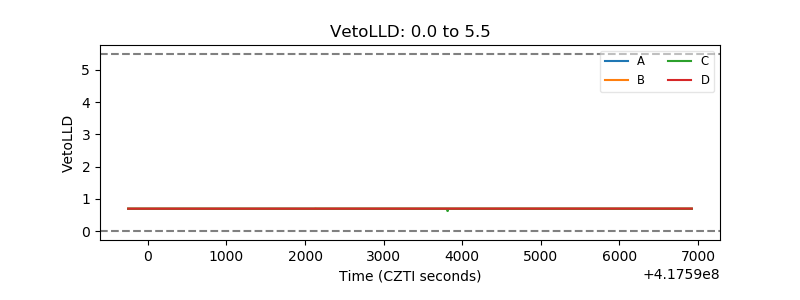 |
| Alpha Counter | 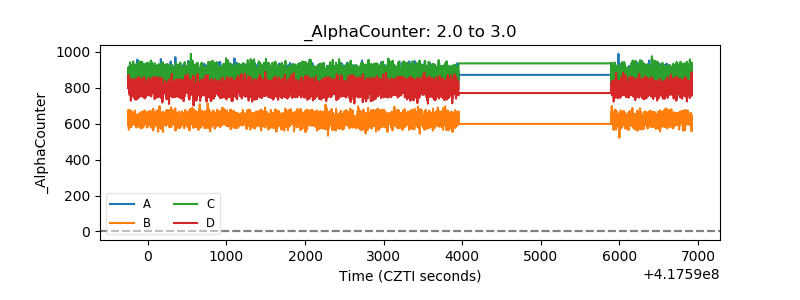 |
| _CPM_Rate | 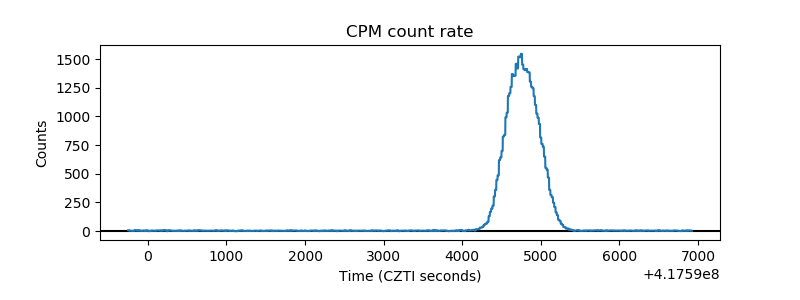 |
| CZT Counter | 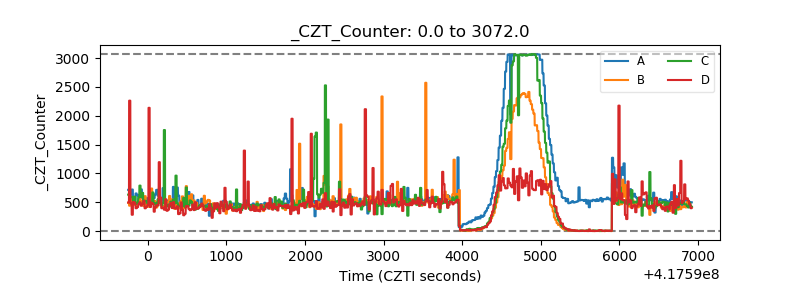 |
| +2.5 Volts monitor | 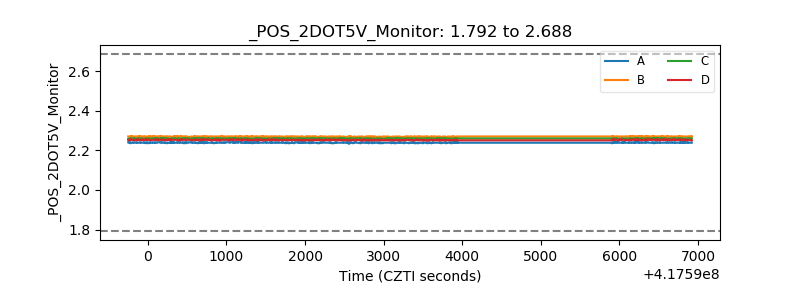 |
| +5 Volts monitor | 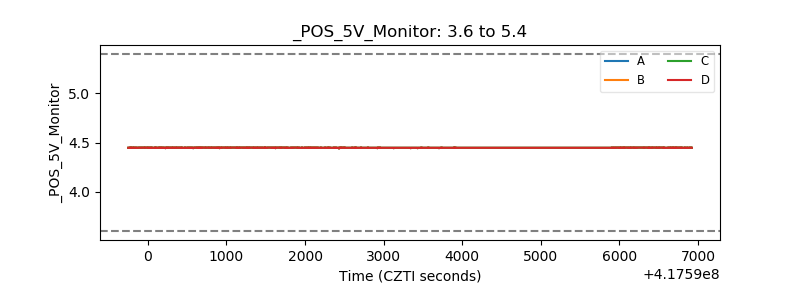 |
| _ROLL_ROT | 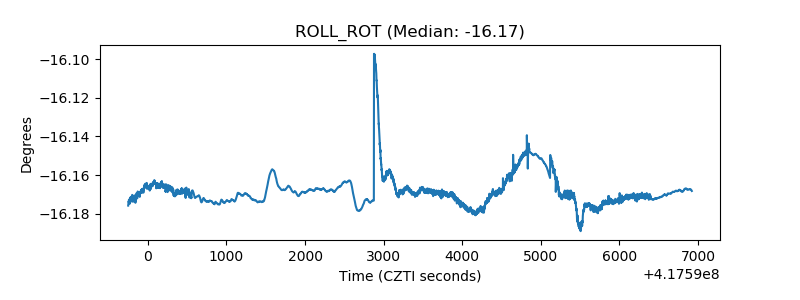 |
| _Roll_DEC | 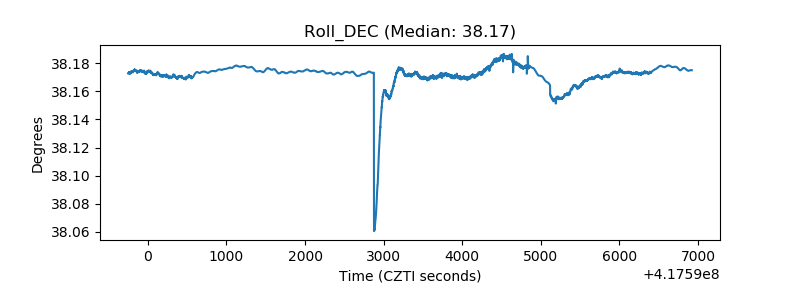 |
| _Roll_RA | 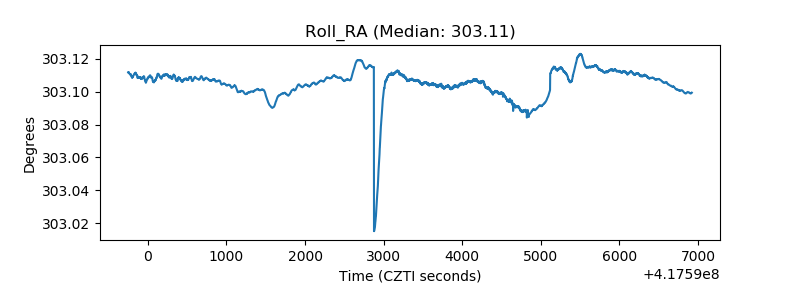 |
| Veto Counter | 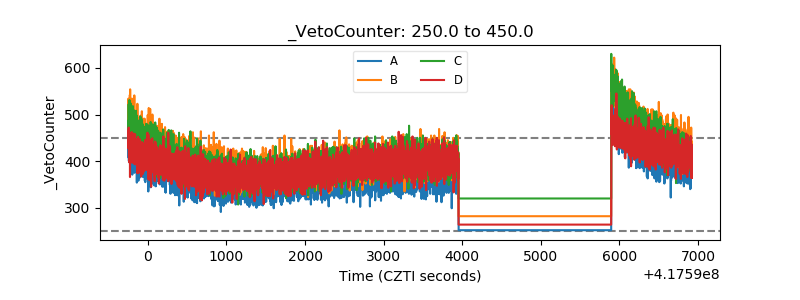 |