| Param | Original file | Final file |
|---|---|---|
| Filename | modeM0/AS1T05_070T01_9000005544_40518cztM0_level2.fits | modeM0/AS1T05_070T01_9000005544_40518cztM0_level2_quad_clean.evt |
| Size (bytes) | 353,842,560 | 90,457,920 |
| Size | 337.5 MB | 86.3 MB |
| Events in quadrant A | 2,926,958 | 634,630 |
| Events in quadrant B | 3,053,053 | 653,686 |
| Events in quadrant C | 2,894,931 | 613,238 |
| Events in quadrant D | 3,818,824 | 474,113 |
| Mode M0 | |||
|---|---|---|---|
| Quadrant | BADHDUFLAG | Total packets | Discarded packets |
| A | 0 | 11583 | 3 |
| B | 0 | 12468 | 2 |
| C | 0 | 11715 | 2 |
| D | 0 | 14813 | 2 |
| Mode M9 | |||
|---|---|---|---|
| Quadrant | BADHDUFLAG | Total packets | Discarded packets |
| A | 0 | 21 | 0 |
| B | 0 | 21 | 0 |
| C | 0 | 21 | 0 |
| D | 0 | 22 | 0 |
| Mode SS | |||
|---|---|---|---|
| Quadrant | BADHDUFLAG | Total packets | Discarded packets |
| A | 0 | 106 | 0 |
| B | 0 | 106 | 0 |
| C | 0 | 106 | 0 |
| D | 0 | 106 | 0 |
| Quadrant | Total seconds | Saturated seconds | Saturation percentage |
|---|---|---|---|
| A | 5186 | 11 | 0.212110% |
| B | 5186 | 35 | 0.674894% |
| C | 5186 | 58 | 1.118396% |
| D | 5186 | 914 | 17.624373% |
Noise dominated data is calculated using 1-second bins in cleaned event files. If a bin has >2000 counts, and if more than 50% of those come from <1% of pixels, then it is considered to be noise-dominated and hence unusable.
| Quadrant | # 1 sec bins | Bins with >0 counts | Bins with >2000 counts | High rate bins dominated by noise | Noise dominated (total time) | Noise dominated (detector-on time) | Marked lightcurve |
|---|---|---|---|---|---|---|---|
| A | 7249 | 5187 | 4 | 4 | 0.06% | 0.08% | 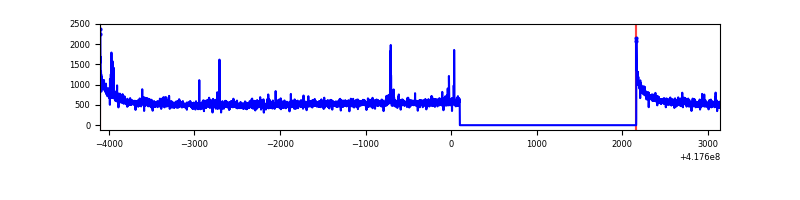 |
| B | 7249 | 5187 | 21 | 21 | 0.29% | 0.40% | 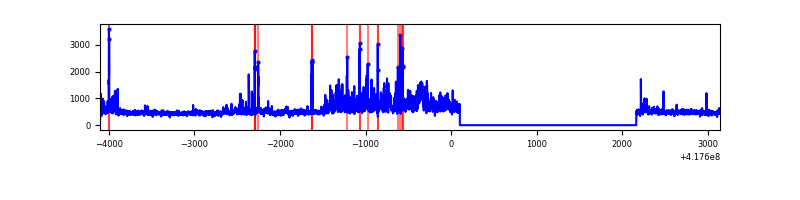 |
| C | 7249 | 5187 | 51 | 51 | 0.70% | 0.98% | 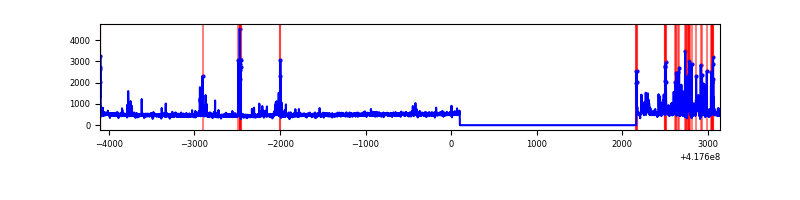 |
| D | 7249 | 5186 | 402 | 402 | 5.55% | 7.75% | 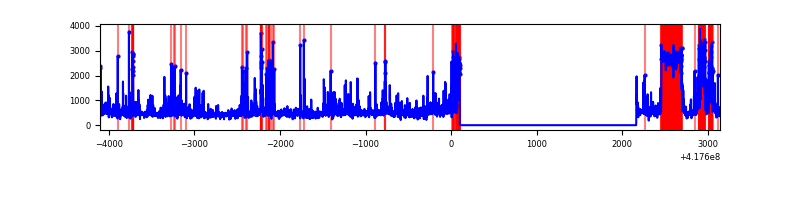 |
Top three noisy pixels from each quadrant. If the there are fewer than three noisy pixels in the level2.evt file, extra rows are filled as -1
| Pixel properties | Quadrant properties | ||||||
|---|---|---|---|---|---|---|---|
| Quadrant | DetID | PixID | Counts | Sigma | Mean | Median | Sigma |
| A | 10 | 83 | 509348 | 4140.38 | 599 | 587 | 122.9 |
| A | 12 | 189 | 71589 | 577.83 | 599 | 587 | 122.9 |
| A | 7 | 3 | 16020 | 125.6 | 599 | 587 | 122.9 |
| B | 3 | 112 | 388207 | 3404.94 | 591 | 575 | 113.8 |
| B | 4 | 171 | 140139 | 1225.92 | 591 | 575 | 113.8 |
| B | 5 | 255 | 81724 | 712.81 | 591 | 575 | 113.8 |
| C | 14 | 254 | 260676 | 1922.87 | 575 | 578 | 135.3 |
| C | 15 | 214 | 228510 | 1685.07 | 575 | 578 | 135.3 |
| C | 10 | 20 | 100506 | 738.75 | 575 | 578 | 135.3 |
| D | 12 | 0 | 1040851 | 8078.78 | 519 | 503 | 128.8 |
| D | 2 | 250 | 242978 | 1882.93 | 519 | 503 | 128.8 |
| D | 12 | 227 | 165590 | 1281.98 | 519 | 503 | 128.8 |
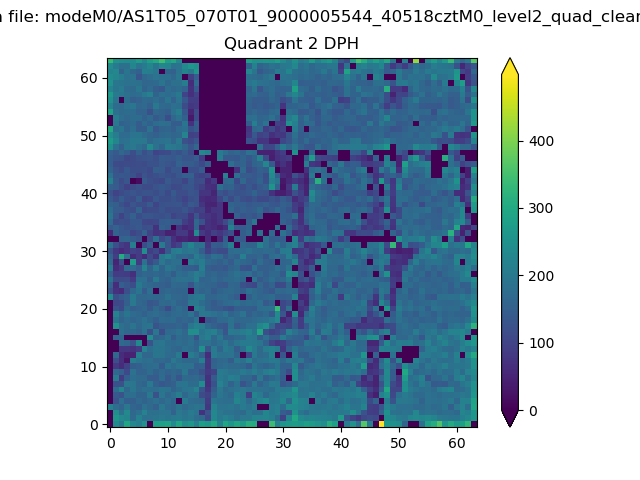
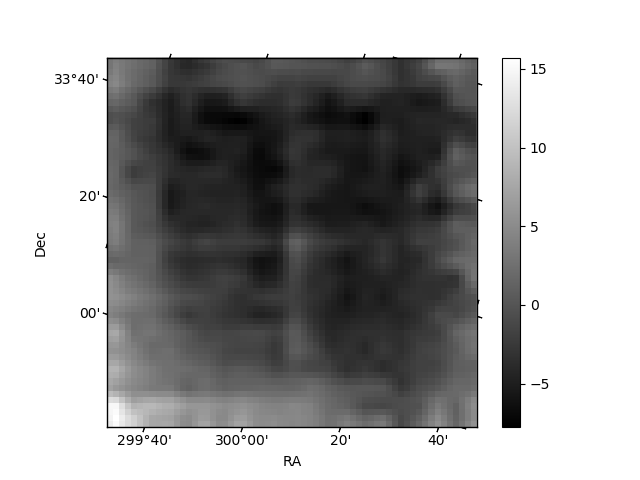
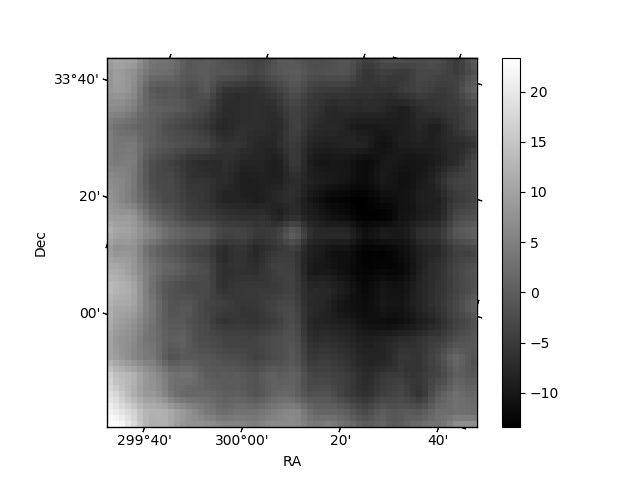
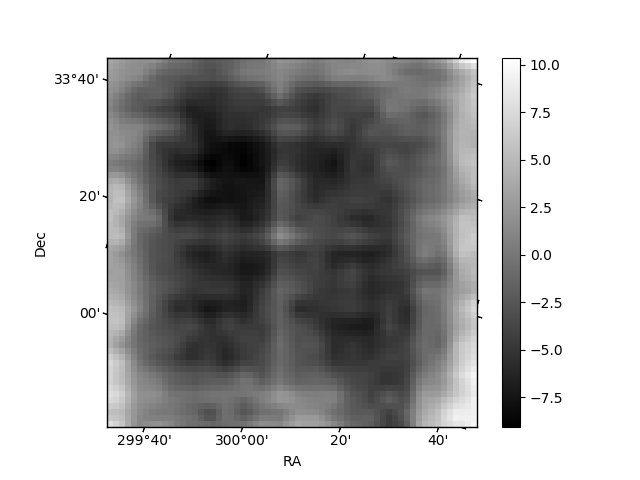
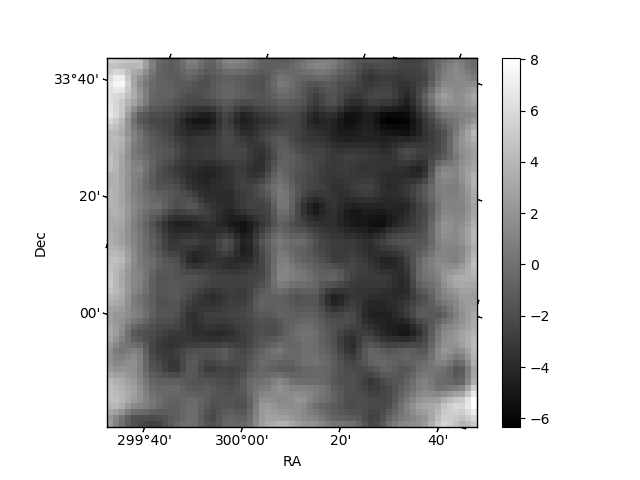
Histogram calculated using DETX and DETY for each event in the final _common_clean file
| Quadrant A | 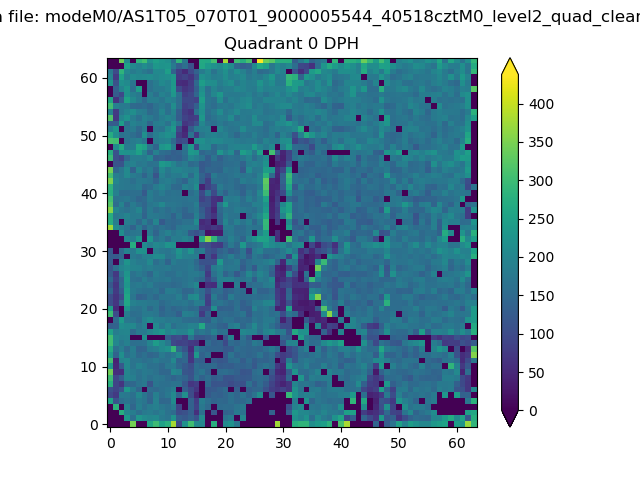 |
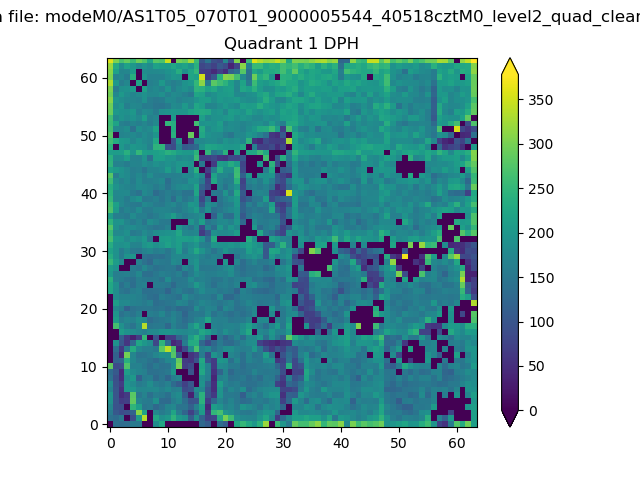 |
Quadrant B |
|---|---|---|---|
| Quadrant D | 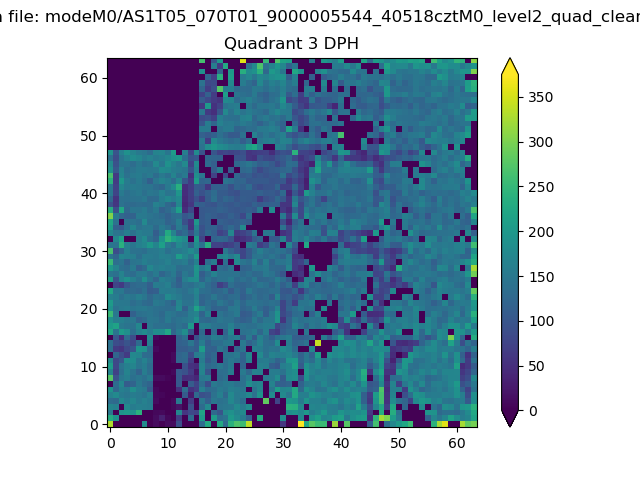 |
 |
Quadrant C |
| Plot type | Count rate plots | Images |
|---|---|---|
| Comparison with Poisson distribution Blue bars denote a histogram of data divided into 1 sec bins. Red curve is a Poisson curve with rate = median count rate of data. |
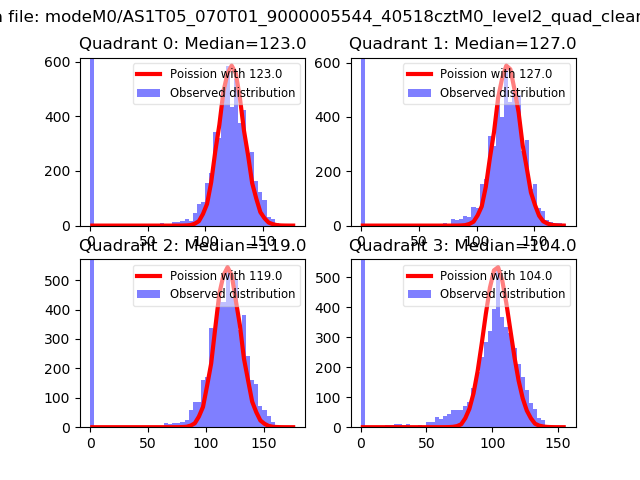 |
 |
| Quadrant-wise count rates Data is divided into 100 sec bins |
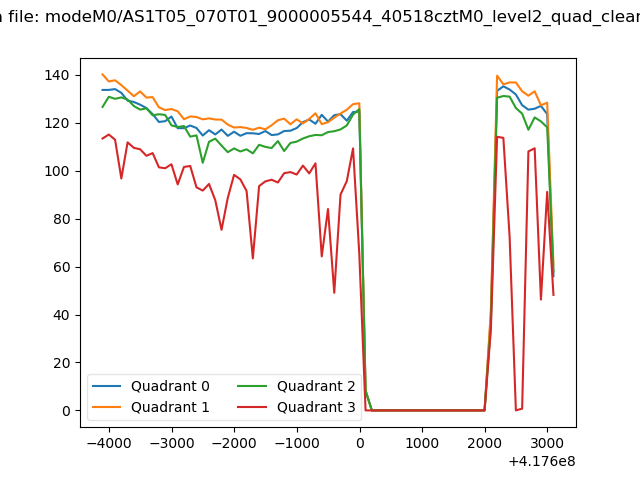 |
|
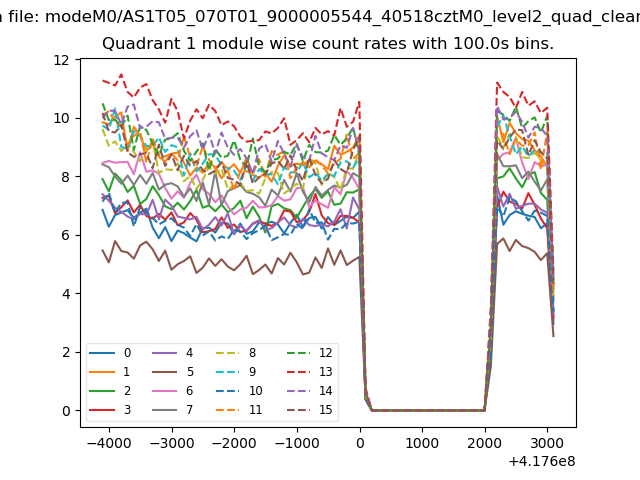
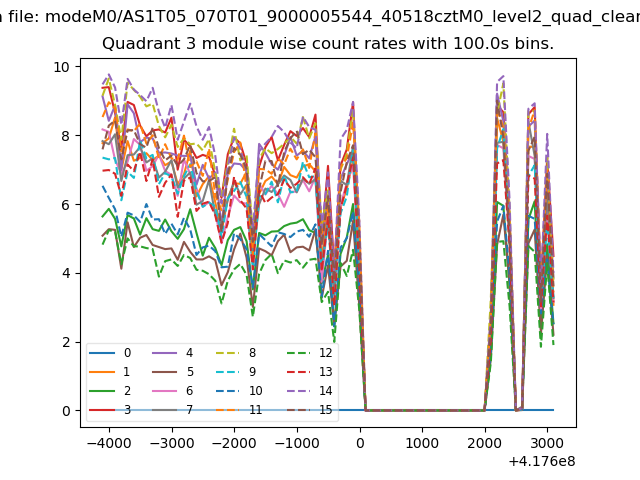
| Module-wise count rates for Quadrant A Data is divided into 100 sec bins |
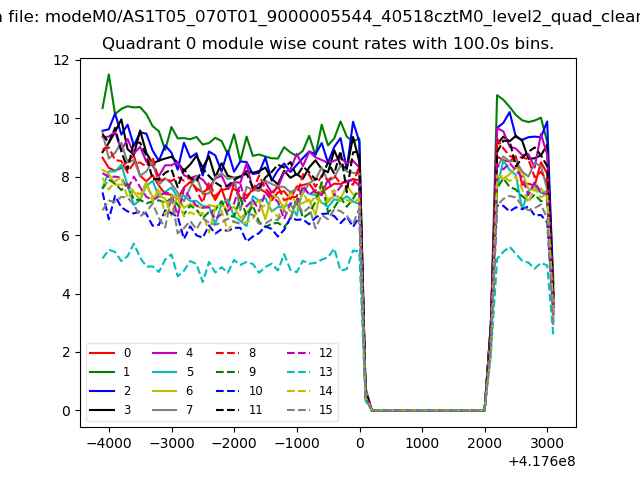 |
 |
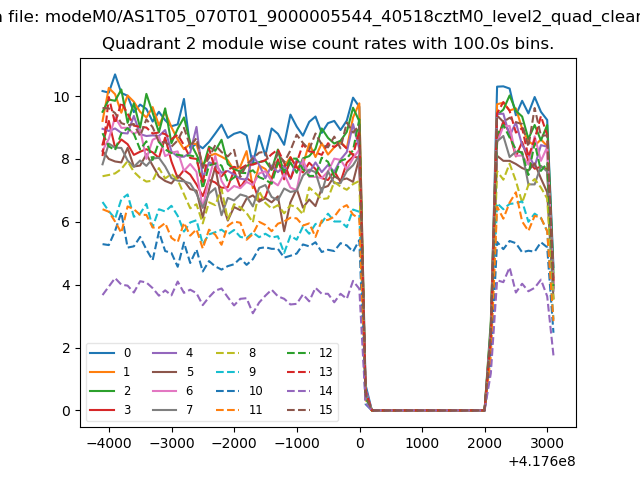
| Module-wise count rates for Quadrant B Data is divided into 100 sec bins |
 |
 |
| Module-wise count rates for Quadrant C Data is divided into 100 sec bins |
 |
 |
| Module-wise count rates for Quadrant D Data is divided into 100 sec bins |
 |
 |
| Parameter | Plot |
|---|---|
| CZT HV Monitor | 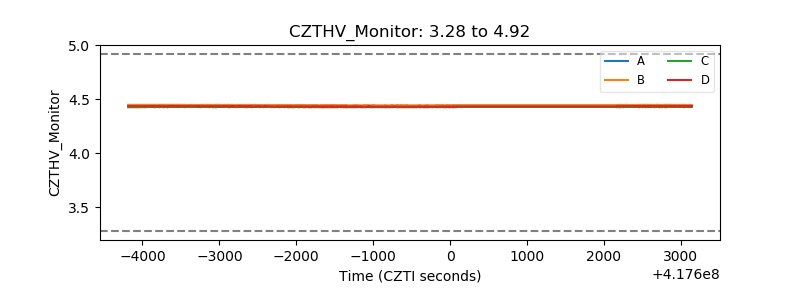 |
| D_VDD | 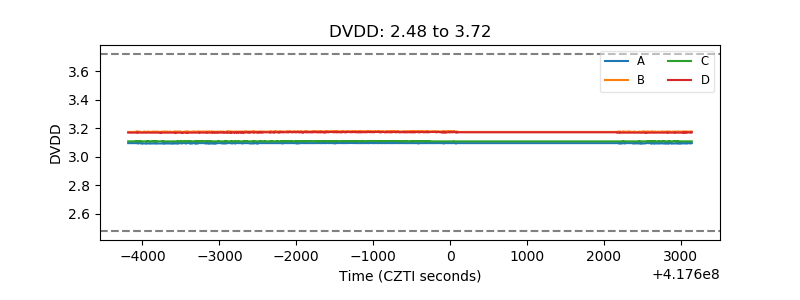 |
| Temperature 1 | 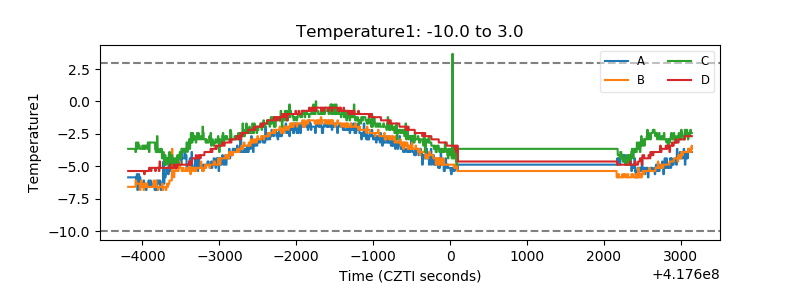 |
| Veto HV Monitor | 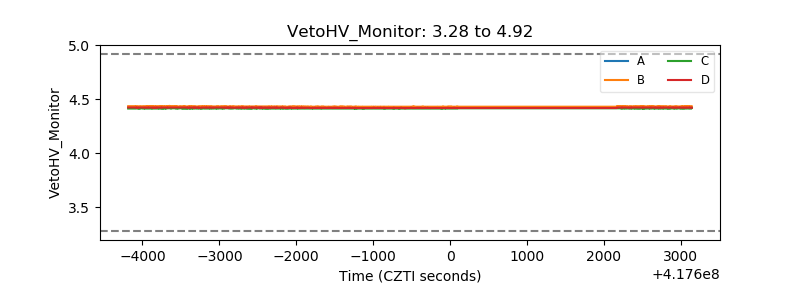 |
| Veto LLD | 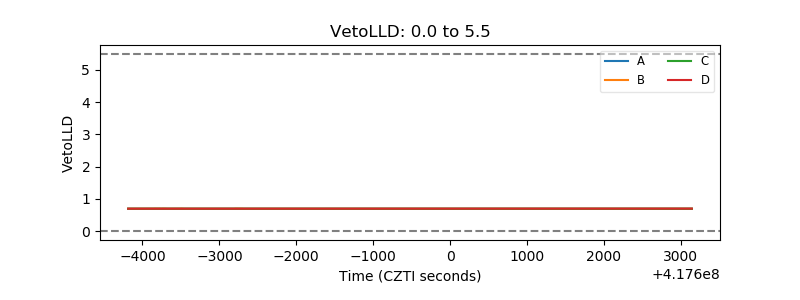 |
| Alpha Counter | 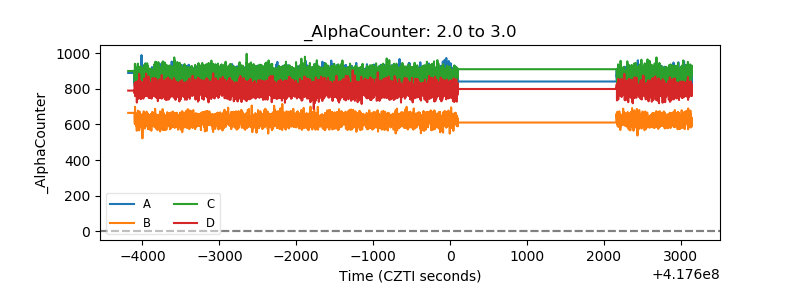 |
| _CPM_Rate | 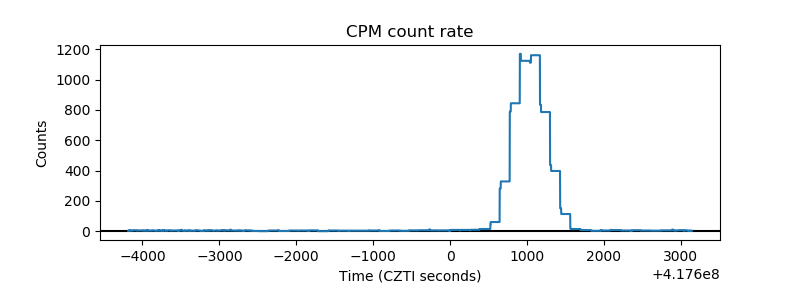 |
| CZT Counter | 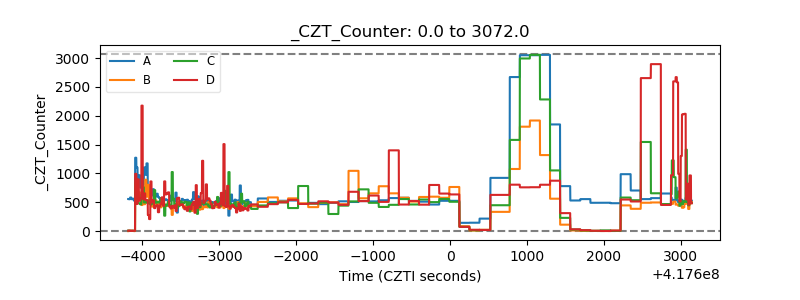 |
| +2.5 Volts monitor | 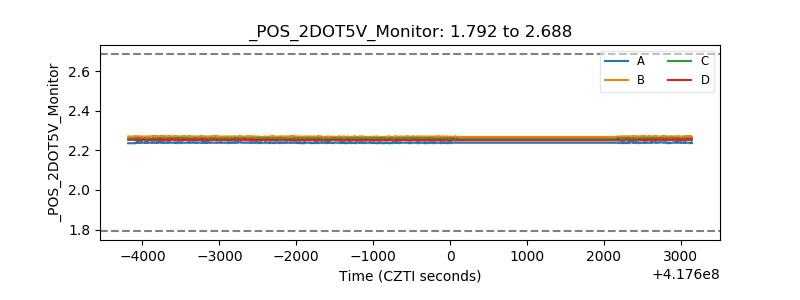 |
| +5 Volts monitor | 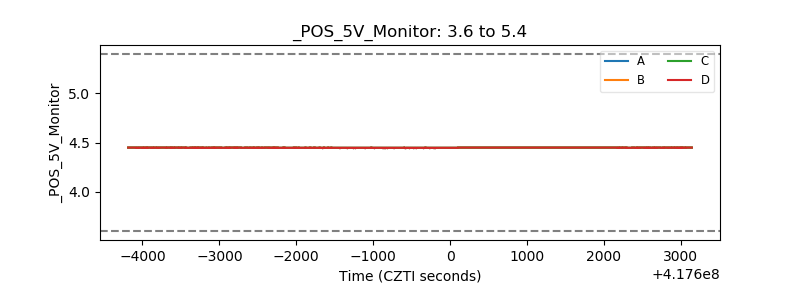 |
| _ROLL_ROT |  |
| _Roll_DEC | 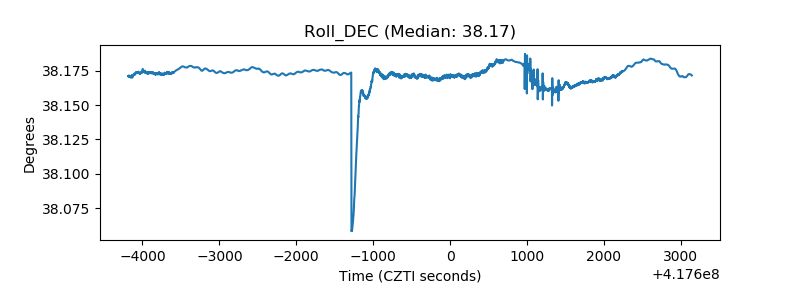 |
| _Roll_RA | 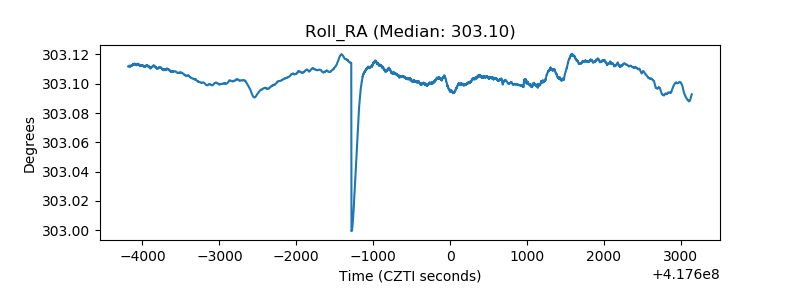 |
| Veto Counter | 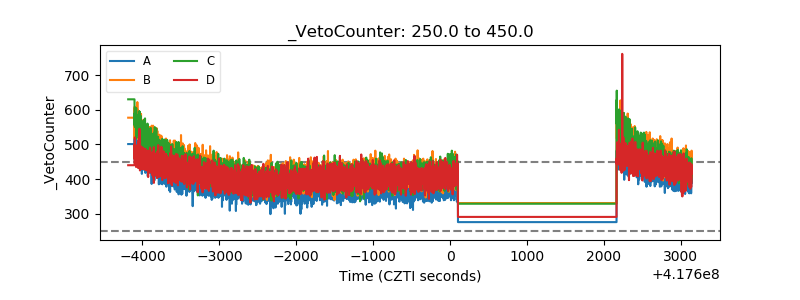 |