| Param | Original file | Final file |
|---|---|---|
| Filename | modeM0/AS1T05_070T01_9000005544_40519cztM0_level2.fits | modeM0/AS1T05_070T01_9000005544_40519cztM0_level2_quad_clean.evt |
| Size (bytes) | 379,396,800 | 83,831,040 |
| Size | 361.8 MB | 79.9 MB |
| Events in quadrant A | 2,758,636 | 598,790 |
| Events in quadrant B | 2,917,035 | 612,015 |
| Events in quadrant C | 3,465,587 | 568,877 |
| Events in quadrant D | 4,520,314 | 414,389 |
| Mode M0 | |||
|---|---|---|---|
| Quadrant | BADHDUFLAG | Total packets | Discarded packets |
| A | 0 | 10946 | 3 |
| B | 0 | 11807 | 2 |
| C | 0 | 13432 | 2 |
| D | 0 | 16713 | 2 |
| Mode M9 | |||
|---|---|---|---|
| Quadrant | BADHDUFLAG | Total packets | Discarded packets |
| A | 0 | 22 | 0 |
| B | 0 | 22 | 0 |
| C | 0 | 22 | 0 |
| D | 0 | 23 | 0 |
| Mode SS | |||
|---|---|---|---|
| Quadrant | BADHDUFLAG | Total packets | Discarded packets |
| A | 0 | 98 | 0 |
| B | 0 | 98 | 0 |
| C | 0 | 98 | 0 |
| D | 0 | 98 | 0 |
| Quadrant | Total seconds | Saturated seconds | Saturation percentage |
|---|---|---|---|
| A | 4907 | 10 | 0.203791% |
| B | 4907 | 38 | 0.774404% |
| C | 4907 | 147 | 2.995720% |
| D | 4907 | 1238 | 25.229264% |
Noise dominated data is calculated using 1-second bins in cleaned event files. If a bin has >2000 counts, and if more than 50% of those come from <1% of pixels, then it is considered to be noise-dominated and hence unusable.
| Quadrant | # 1 sec bins | Bins with >0 counts | Bins with >2000 counts | High rate bins dominated by noise | Noise dominated (total time) | Noise dominated (detector-on time) | Marked lightcurve |
|---|---|---|---|---|---|---|---|
| A | 7030 | 4908 | 2 | 2 | 0.03% | 0.04% | 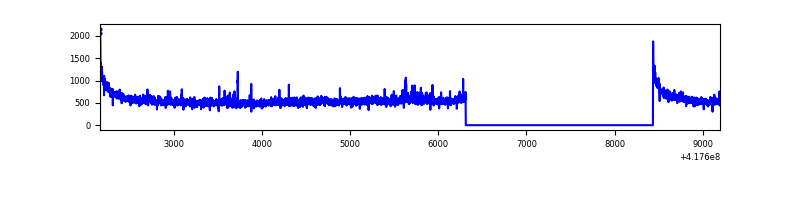 |
| B | 7030 | 4908 | 17 | 17 | 0.24% | 0.35% | 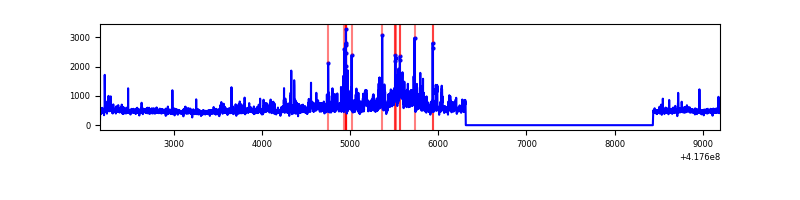 |
| C | 7030 | 4908 | 117 | 117 | 1.66% | 2.38% | 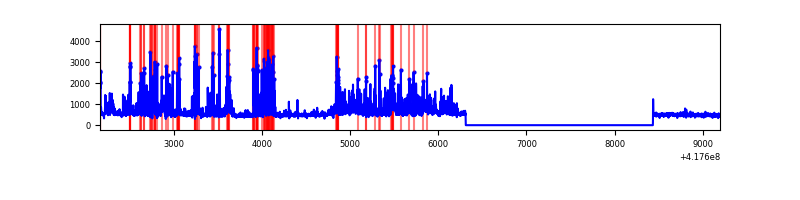 |
| D | 7030 | 4908 | 619 | 619 | 8.81% | 12.61% | 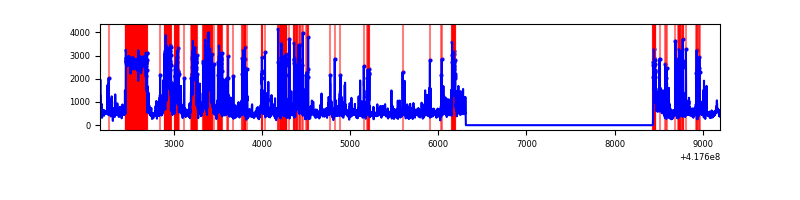 |
Top three noisy pixels from each quadrant. If the there are fewer than three noisy pixels in the level2.evt file, extra rows are filled as -1
| Pixel properties | Quadrant properties | ||||||
|---|---|---|---|---|---|---|---|
| Quadrant | DetID | PixID | Counts | Sigma | Mean | Median | Sigma |
| A | 10 | 83 | 488587 | 4177.75 | 569 | 560 | 116.8 |
| A | 12 | 189 | 57803 | 490.03 | 569 | 560 | 116.8 |
| A | 3 | 137 | 5722 | 44.19 | 569 | 560 | 116.8 |
| B | 3 | 112 | 402401 | 3722.54 | 559 | 544 | 108.0 |
| B | 5 | 32 | 179525 | 1657.96 | 559 | 544 | 108.0 |
| B | 0 | 230 | 42957 | 392.89 | 559 | 544 | 108.0 |
| C | 14 | 254 | 901395 | 7116.69 | 542 | 546 | 126.6 |
| C | 15 | 214 | 217122 | 1710.94 | 542 | 546 | 126.6 |
| C | 10 | 20 | 155453 | 1223.76 | 542 | 546 | 126.6 |
| D | 12 | 0 | 1696653 | 14308.06 | 477 | 465 | 118.5 |
| D | 12 | 227 | 522958 | 4407.45 | 477 | 465 | 118.5 |
| D | 2 | 250 | 199815 | 1681.6 | 477 | 465 | 118.5 |
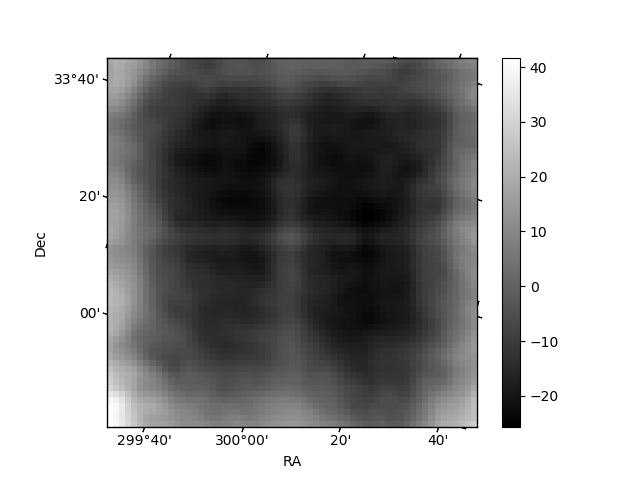
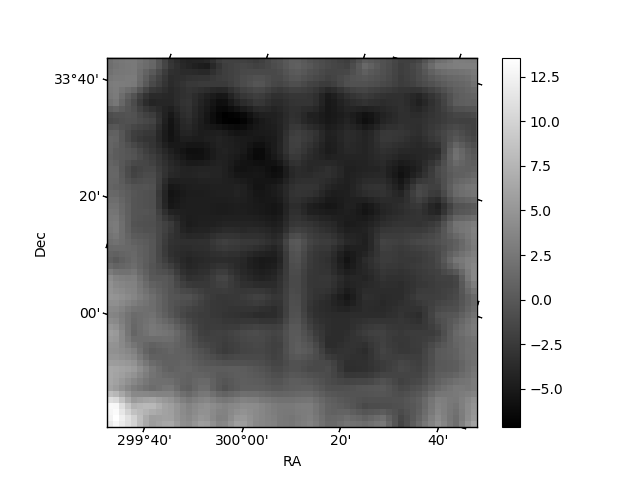
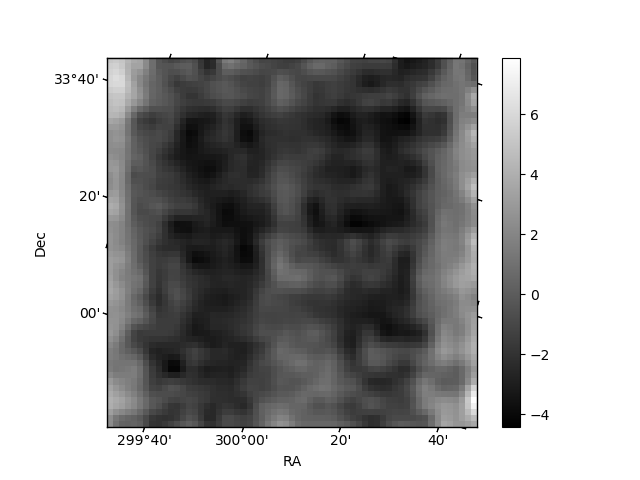
Histogram calculated using DETX and DETY for each event in the final _common_clean file
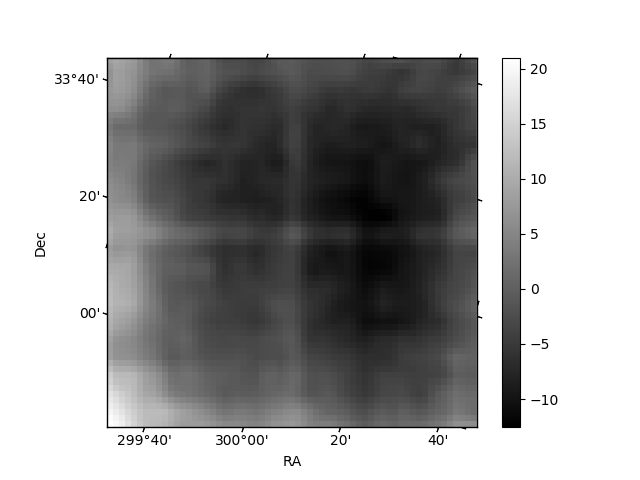
| Quadrant A | 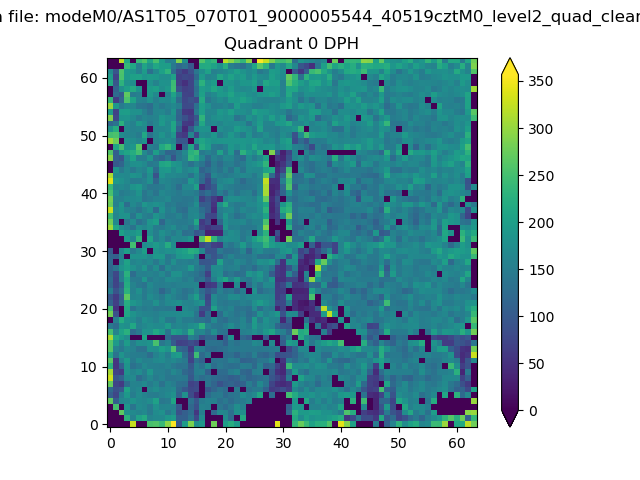 |
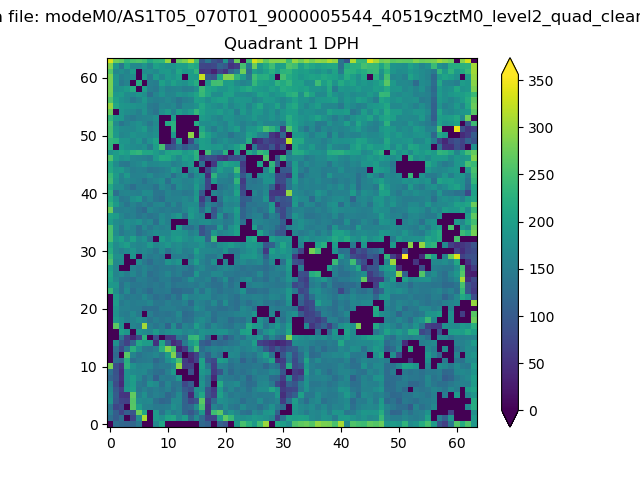 |
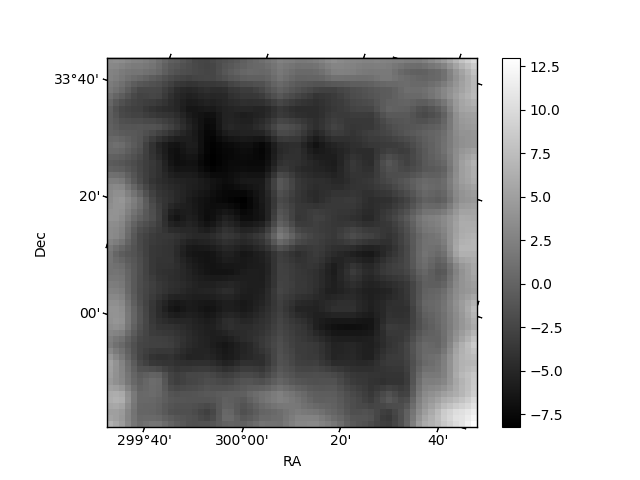
Quadrant B |
|---|---|---|---|
| Quadrant D | 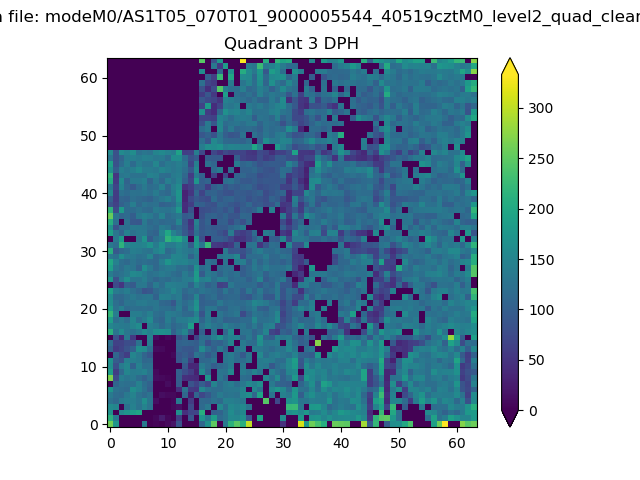 |
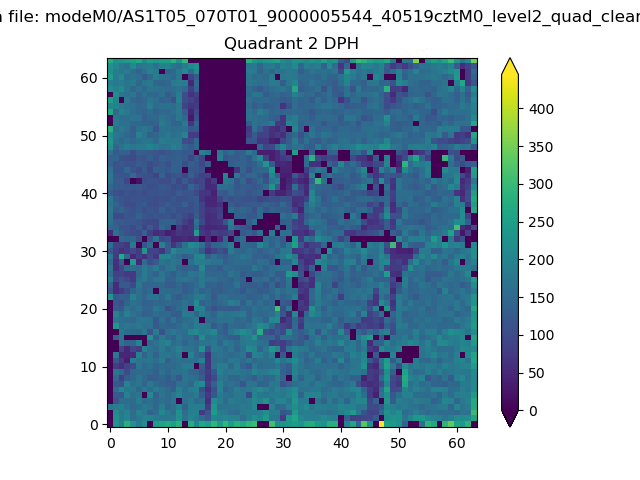 |
Quadrant C |
| Plot type | Count rate plots | Images |
|---|---|---|
| Comparison with Poisson distribution Blue bars denote a histogram of data divided into 1 sec bins. Red curve is a Poisson curve with rate = median count rate of data. |
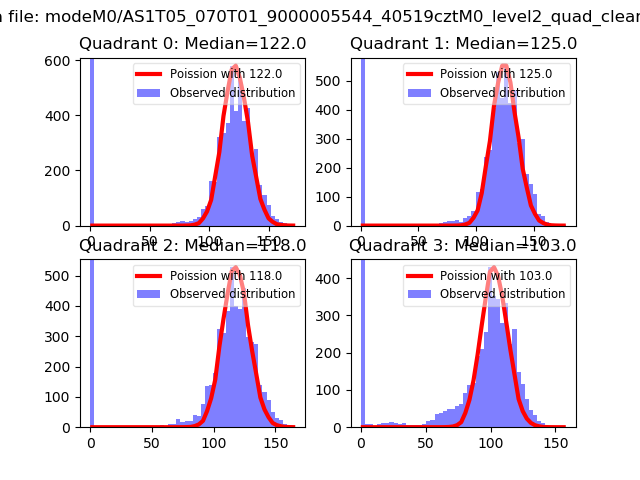 |
 |
| Quadrant-wise count rates Data is divided into 100 sec bins |
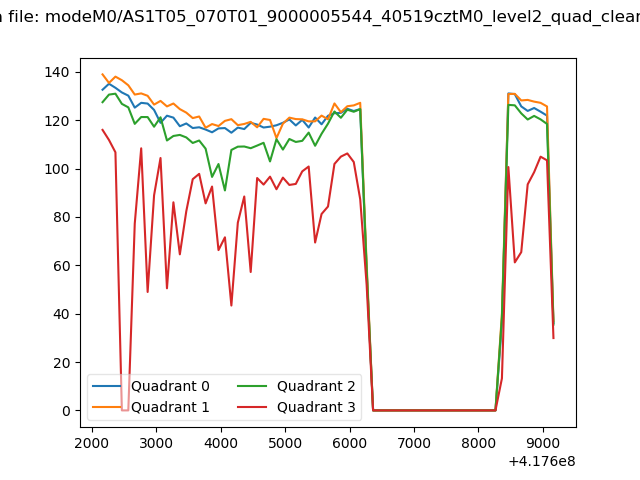 |
|
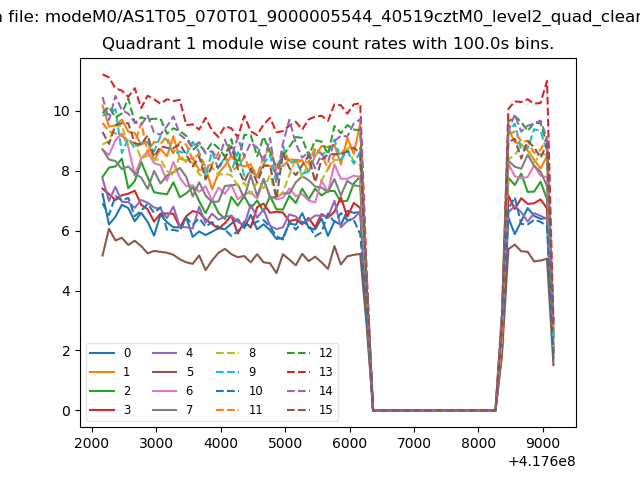
| Module-wise count rates for Quadrant A Data is divided into 100 sec bins |
 |
 |
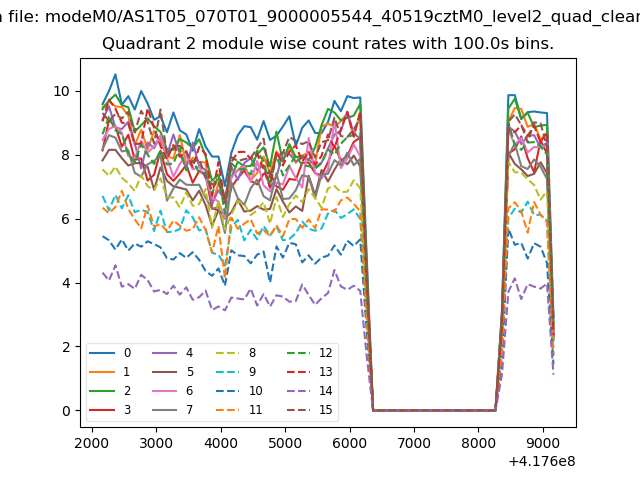
| Module-wise count rates for Quadrant B Data is divided into 100 sec bins |
 |
 |
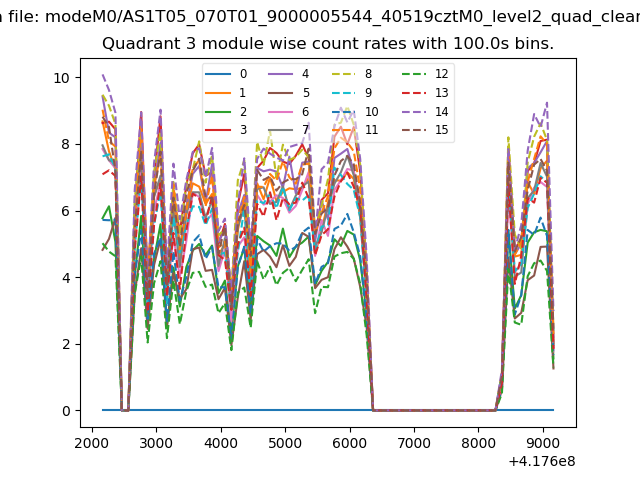
| Module-wise count rates for Quadrant C Data is divided into 100 sec bins |
 |
 |
| Module-wise count rates for Quadrant D Data is divided into 100 sec bins |
 |
 |
| Parameter | Plot |
|---|---|
| CZT HV Monitor | 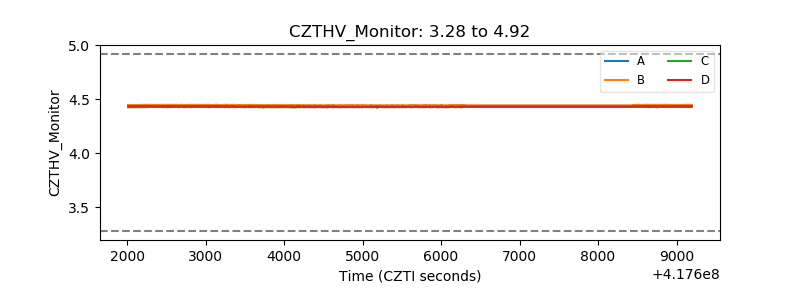 |
| D_VDD | 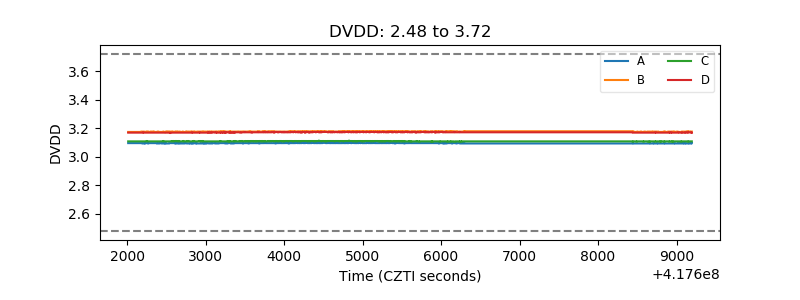 |
| Temperature 1 | 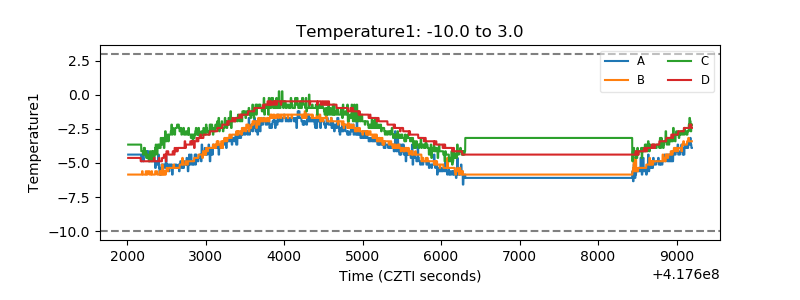 |
| Veto HV Monitor | 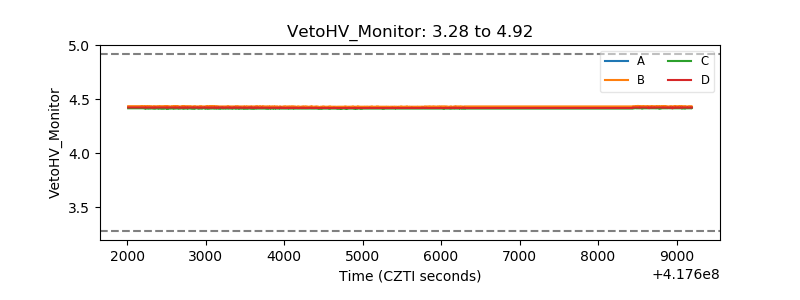 |
| Veto LLD | 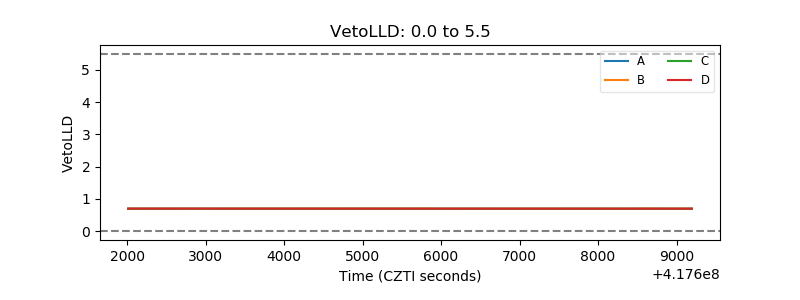 |
| Alpha Counter | 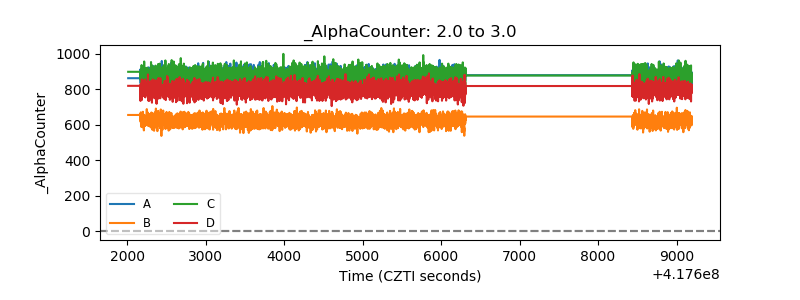 |
| _CPM_Rate | 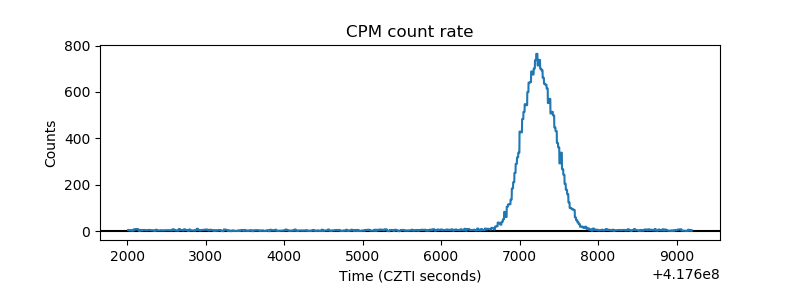 |
| CZT Counter | 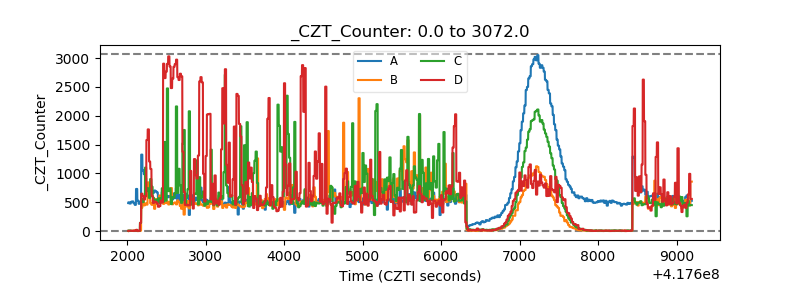 |
| +2.5 Volts monitor | 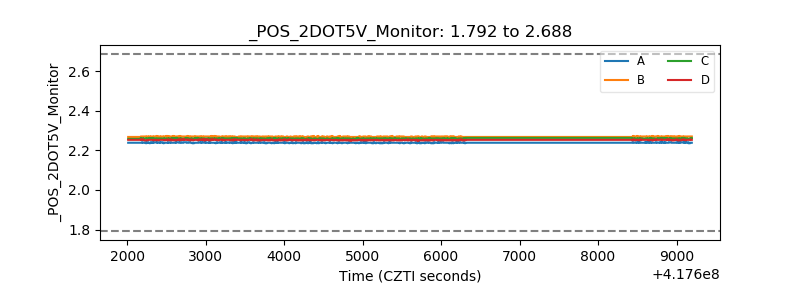 |
| +5 Volts monitor | 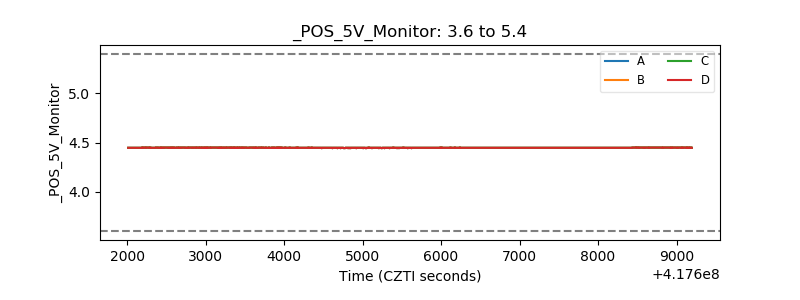 |
| _ROLL_ROT | 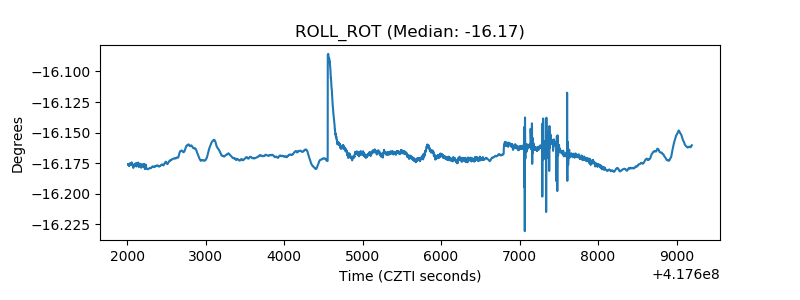 |
| _Roll_DEC | 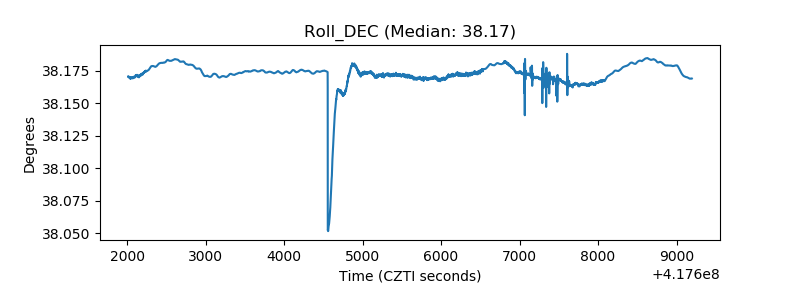 |
| _Roll_RA | 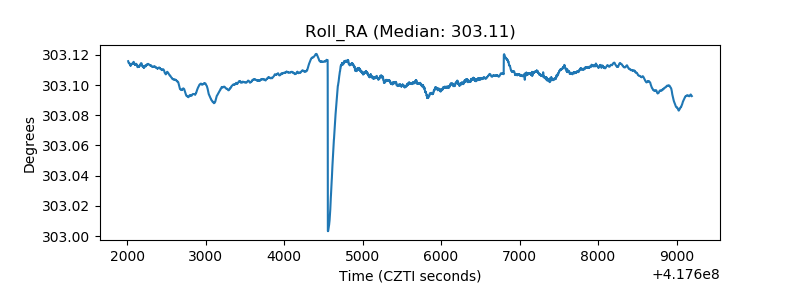 |
| Veto Counter | 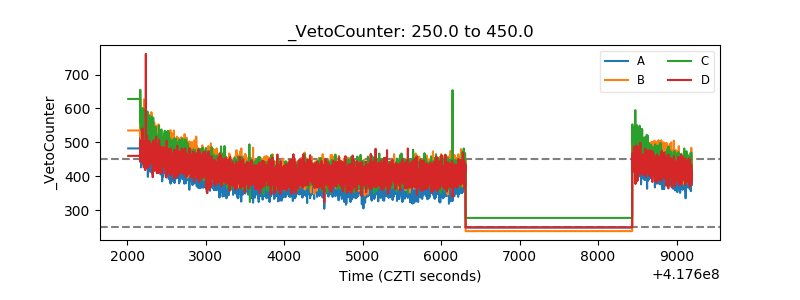 |