| Param | Original file | Final file |
|---|---|---|
| Filename | modeM0/AS1T05_070T01_9000005544_40521cztM0_level2.fits | modeM0/AS1T05_070T01_9000005544_40521cztM0_level2_quad_clean.evt |
| Size (bytes) | 289,163,520 | 82,644,480 |
| Size | 275.8 MB | 78.8 MB |
| Events in quadrant A | 2,724,390 | 565,723 |
| Events in quadrant B | 2,409,087 | 577,066 |
| Events in quadrant C | 2,416,413 | 547,877 |
| Events in quadrant D | 2,765,613 | 462,856 |
| Mode M0 | |||
|---|---|---|---|
| Quadrant | BADHDUFLAG | Total packets | Discarded packets |
| A | 0 | 10946 | 3 |
| B | 0 | 10347 | 2 |
| C | 0 | 10198 | 2 |
| D | 0 | 11543 | 2 |
| Mode M9 | |||
|---|---|---|---|
| Quadrant | BADHDUFLAG | Total packets | Discarded packets |
| A | 0 | 21 | 0 |
| B | 0 | 21 | 0 |
| C | 0 | 21 | 0 |
| D | 0 | 22 | 0 |
| Mode SS | |||
|---|---|---|---|
| Quadrant | BADHDUFLAG | Total packets | Discarded packets |
| A | 0 | 102 | 0 |
| B | 0 | 102 | 0 |
| C | 0 | 102 | 0 |
| D | 0 | 102 | 0 |
| Quadrant | Total seconds | Saturated seconds | Saturation percentage |
|---|---|---|---|
| A | 4971 | 13 | 0.261517% |
| B | 4971 | 14 | 0.281633% |
| C | 4971 | 11 | 0.221283% |
| D | 4971 | 497 | 9.997988% |
Noise dominated data is calculated using 1-second bins in cleaned event files. If a bin has >2000 counts, and if more than 50% of those come from <1% of pixels, then it is considered to be noise-dominated and hence unusable.
| Quadrant | # 1 sec bins | Bins with >0 counts | Bins with >2000 counts | High rate bins dominated by noise | Noise dominated (total time) | Noise dominated (detector-on time) | Marked lightcurve |
|---|---|---|---|---|---|---|---|
| A | 6944 | 4972 | 2 | 2 | 0.03% | 0.04% | 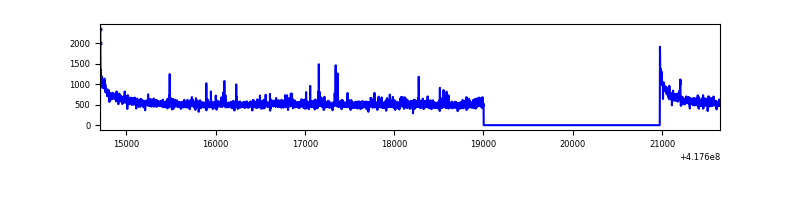 |
| B | 6944 | 4972 | 2 | 2 | 0.03% | 0.04% | 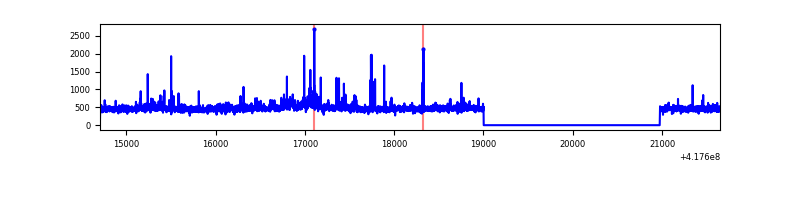 |
| C | 6944 | 4972 | 5 | 5 | 0.07% | 0.10% | 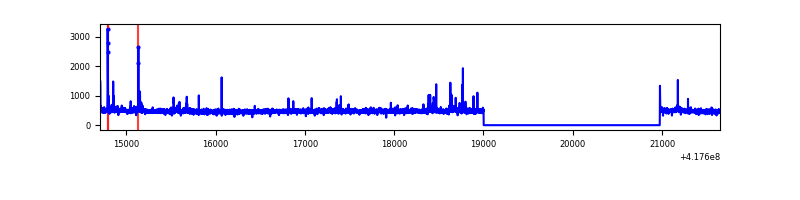 |
| D | 6944 | 4972 | 76 | 76 | 1.09% | 1.53% | 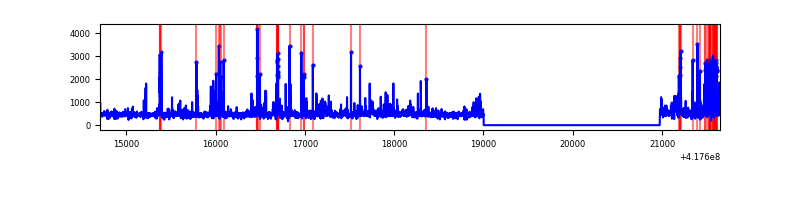 |
Top three noisy pixels from each quadrant. If the there are fewer than three noisy pixels in the level2.evt file, extra rows are filled as -1
| Pixel properties | Quadrant properties | ||||||
|---|---|---|---|---|---|---|---|
| Quadrant | DetID | PixID | Counts | Sigma | Mean | Median | Sigma |
| A | 10 | 83 | 498804 | 4340.86 | 556 | 545 | 114.8 |
| A | 2 | 79 | 35368 | 303.38 | 556 | 545 | 114.8 |
| A | 7 | 3 | 18357 | 155.18 | 556 | 545 | 114.8 |
| B | 3 | 112 | 86940 | 797.65 | 550 | 535 | 108.3 |
| B | 4 | 171 | 69188 | 633.77 | 550 | 535 | 108.3 |
| B | 5 | 32 | 37235 | 338.8 | 550 | 535 | 108.3 |
| C | 15 | 214 | 221867 | 1731.86 | 540 | 543 | 127.8 |
| C | 14 | 254 | 60648 | 470.32 | 540 | 543 | 127.8 |
| C | 10 | 20 | 9755 | 72.08 | 540 | 543 | 127.8 |
| D | 2 | 250 | 328748 | 2519.64 | 514 | 498 | 130.3 |
| D | 12 | 191 | 145530 | 1113.26 | 514 | 498 | 130.3 |
| D | 5 | 32 | 108129 | 826.17 | 514 | 498 | 130.3 |
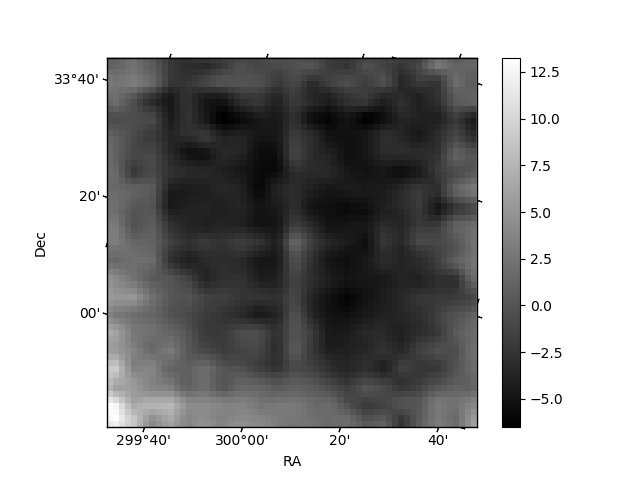
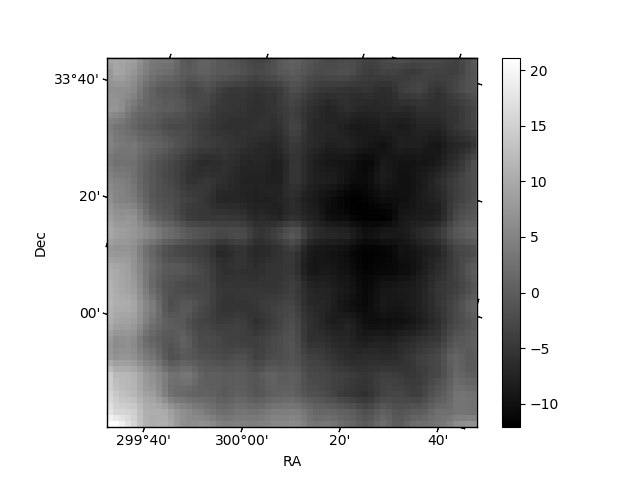
Histogram calculated using DETX and DETY for each event in the final _common_clean file
| Quadrant A | 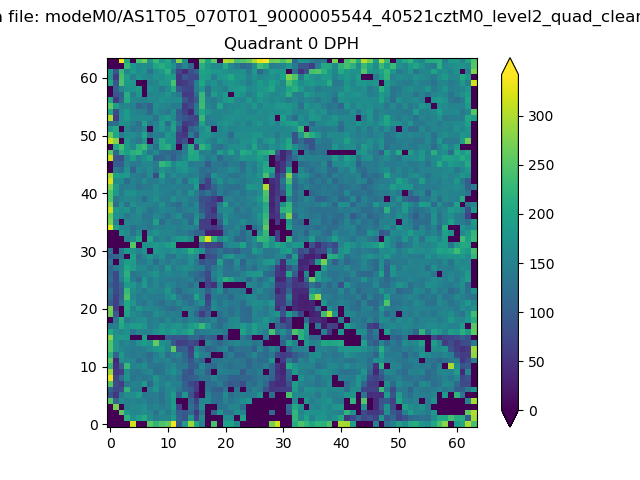 |
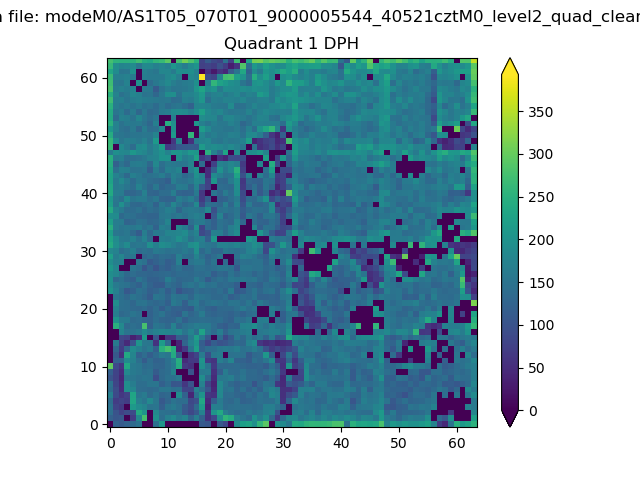 |
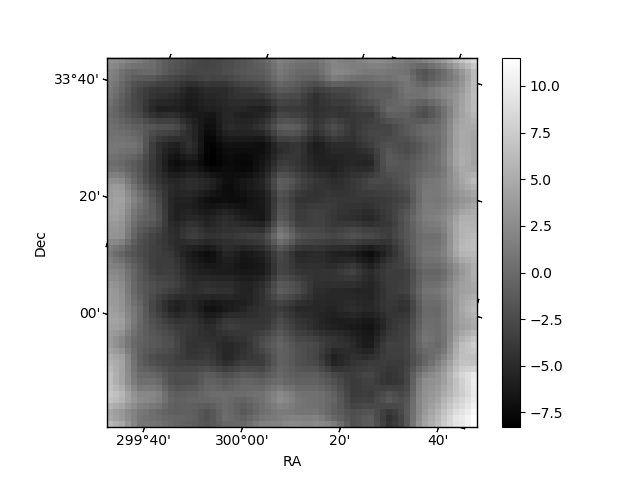
Quadrant B |
|---|---|---|---|
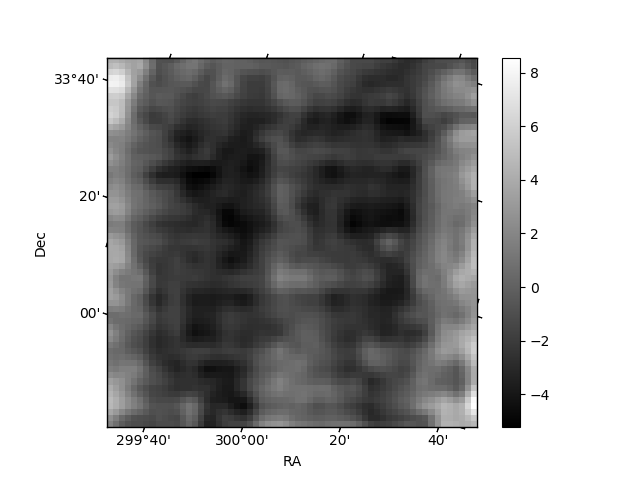
| Quadrant D | 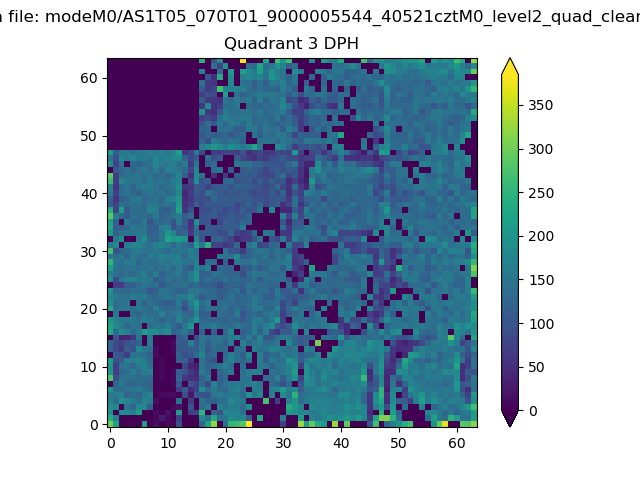 |
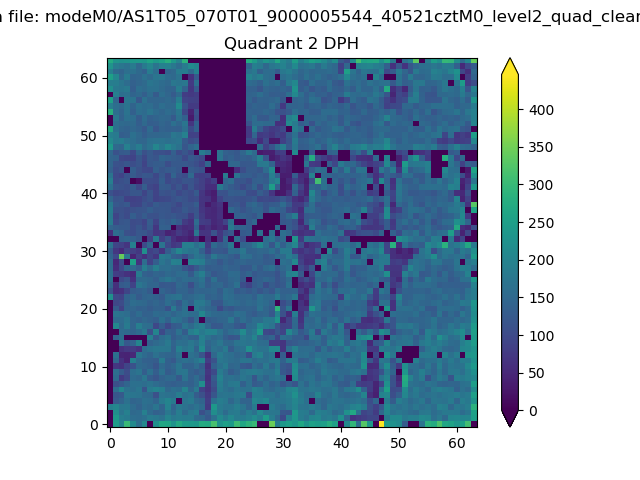 |
Quadrant C |
| Plot type | Count rate plots | Images |
|---|---|---|
| Comparison with Poisson distribution Blue bars denote a histogram of data divided into 1 sec bins. Red curve is a Poisson curve with rate = median count rate of data. |
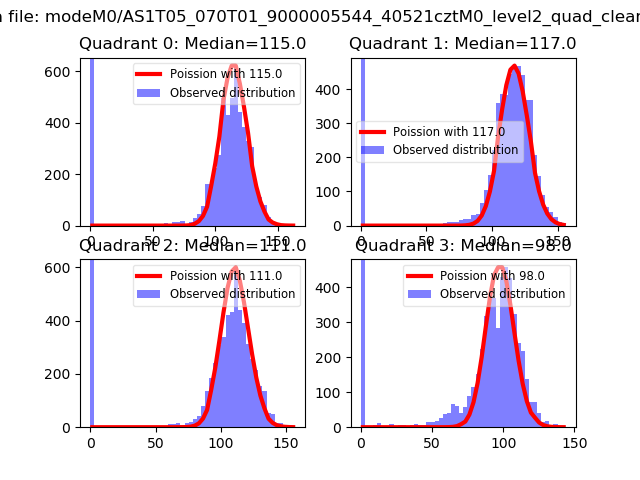 |
 |
| Quadrant-wise count rates Data is divided into 100 sec bins |
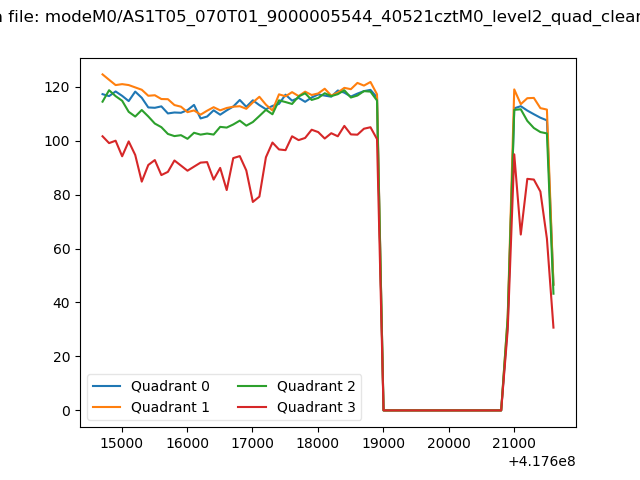 |
|
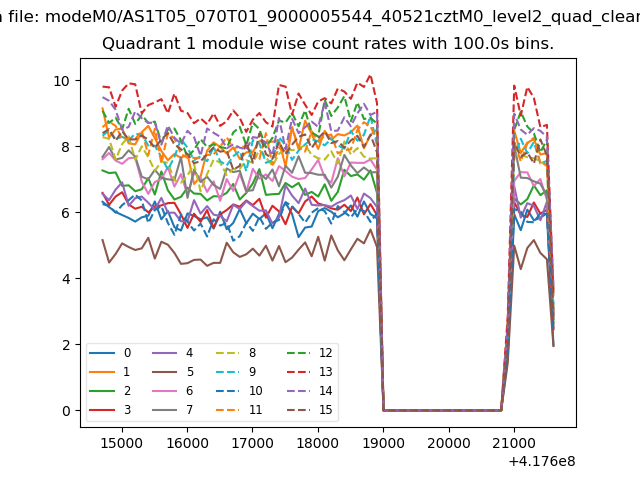
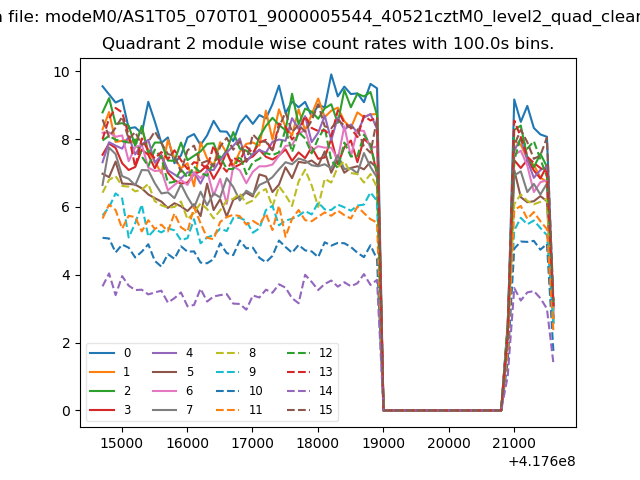
| Module-wise count rates for Quadrant A Data is divided into 100 sec bins |
 |
 |
| Module-wise count rates for Quadrant B Data is divided into 100 sec bins |
 |
 |
| Module-wise count rates for Quadrant C Data is divided into 100 sec bins |
 |
 |
| Module-wise count rates for Quadrant D Data is divided into 100 sec bins |
 |
 |
| Parameter | Plot |
|---|---|
| CZT HV Monitor | 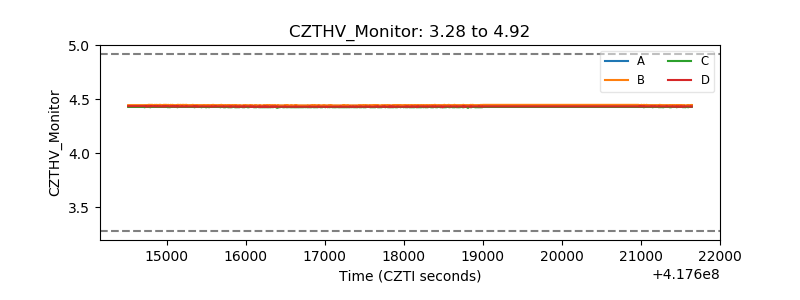 |
| D_VDD | 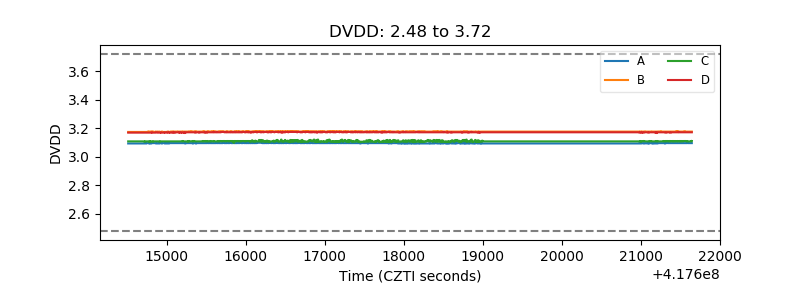 |
| Temperature 1 | 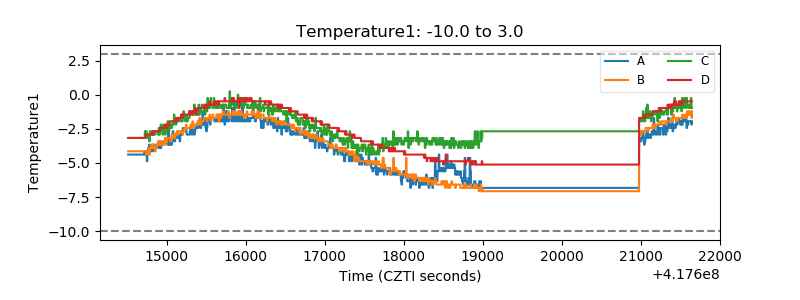 |
| Veto HV Monitor | 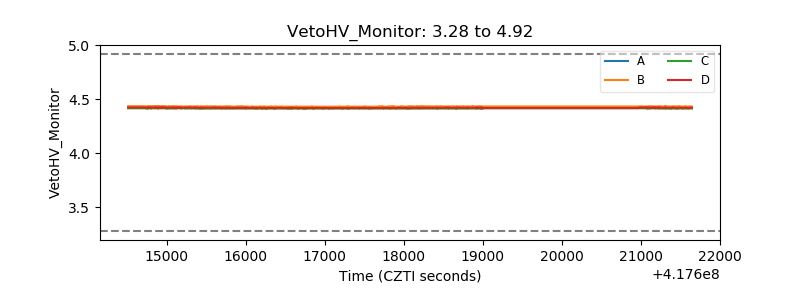 |
| Veto LLD | 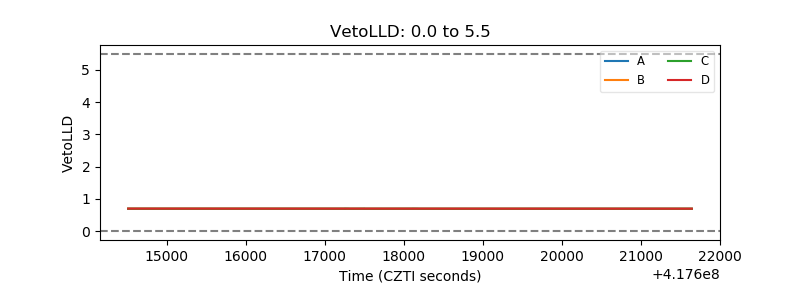 |
| Alpha Counter | 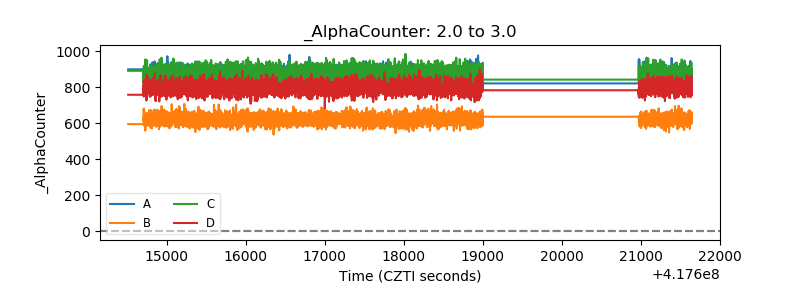 |
| _CPM_Rate | 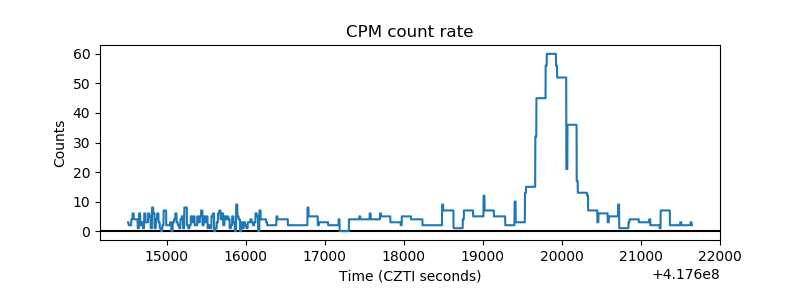 |
| CZT Counter | 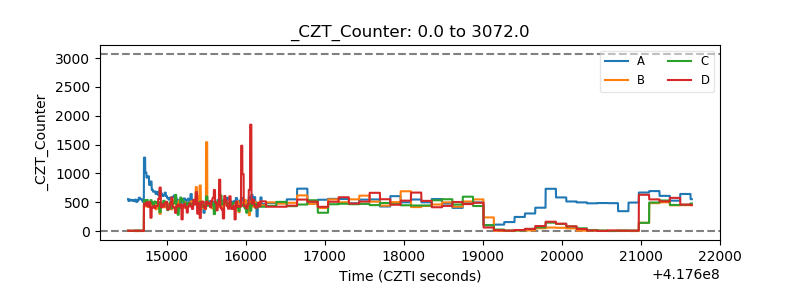 |
| +2.5 Volts monitor | 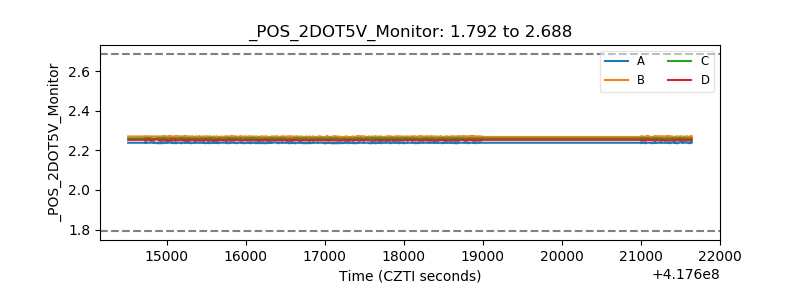 |
| +5 Volts monitor | 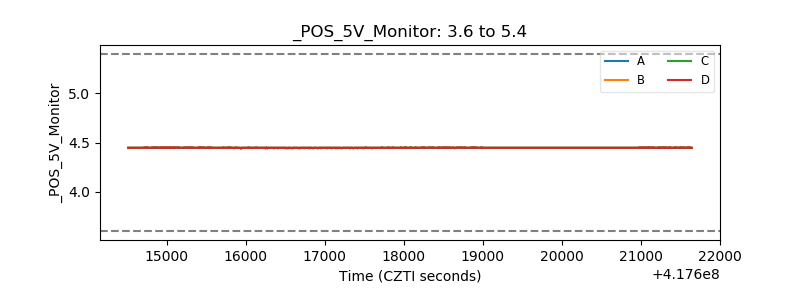 |
| _ROLL_ROT | 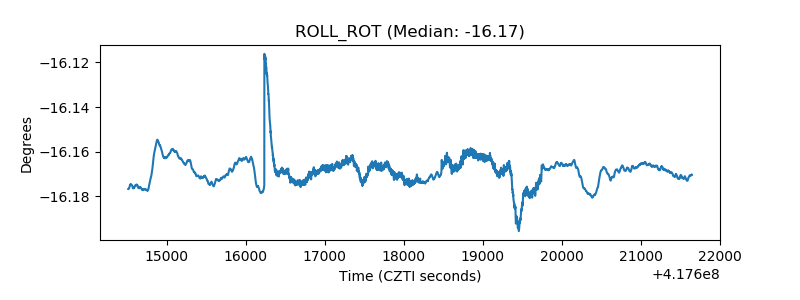 |
| _Roll_DEC | 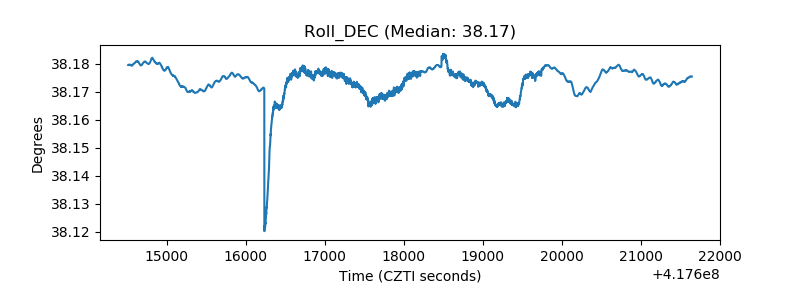 |
| _Roll_RA | 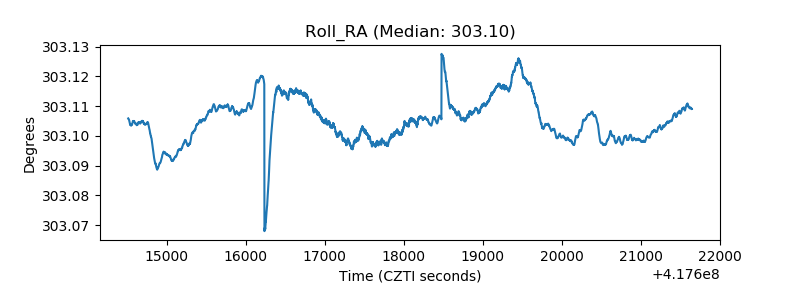 |
| Veto Counter | 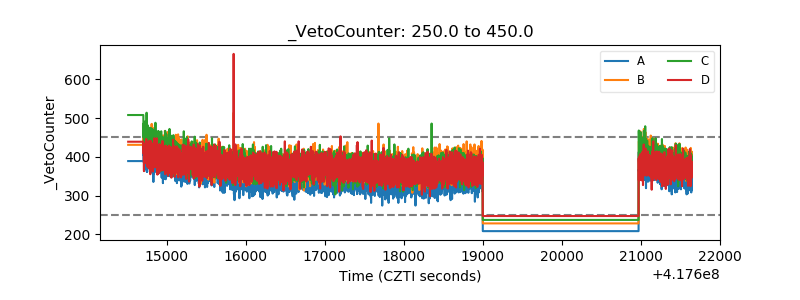 |