| Param | Original file | Final file |
|---|---|---|
| Filename | modeM0/AS1T05_070T01_9000005544_40522cztM0_level2.fits | modeM0/AS1T05_070T01_9000005544_40522cztM0_level2_quad_clean.evt |
| Size (bytes) | 321,050,880 | 87,393,600 |
| Size | 306.2 MB | 83.3 MB |
| Events in quadrant A | 2,897,587 | 598,605 |
| Events in quadrant B | 2,754,485 | 605,439 |
| Events in quadrant C | 2,552,191 | 584,669 |
| Events in quadrant D | 3,258,197 | 478,941 |
| Mode M0 | |||
|---|---|---|---|
| Quadrant | BADHDUFLAG | Total packets | Discarded packets |
| A | 0 | 11840 | 3 |
| B | 0 | 11804 | 2 |
| C | 0 | 10969 | 2 |
| D | 0 | 13385 | 2 |
| Mode M9 | |||
|---|---|---|---|
| Quadrant | BADHDUFLAG | Total packets | Discarded packets |
| A | 0 | 27 | 0 |
| B | 0 | 27 | 0 |
| C | 0 | 27 | 0 |
| D | 0 | 28 | 0 |
| Mode SS | |||
|---|---|---|---|
| Quadrant | BADHDUFLAG | Total packets | Discarded packets |
| A | 0 | 110 | 0 |
| B | 0 | 110 | 0 |
| C | 0 | 110 | 0 |
| D | 0 | 110 | 0 |
| Quadrant | Total seconds | Saturated seconds | Saturation percentage |
|---|---|---|---|
| A | 5404 | 15 | 0.277572% |
| B | 5404 | 65 | 1.202813% |
| C | 5404 | 9 | 0.166543% |
| D | 5404 | 740 | 13.693560% |
Noise dominated data is calculated using 1-second bins in cleaned event files. If a bin has >2000 counts, and if more than 50% of those come from <1% of pixels, then it is considered to be noise-dominated and hence unusable.
| Quadrant | # 1 sec bins | Bins with >0 counts | Bins with >2000 counts | High rate bins dominated by noise | Noise dominated (total time) | Noise dominated (detector-on time) | Marked lightcurve |
|---|---|---|---|---|---|---|---|
| A | 7047 | 5405 | 4 | 4 | 0.06% | 0.07% | 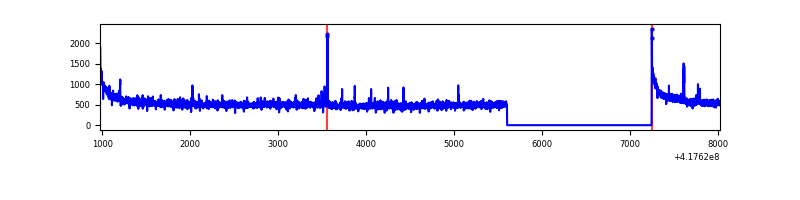 |
| B | 7047 | 5405 | 49 | 49 | 0.70% | 0.91% | 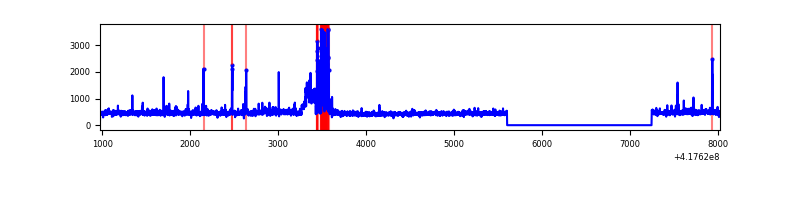 |
| C | 7047 | 5405 | 2 | 2 | 0.03% | 0.04% | 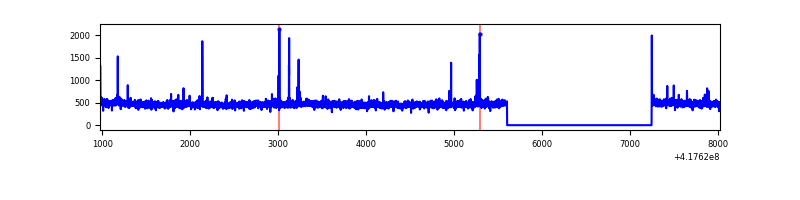 |
| D | 7047 | 5405 | 120 | 120 | 1.70% | 2.22% | 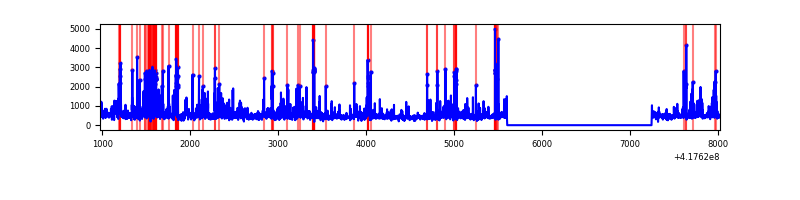 |
Top three noisy pixels from each quadrant. If the there are fewer than three noisy pixels in the level2.evt file, extra rows are filled as -1
| Pixel properties | Quadrant properties | ||||||
|---|---|---|---|---|---|---|---|
| Quadrant | DetID | PixID | Counts | Sigma | Mean | Median | Sigma |
| A | 10 | 83 | 523088 | 4235.62 | 595 | 583 | 123.4 |
| A | 2 | 79 | 32169 | 256.05 | 595 | 583 | 123.4 |
| A | 12 | 189 | 18461 | 144.93 | 595 | 583 | 123.4 |
| B | 5 | 32 | 209810 | 1814.14 | 589 | 572 | 115.3 |
| B | 4 | 81 | 77766 | 669.29 | 589 | 572 | 115.3 |
| B | 3 | 112 | 46206 | 395.66 | 589 | 572 | 115.3 |
| C | 15 | 214 | 235463 | 1717.28 | 580 | 583 | 136.8 |
| C | 14 | 254 | 17708 | 125.21 | 580 | 583 | 136.8 |
| C | 10 | 20 | 13844 | 96.96 | 580 | 583 | 136.8 |
| D | 2 | 250 | 511733 | 3748.75 | 538 | 521 | 136.4 |
| D | 12 | 191 | 179833 | 1314.91 | 538 | 521 | 136.4 |
| D | 12 | 227 | 159165 | 1163.35 | 538 | 521 | 136.4 |
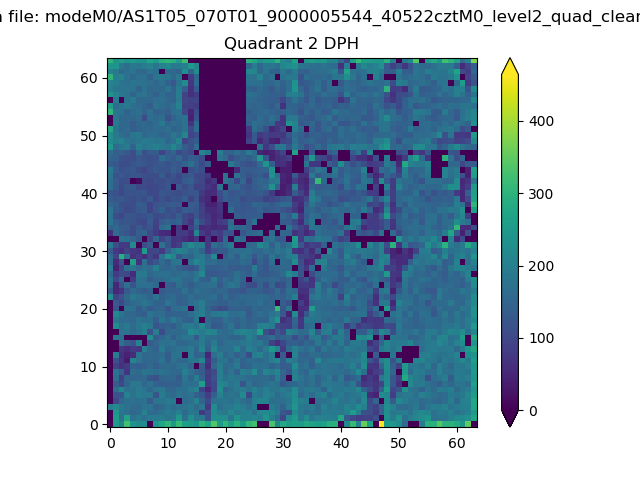
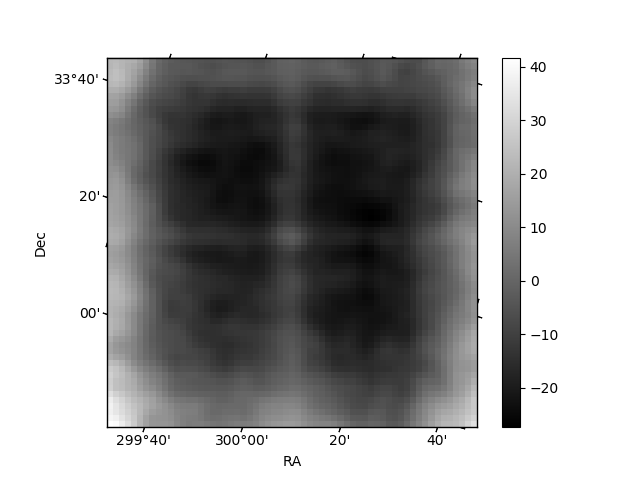
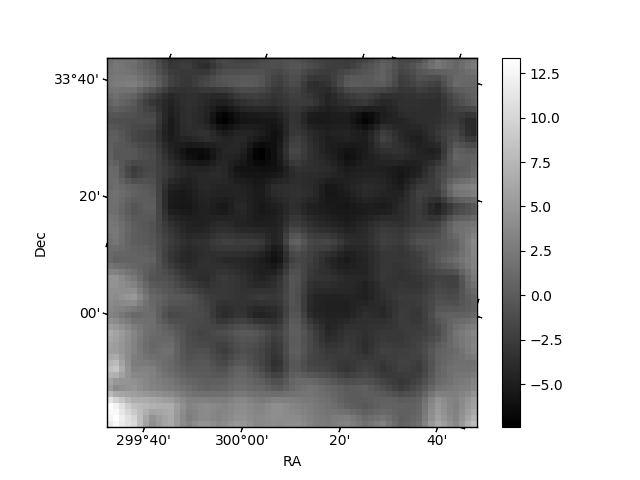
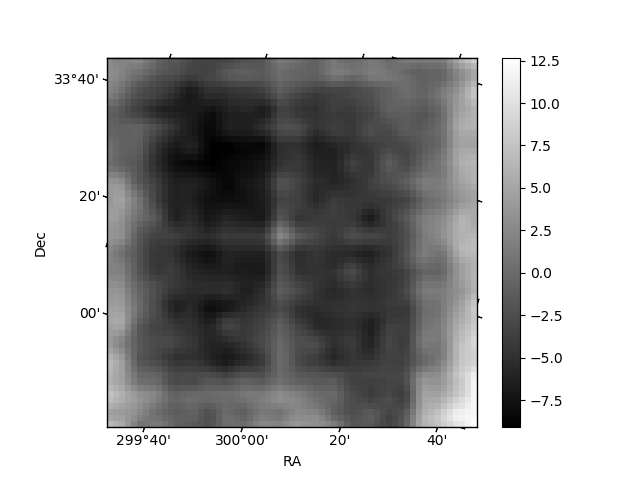
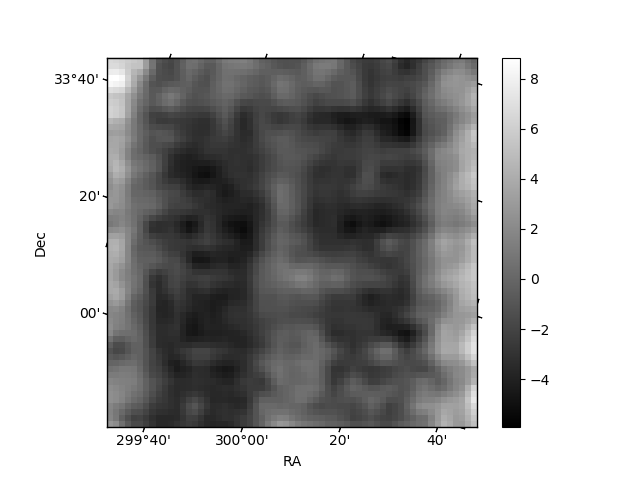
Histogram calculated using DETX and DETY for each event in the final _common_clean file
| Quadrant A | 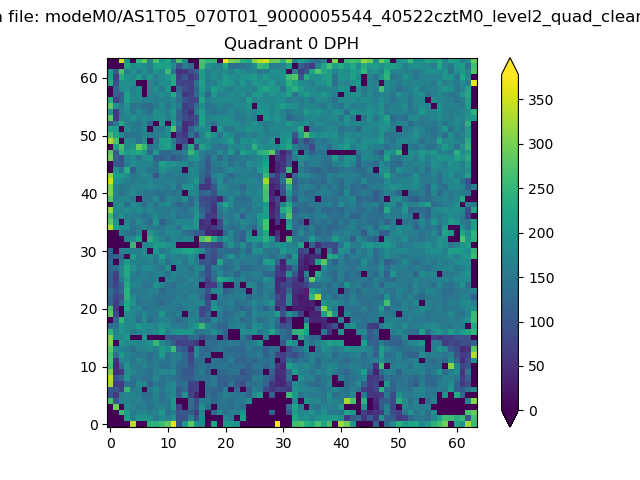 |
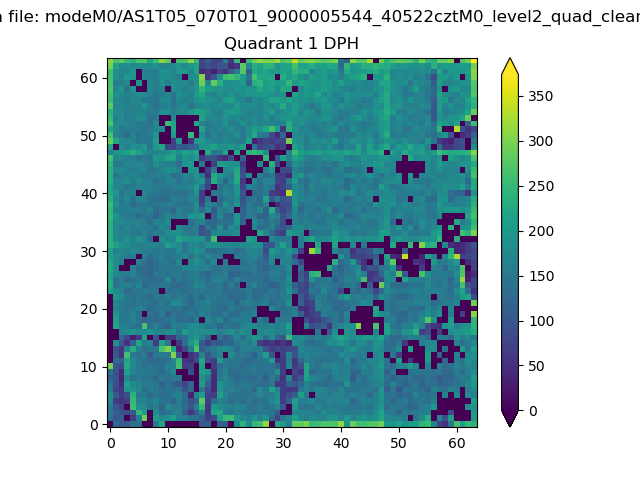 |
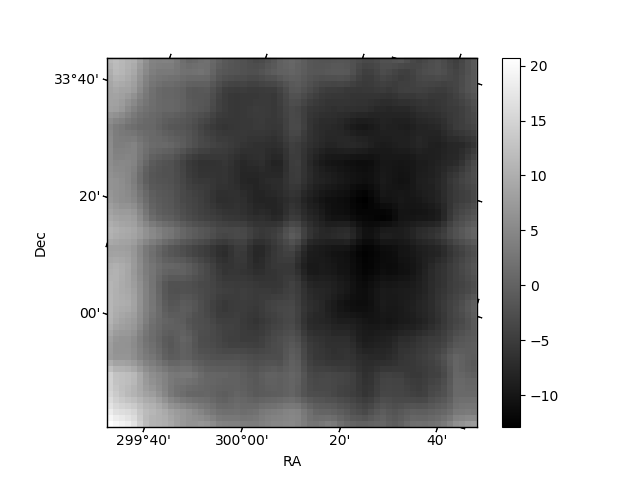
Quadrant B |
|---|---|---|---|
| Quadrant D | 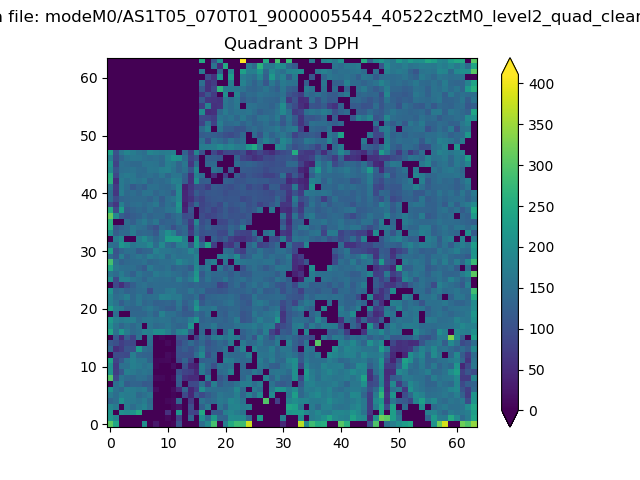 |
 |
Quadrant C |
| Plot type | Count rate plots | Images |
|---|---|---|
| Comparison with Poisson distribution Blue bars denote a histogram of data divided into 1 sec bins. Red curve is a Poisson curve with rate = median count rate of data. |
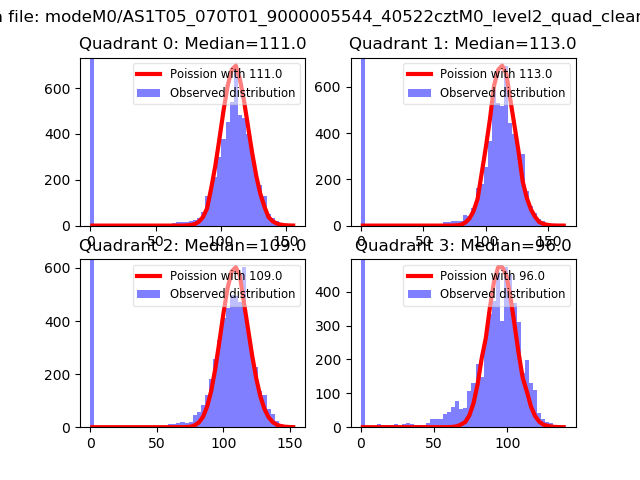 |
 |
| Quadrant-wise count rates Data is divided into 100 sec bins |
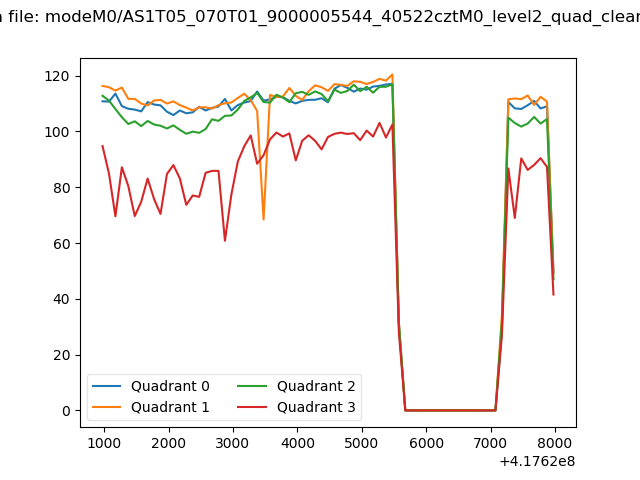 |
|
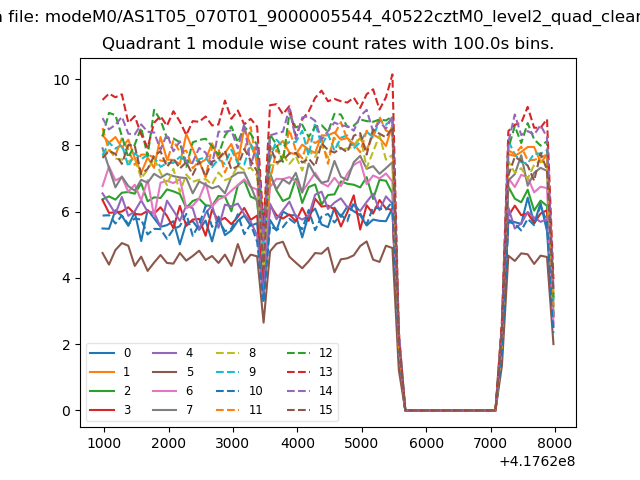
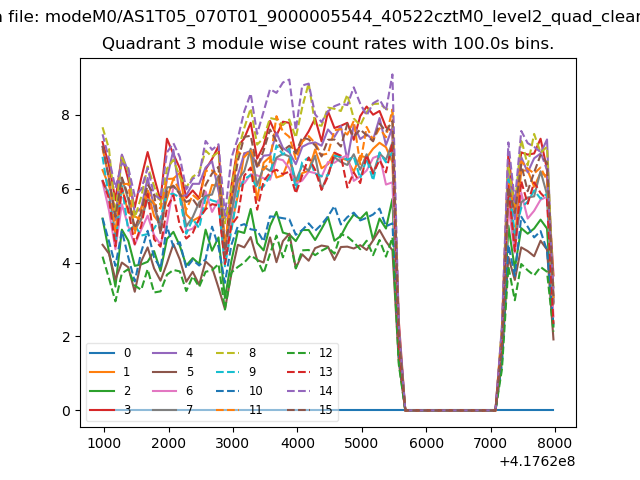
| Module-wise count rates for Quadrant A Data is divided into 100 sec bins |
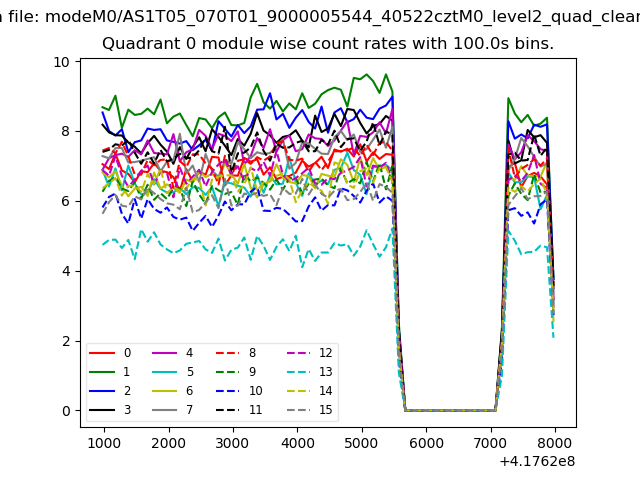 |
 |
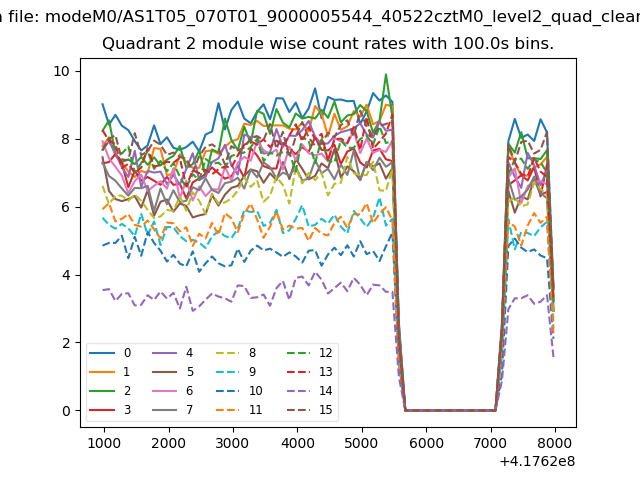
| Module-wise count rates for Quadrant B Data is divided into 100 sec bins |
 |
 |
| Module-wise count rates for Quadrant C Data is divided into 100 sec bins |
 |
 |
| Module-wise count rates for Quadrant D Data is divided into 100 sec bins |
 |
 |
| Parameter | Plot |
|---|---|
| CZT HV Monitor | 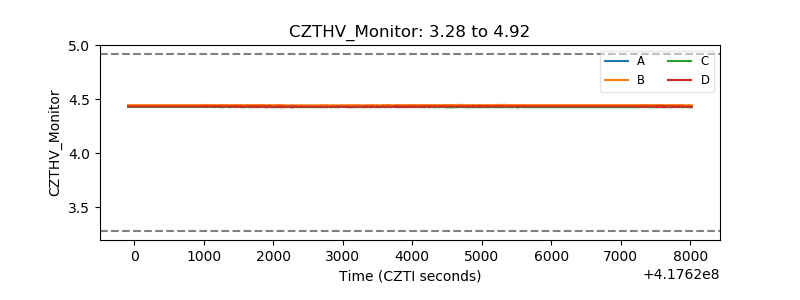 |
| D_VDD | 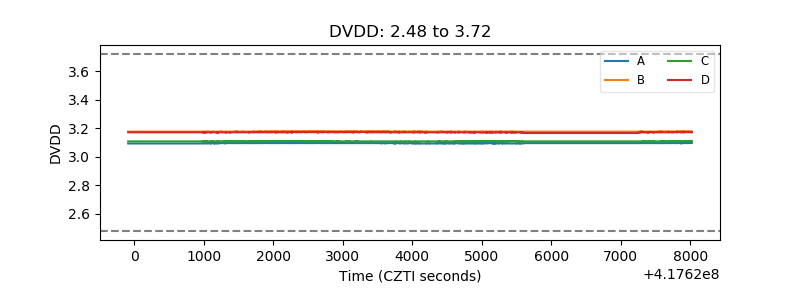 |
| Temperature 1 | 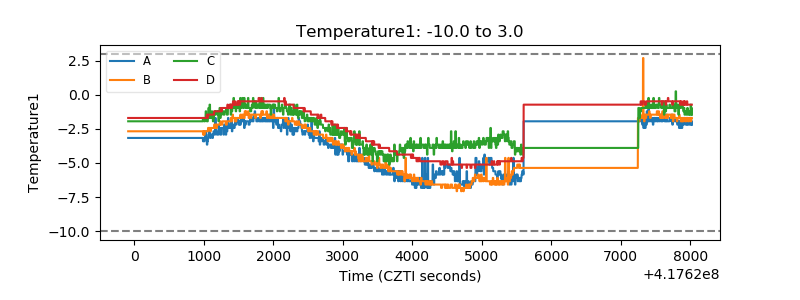 |
| Veto HV Monitor | 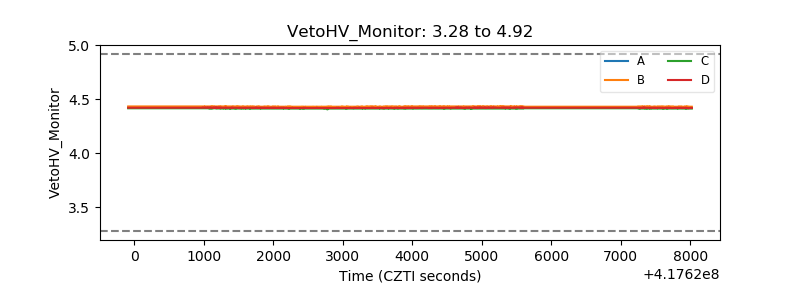 |
| Veto LLD | 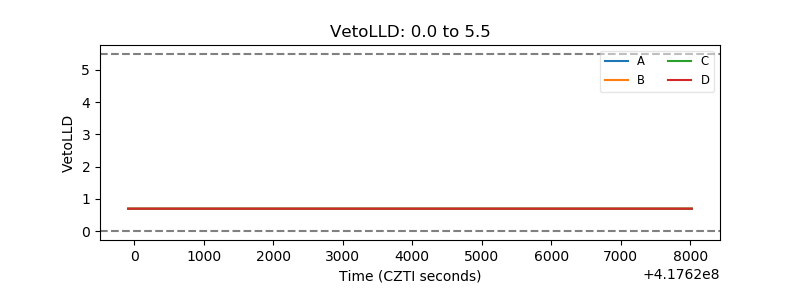 |
| Alpha Counter | 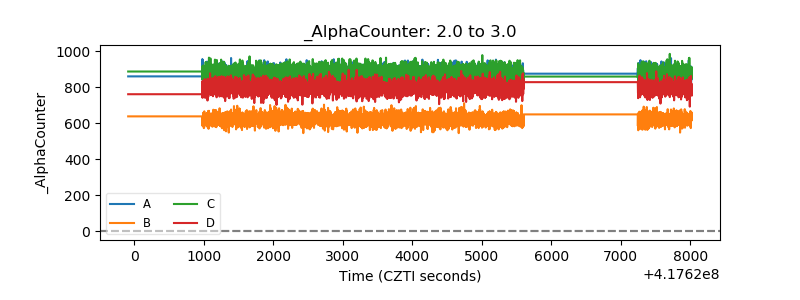 |
| _CPM_Rate | 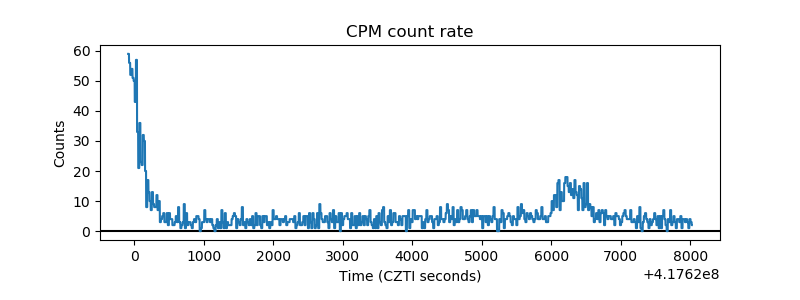 |
| CZT Counter | 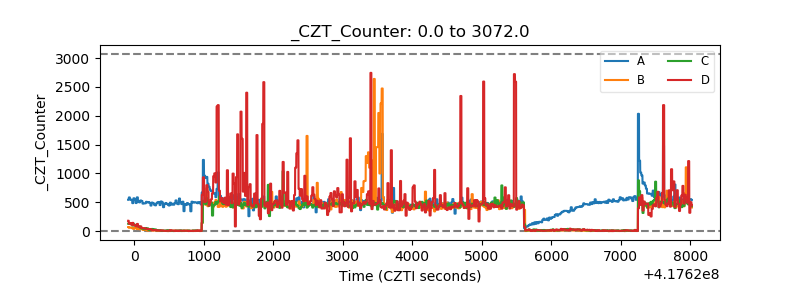 |
| +2.5 Volts monitor | 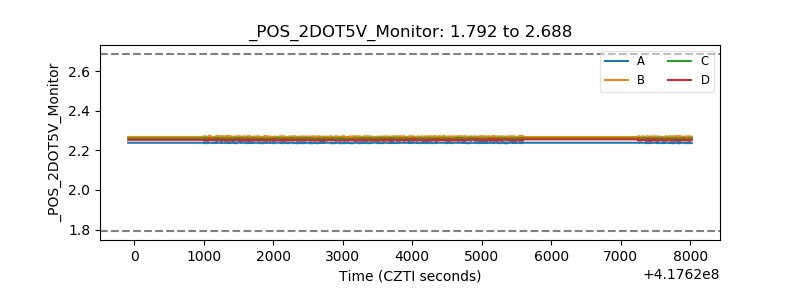 |
| +5 Volts monitor | 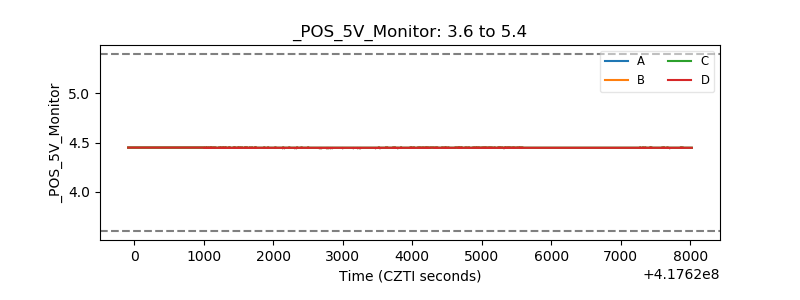 |
| _ROLL_ROT | 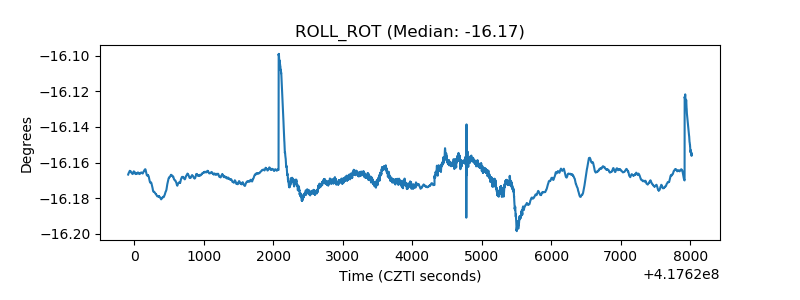 |
| _Roll_DEC | 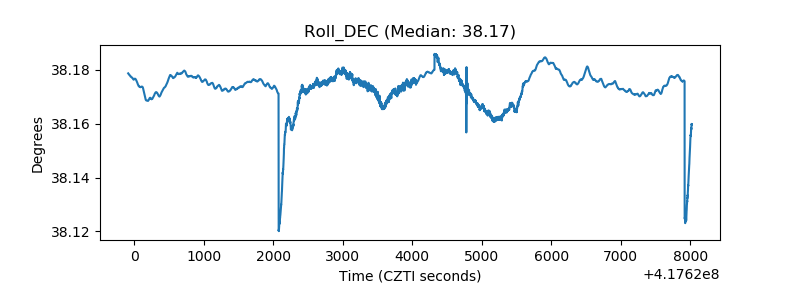 |
| _Roll_RA | 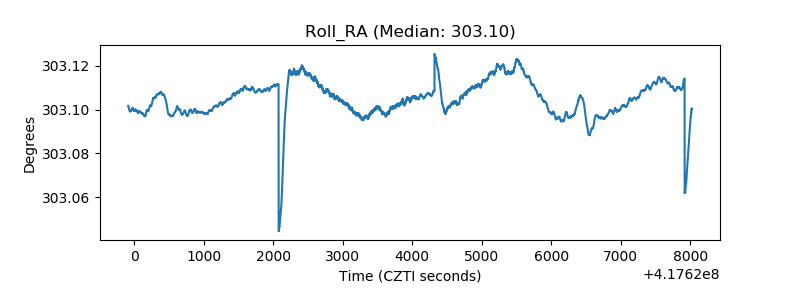 |
| Veto Counter | 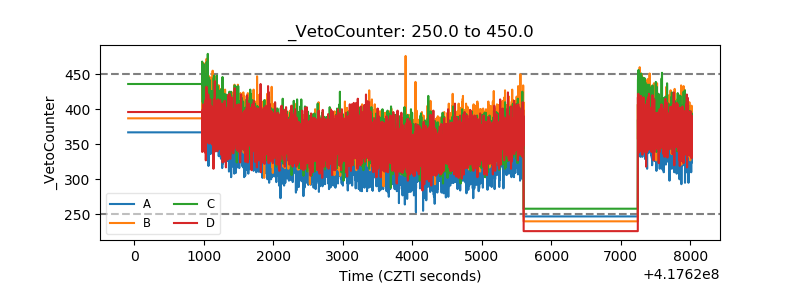 |