| Param | Original file | Final file |
|---|---|---|
| Filename | modeM0/AS1T05_070T01_9000005544_40523cztM0_level2.fits | modeM0/AS1T05_070T01_9000005544_40523cztM0_level2_quad_clean.evt |
| Size (bytes) | 352,733,760 | 94,622,400 |
| Size | 336.4 MB | 90.2 MB |
| Events in quadrant A | 3,111,701 | 651,956 |
| Events in quadrant B | 2,744,065 | 661,649 |
| Events in quadrant C | 2,749,035 | 632,965 |
| Events in quadrant D | 3,994,092 | 507,697 |
| Mode M0 | |||
|---|---|---|---|
| Quadrant | BADHDUFLAG | Total packets | Discarded packets |
| A | 0 | 12825 | 3 |
| B | 0 | 12154 | 2 |
| C | 0 | 11851 | 2 |
| D | 0 | 15791 | 2 |
| Mode M9 | |||
|---|---|---|---|
| Quadrant | BADHDUFLAG | Total packets | Discarded packets |
| A | 0 | 23 | 0 |
| B | 0 | 23 | 0 |
| C | 0 | 23 | 0 |
| D | 0 | 24 | 0 |
| Mode SS | |||
|---|---|---|---|
| Quadrant | BADHDUFLAG | Total packets | Discarded packets |
| A | 0 | 118 | 0 |
| B | 0 | 118 | 0 |
| C | 0 | 118 | 0 |
| D | 0 | 118 | 0 |
| Quadrant | Total seconds | Saturated seconds | Saturation percentage |
|---|---|---|---|
| A | 5873 | 17 | 0.289460% |
| B | 5873 | 25 | 0.425677% |
| C | 5873 | 4 | 0.068108% |
| D | 5873 | 836 | 14.234633% |
Noise dominated data is calculated using 1-second bins in cleaned event files. If a bin has >2000 counts, and if more than 50% of those come from <1% of pixels, then it is considered to be noise-dominated and hence unusable.
| Quadrant | # 1 sec bins | Bins with >0 counts | Bins with >2000 counts | High rate bins dominated by noise | Noise dominated (total time) | Noise dominated (detector-on time) | Marked lightcurve |
|---|---|---|---|---|---|---|---|
| A | 7246 | 5874 | 5 | 5 | 0.07% | 0.09% | 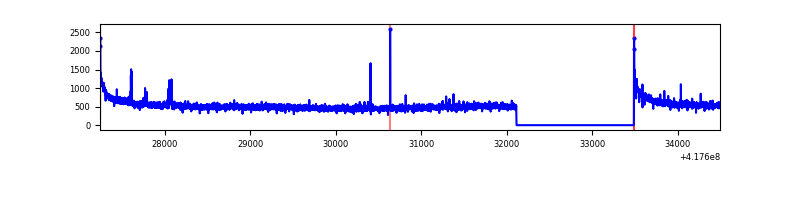 |
| B | 7246 | 5874 | 17 | 17 | 0.23% | 0.29% | 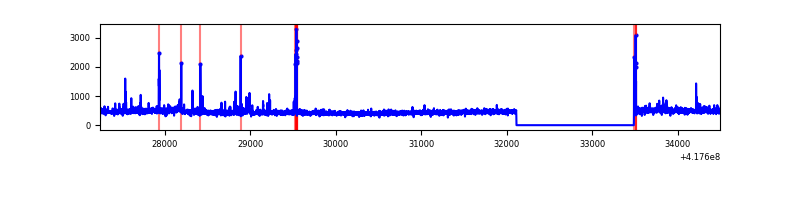 |
| C | 7246 | 5874 | 0 | 0 | 0.00% | 0.00% | 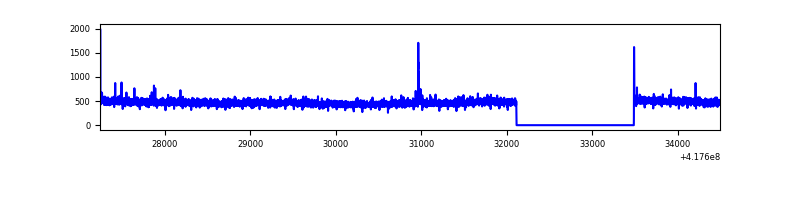 |
| D | 7246 | 5874 | 341 | 341 | 4.71% | 5.81% | 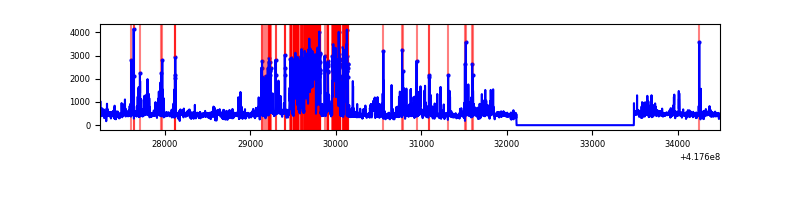 |
Top three noisy pixels from each quadrant. If the there are fewer than three noisy pixels in the level2.evt file, extra rows are filled as -1
| Pixel properties | Quadrant properties | ||||||
|---|---|---|---|---|---|---|---|
| Quadrant | DetID | PixID | Counts | Sigma | Mean | Median | Sigma |
| A | 10 | 83 | 556865 | 4149.56 | 646 | 631 | 134.0 |
| A | 2 | 79 | 14759 | 105.4 | 646 | 631 | 134.0 |
| A | 7 | 3 | 12832 | 91.02 | 646 | 631 | 134.0 |
| B | 5 | 32 | 66004 | 517.49 | 642 | 624 | 126.3 |
| B | 3 | 112 | 43902 | 342.55 | 642 | 624 | 126.3 |
| B | 0 | 230 | 42611 | 332.33 | 642 | 624 | 126.3 |
| C | 15 | 214 | 256458 | 1704.22 | 631 | 633 | 150.1 |
| C | 10 | 20 | 12287 | 77.63 | 631 | 633 | 150.1 |
| C | 0 | 10 | 9474 | 58.89 | 631 | 633 | 150.1 |
| D | 12 | 227 | 961313 | 6505.82 | 589 | 571 | 147.7 |
| D | 12 | 191 | 174219 | 1175.89 | 589 | 571 | 147.7 |
| D | 2 | 250 | 164823 | 1112.26 | 589 | 571 | 147.7 |
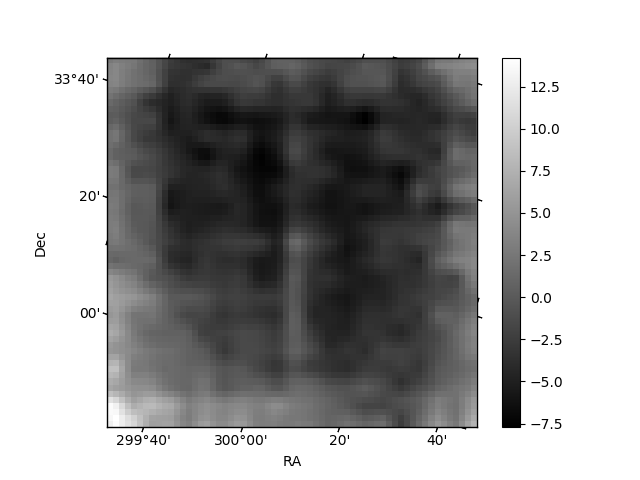
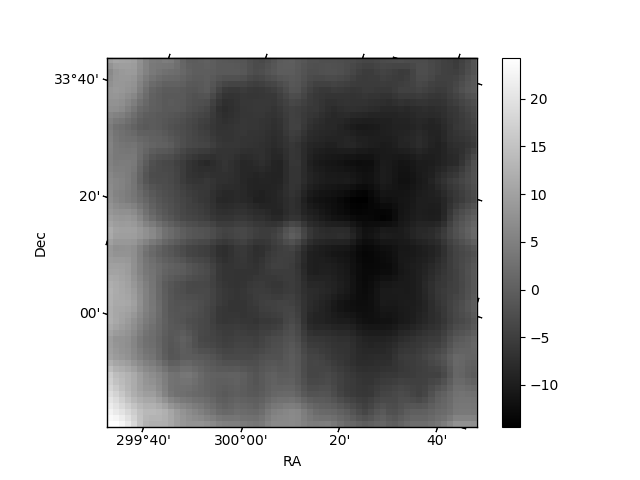
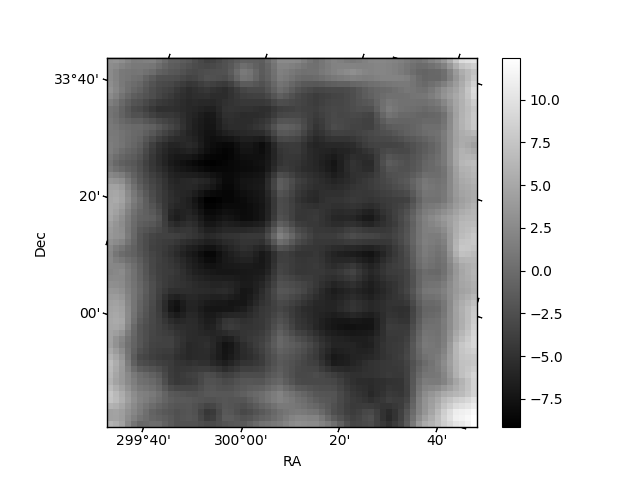
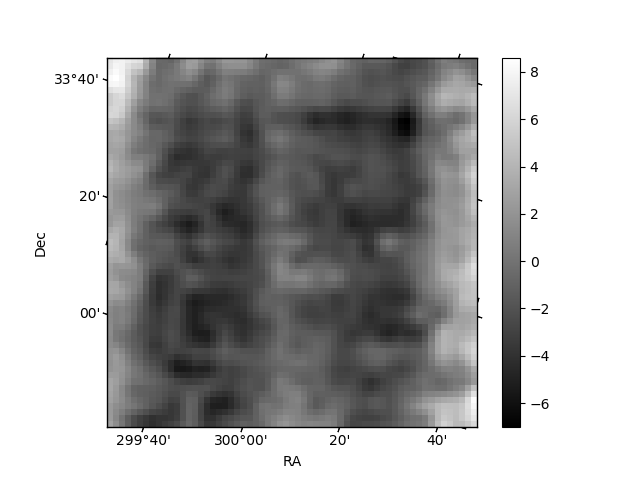
Histogram calculated using DETX and DETY for each event in the final _common_clean file
| Quadrant A | 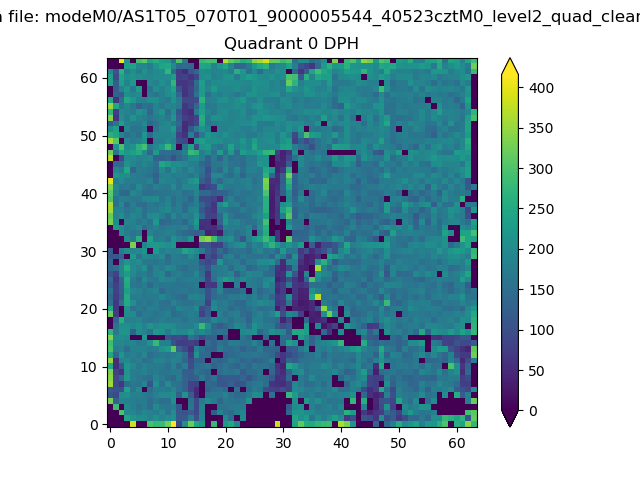 |
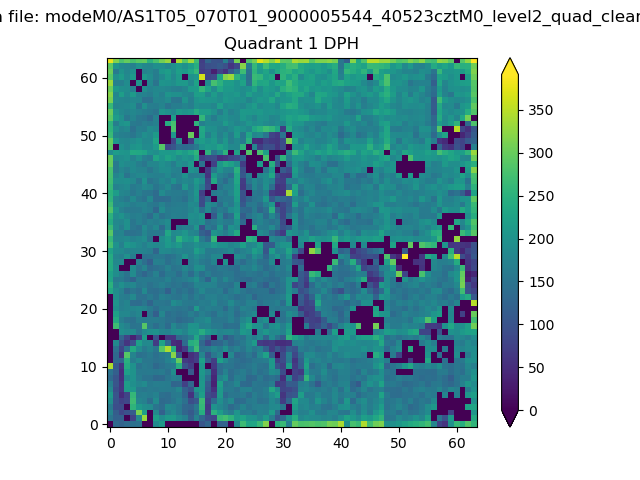 |
Quadrant B |
|---|---|---|---|
| Quadrant D | 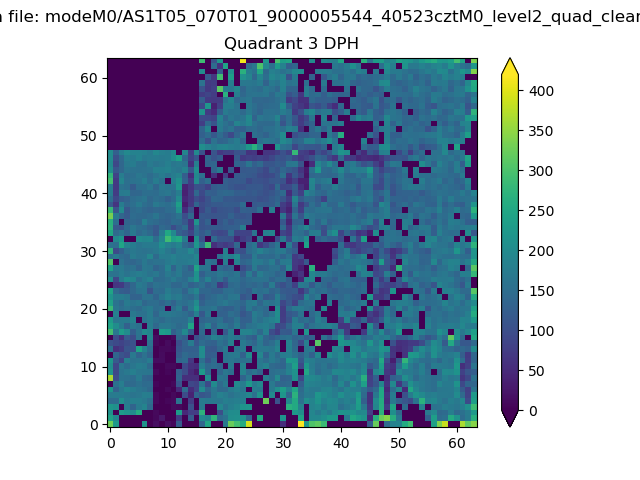 |
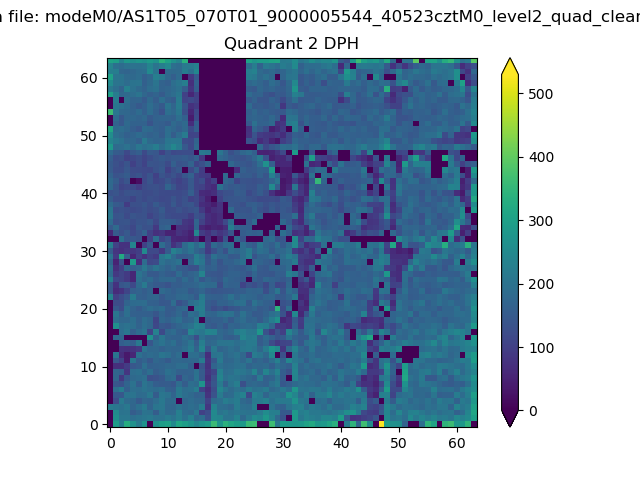 |
Quadrant C |
| Plot type | Count rate plots | Images |
|---|---|---|
| Comparison with Poisson distribution Blue bars denote a histogram of data divided into 1 sec bins. Red curve is a Poisson curve with rate = median count rate of data. |
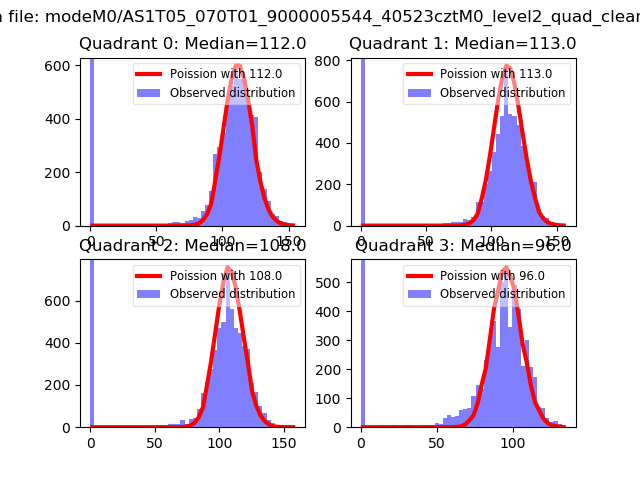 |
 |
| Quadrant-wise count rates Data is divided into 100 sec bins |
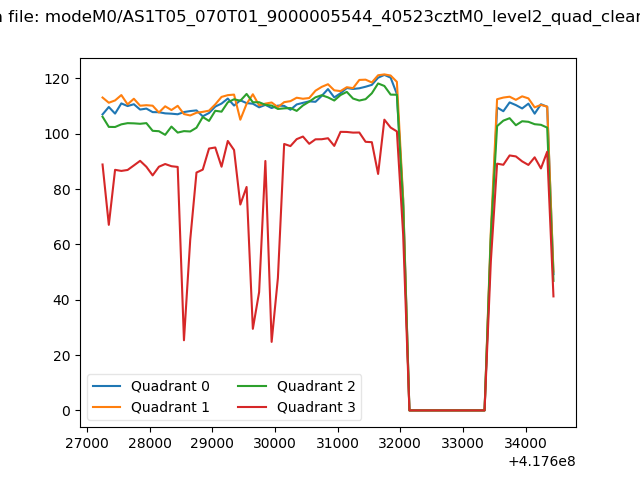 |
|
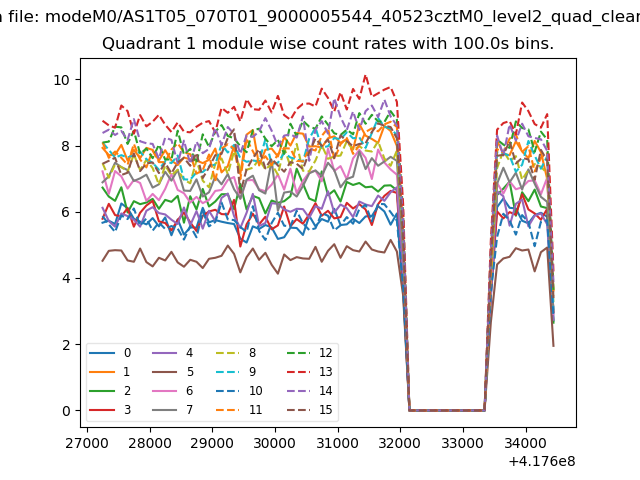
| Module-wise count rates for Quadrant A Data is divided into 100 sec bins |
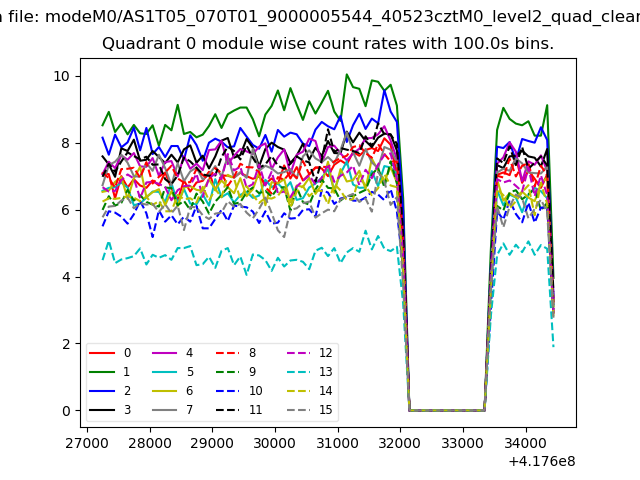 |
 |
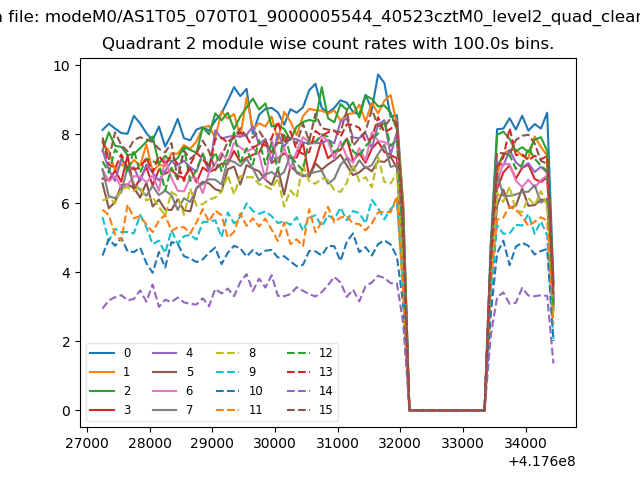
| Module-wise count rates for Quadrant B Data is divided into 100 sec bins |
 |
 |
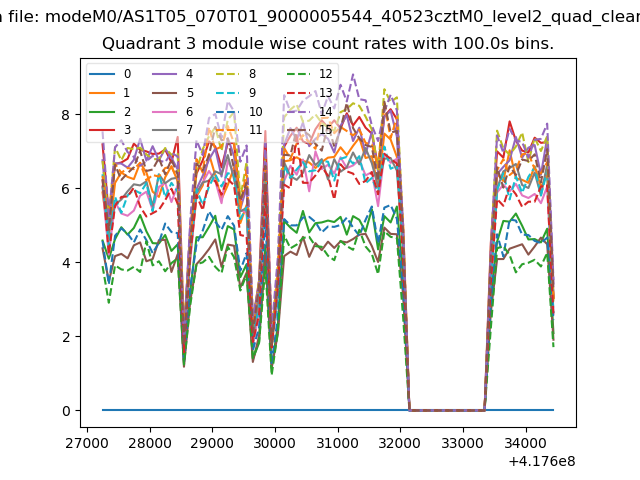
| Module-wise count rates for Quadrant C Data is divided into 100 sec bins |
 |
 |
| Module-wise count rates for Quadrant D Data is divided into 100 sec bins |
 |
 |
| Parameter | Plot |
|---|---|
| CZT HV Monitor | 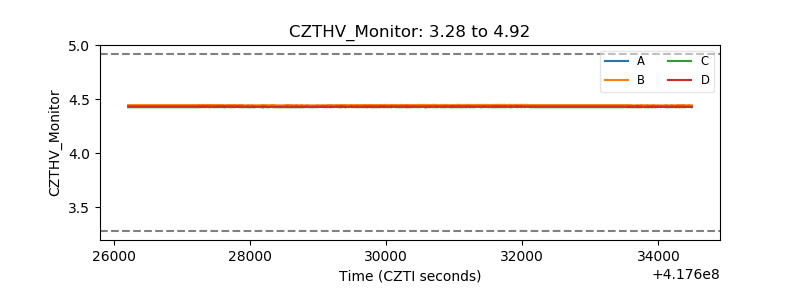 |
| D_VDD | 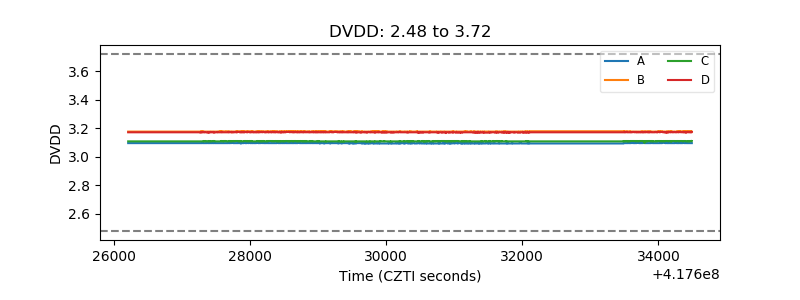 |
| Temperature 1 | 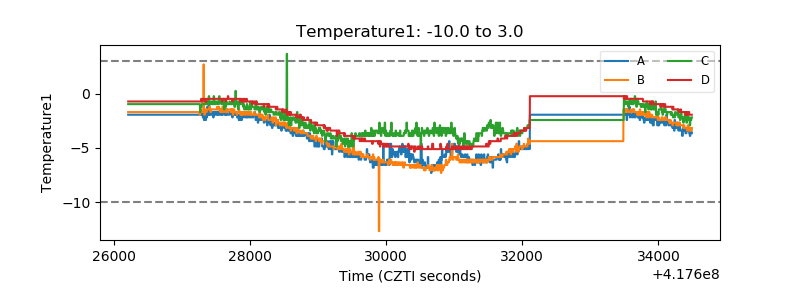 |
| Veto HV Monitor | 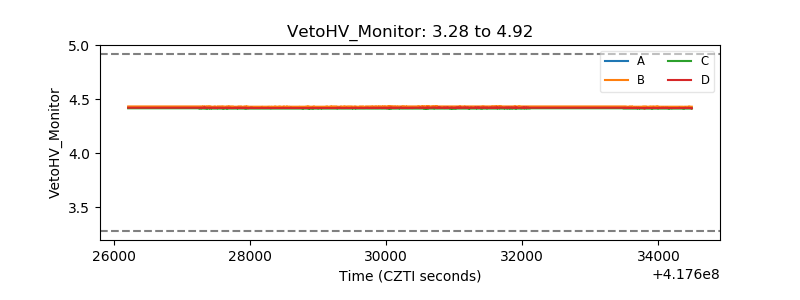 |
| Veto LLD | 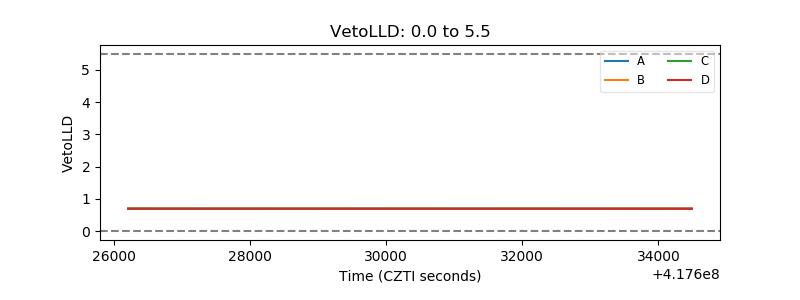 |
| Alpha Counter | 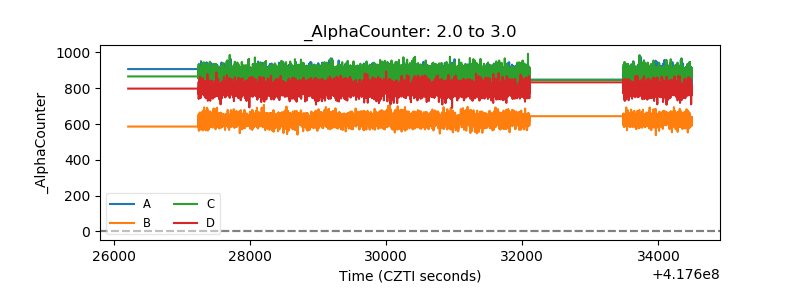 |
| _CPM_Rate | 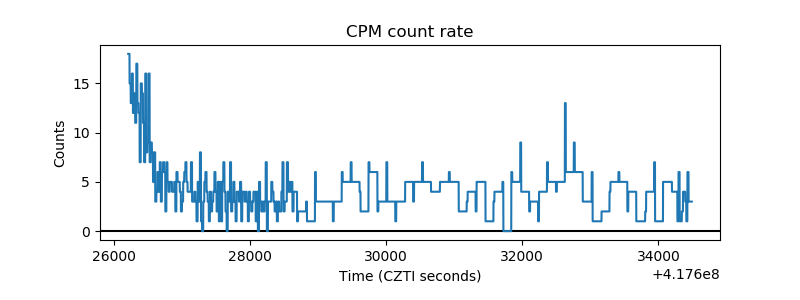 |
| CZT Counter | 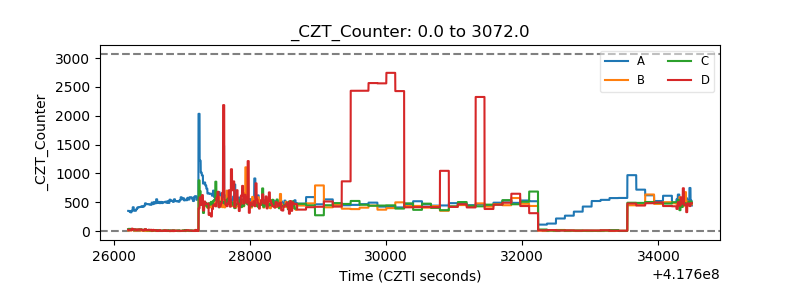 |
| +2.5 Volts monitor | 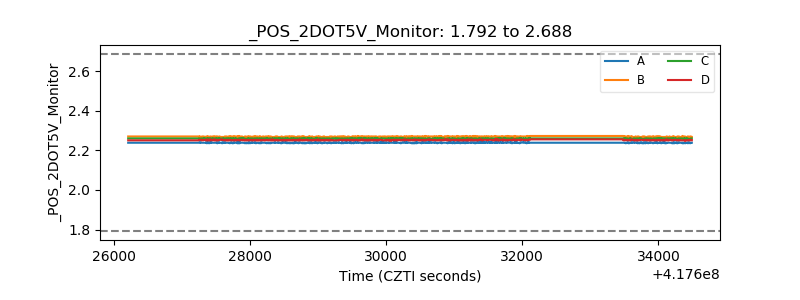 |
| +5 Volts monitor | 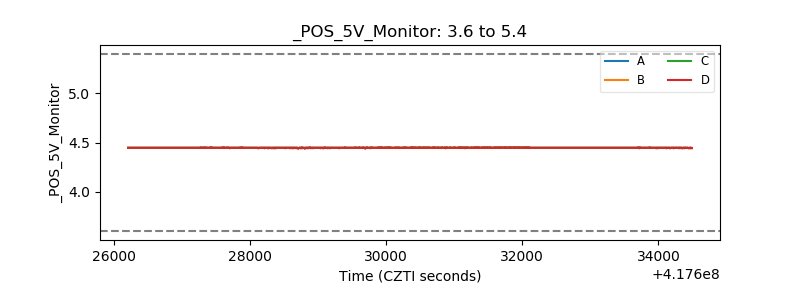 |
| _ROLL_ROT | 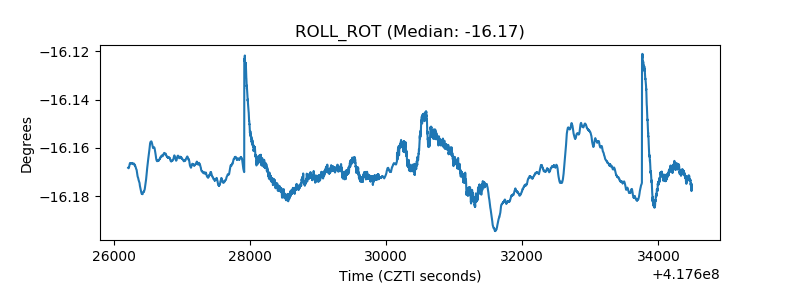 |
| _Roll_DEC | 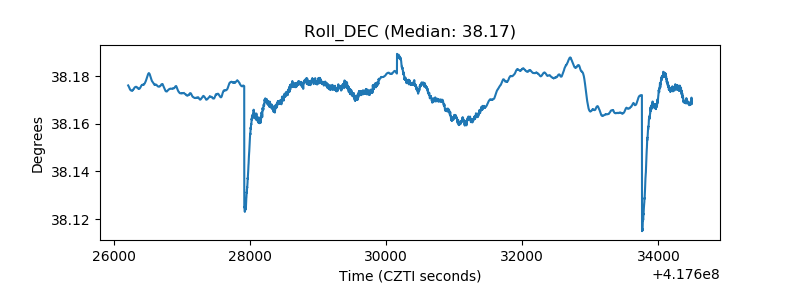 |
| _Roll_RA | 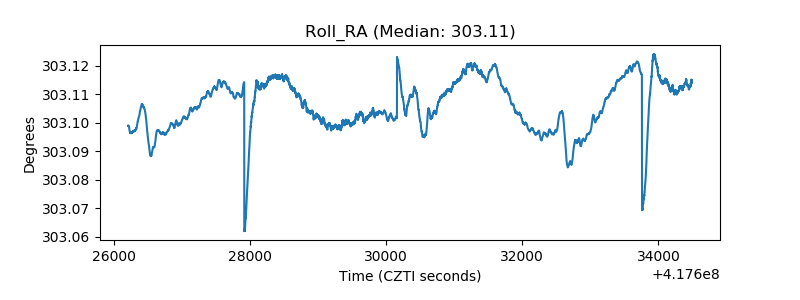 |
| Veto Counter | 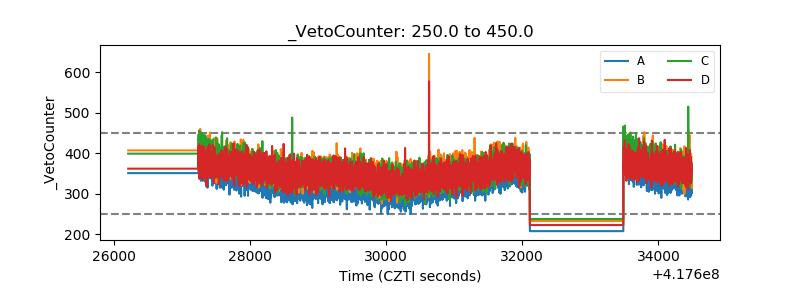 |