| Param | Original file | Final file |
|---|---|---|
| Filename | modeM0/AS1T05_070T01_9000005544_40532cztM0_level2.fits | modeM0/AS1T05_070T01_9000005544_40532cztM0_level2_quad_clean.evt |
| Size (bytes) | 331,868,160 | 91,203,840 |
| Size | 316.5 MB | 87.0 MB |
| Events in quadrant A | 2,990,018 | 634,449 |
| Events in quadrant B | 2,464,309 | 657,626 |
| Events in quadrant C | 2,813,628 | 618,456 |
| Events in quadrant D | 3,603,631 | 480,497 |
| Mode M0 | |||
|---|---|---|---|
| Quadrant | BADHDUFLAG | Total packets | Discarded packets |
| A | 0 | 11988 | 3 |
| B | 0 | 10842 | 2 |
| C | 0 | 11601 | 2 |
| D | 0 | 14242 | 2 |
| Mode M9 | |||
|---|---|---|---|
| Quadrant | BADHDUFLAG | Total packets | Discarded packets |
| A | 0 | 20 | 0 |
| B | 0 | 20 | 0 |
| C | 0 | 20 | 0 |
| D | 0 | 21 | 0 |
| Mode SS | |||
|---|---|---|---|
| Quadrant | BADHDUFLAG | Total packets | Discarded packets |
| A | 0 | 106 | 0 |
| B | 0 | 106 | 0 |
| C | 0 | 106 | 0 |
| D | 0 | 106 | 0 |
| Quadrant | Total seconds | Saturated seconds | Saturation percentage |
|---|---|---|---|
| A | 5292 | 12 | 0.226757% |
| B | 5292 | 19 | 0.359033% |
| C | 5292 | 48 | 0.907029% |
| D | 5292 | 927 | 17.517007% |
Noise dominated data is calculated using 1-second bins in cleaned event files. If a bin has >2000 counts, and if more than 50% of those come from <1% of pixels, then it is considered to be noise-dominated and hence unusable.
| Quadrant | # 1 sec bins | Bins with >0 counts | Bins with >2000 counts | High rate bins dominated by noise | Noise dominated (total time) | Noise dominated (detector-on time) | Marked lightcurve |
|---|---|---|---|---|---|---|---|
| A | 7295 | 5293 | 3 | 3 | 0.04% | 0.06% | 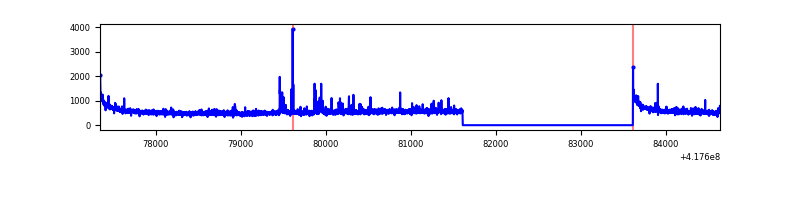 |
| B | 7295 | 5293 | 6 | 6 | 0.08% | 0.11% | 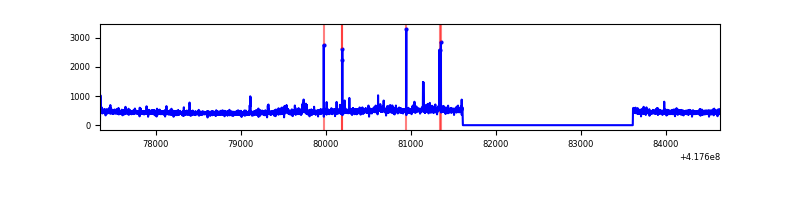 |
| C | 7295 | 5293 | 41 | 41 | 0.56% | 0.77% | 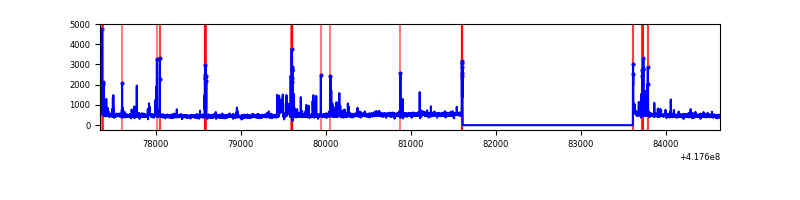 |
| D | 7295 | 5293 | 293 | 293 | 4.02% | 5.54% | 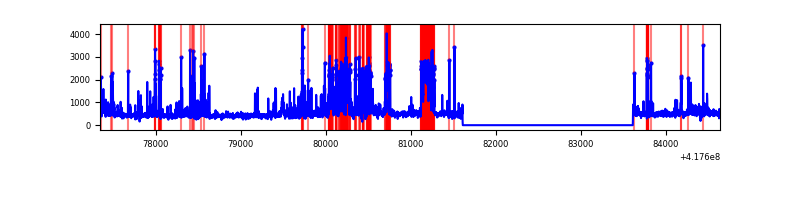 |
Top three noisy pixels from each quadrant. If the there are fewer than three noisy pixels in the level2.evt file, extra rows are filled as -1
| Pixel properties | Quadrant properties | ||||||
|---|---|---|---|---|---|---|---|
| Quadrant | DetID | PixID | Counts | Sigma | Mean | Median | Sigma |
| A | 10 | 83 | 504766 | 4099.61 | 601 | 591 | 123.0 |
| A | 12 | 189 | 65474 | 527.58 | 601 | 591 | 123.0 |
| A | 2 | 79 | 54613 | 439.27 | 601 | 591 | 123.0 |
| B | 3 | 112 | 56529 | 487.21 | 598 | 583 | 114.8 |
| B | 15 | 85 | 22722 | 192.8 | 598 | 583 | 114.8 |
| B | 0 | 230 | 20289 | 171.61 | 598 | 583 | 114.8 |
| C | 14 | 254 | 276720 | 2023.89 | 578 | 582 | 136.4 |
| C | 15 | 214 | 234333 | 1713.22 | 578 | 582 | 136.4 |
| C | 0 | 10 | 34176 | 246.22 | 578 | 582 | 136.4 |
| D | 2 | 250 | 663869 | 5108.18 | 521 | 506 | 129.9 |
| D | 12 | 128 | 341216 | 2623.62 | 521 | 506 | 129.9 |
| D | 12 | 227 | 182974 | 1405.08 | 521 | 506 | 129.9 |
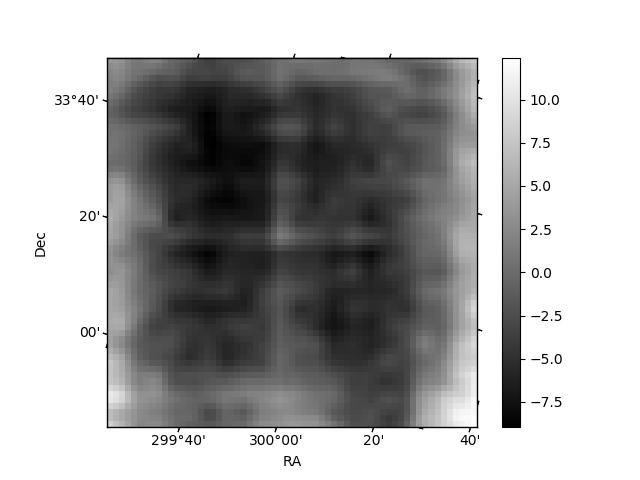
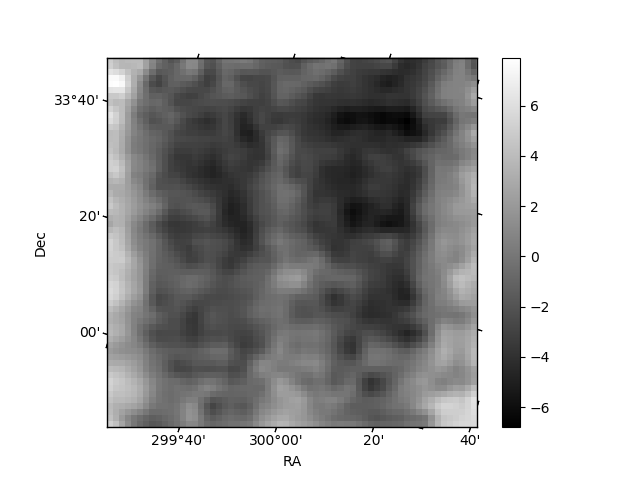
Histogram calculated using DETX and DETY for each event in the final _common_clean file
| Quadrant A | 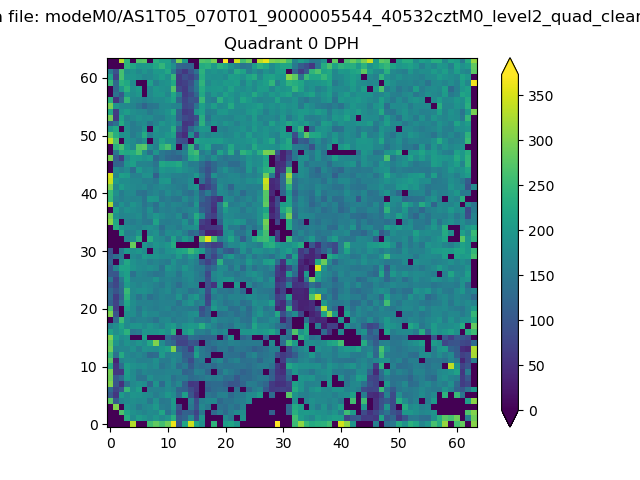 |
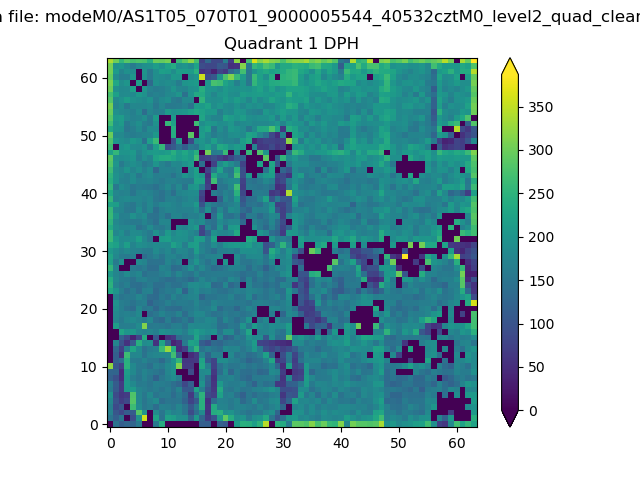 |
Quadrant B |
|---|---|---|---|
| Quadrant D | 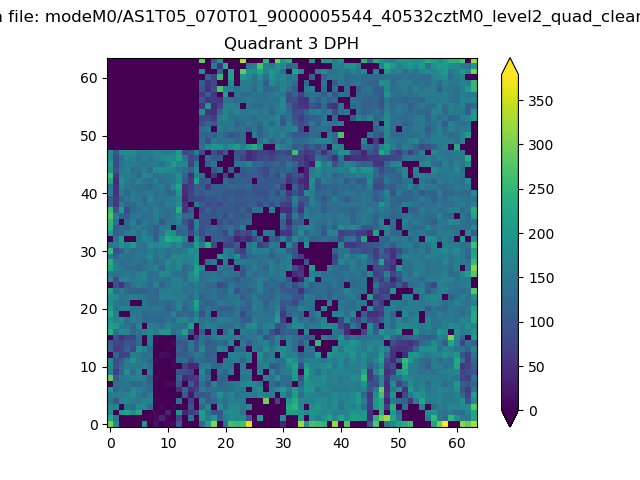 |
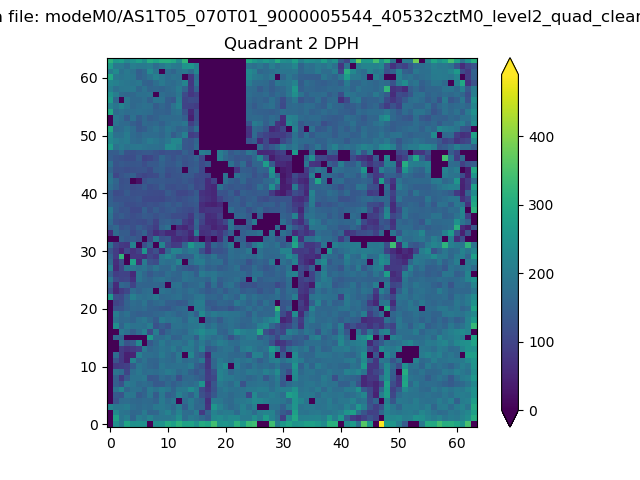 |
Quadrant C |
| Plot type | Count rate plots | Images |
|---|---|---|
| Comparison with Poisson distribution Blue bars denote a histogram of data divided into 1 sec bins. Red curve is a Poisson curve with rate = median count rate of data. |
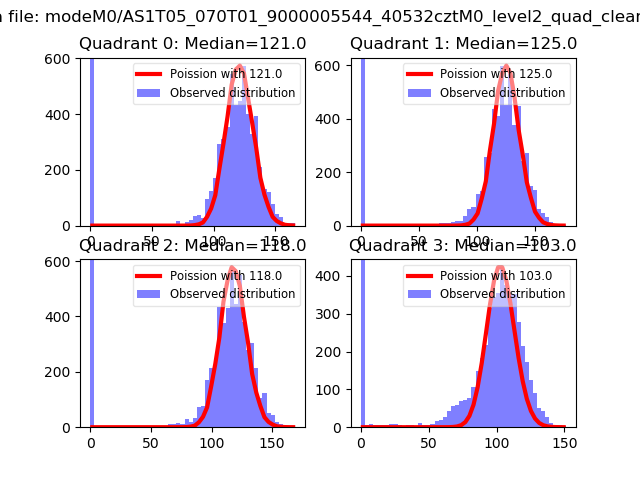 |
 |
| Quadrant-wise count rates Data is divided into 100 sec bins |
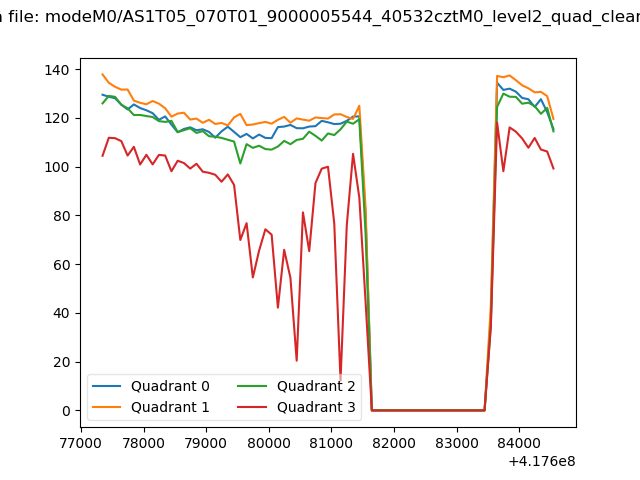 |
|
| Module-wise count rates for Quadrant A Data is divided into 100 sec bins |
 |
 |
| Module-wise count rates for Quadrant B Data is divided into 100 sec bins |
 |
 |
| Module-wise count rates for Quadrant C Data is divided into 100 sec bins |
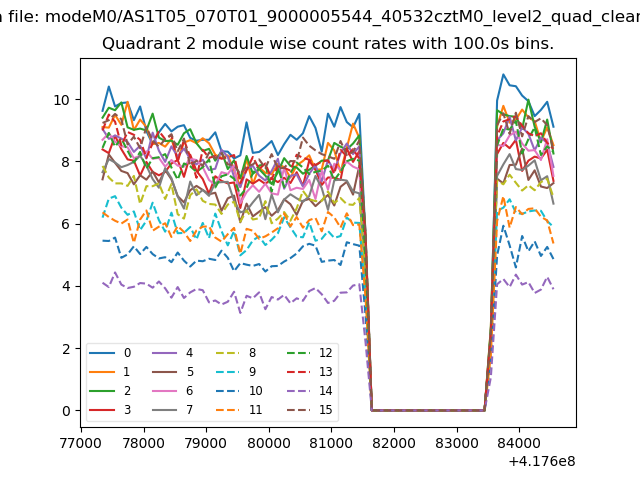 |
 |
| Module-wise count rates for Quadrant D Data is divided into 100 sec bins |
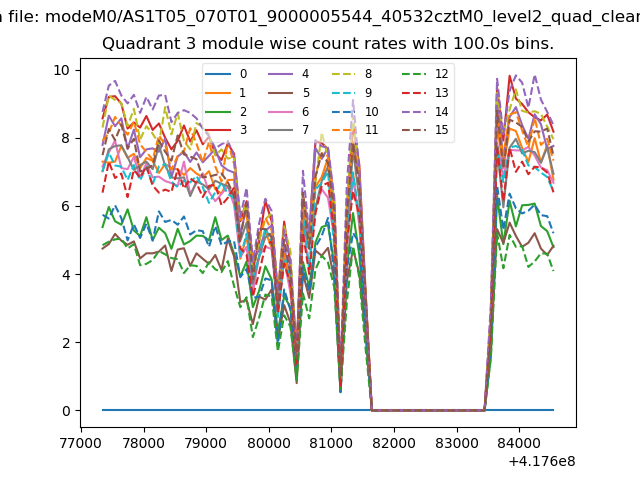 |
 |
| Parameter | Plot |
|---|---|
| CZT HV Monitor | 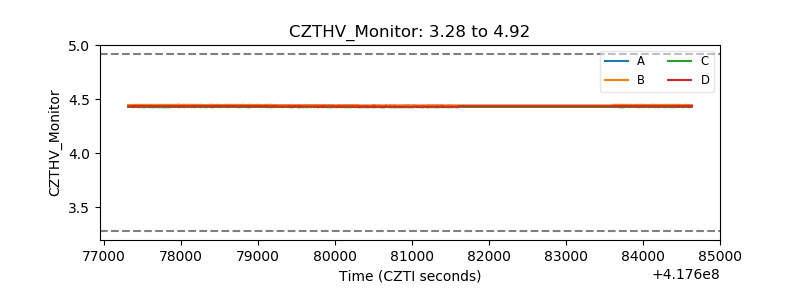 |
| D_VDD | 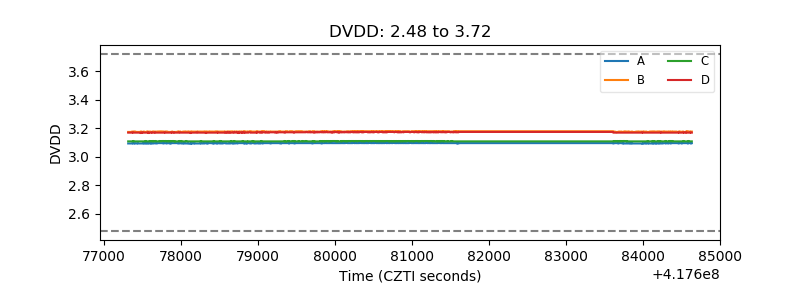 |
| Temperature 1 | 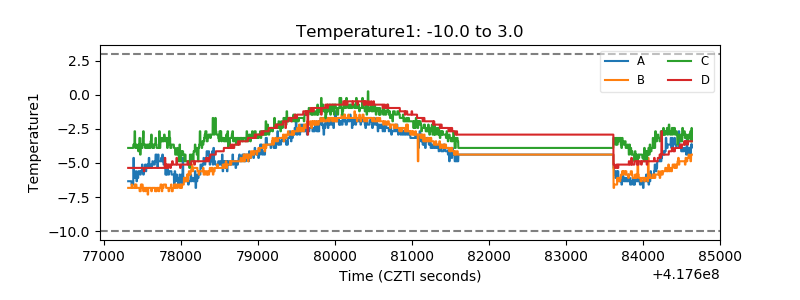 |
| Veto HV Monitor | 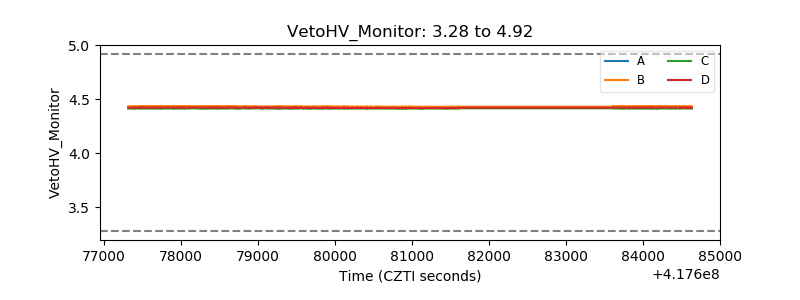 |
| Veto LLD | 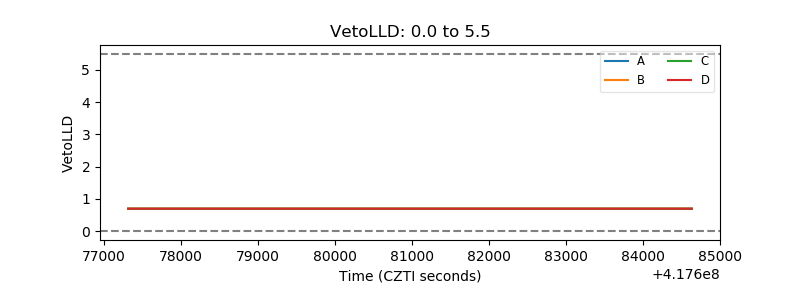 |
| Alpha Counter | 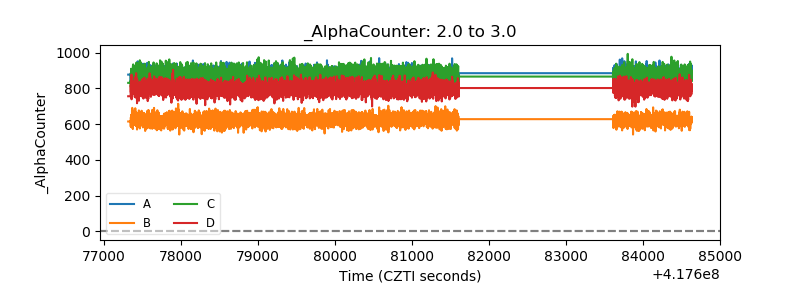 |
| _CPM_Rate | 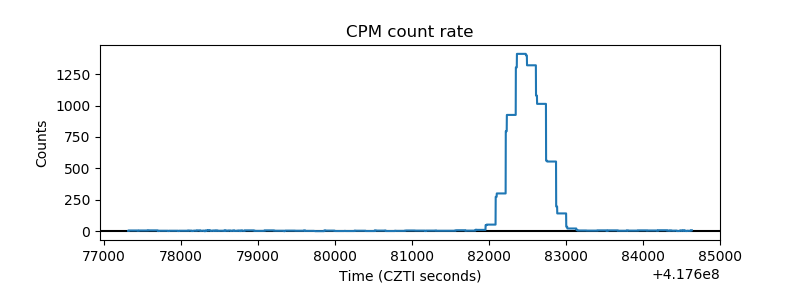 |
| CZT Counter | 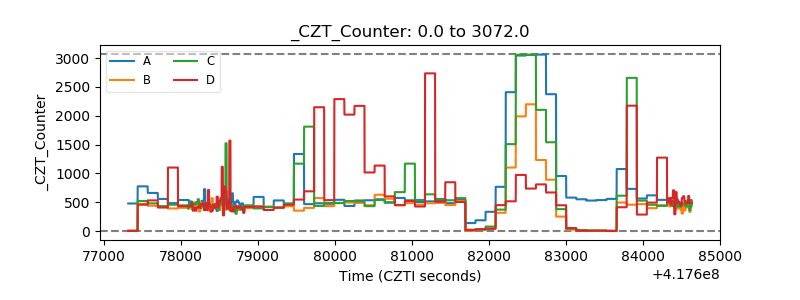 |
| +2.5 Volts monitor | 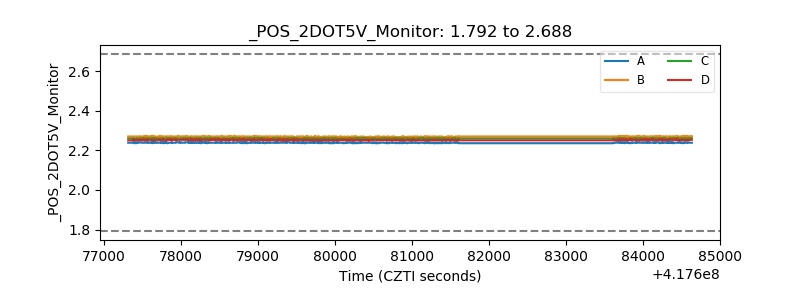 |
| +5 Volts monitor | 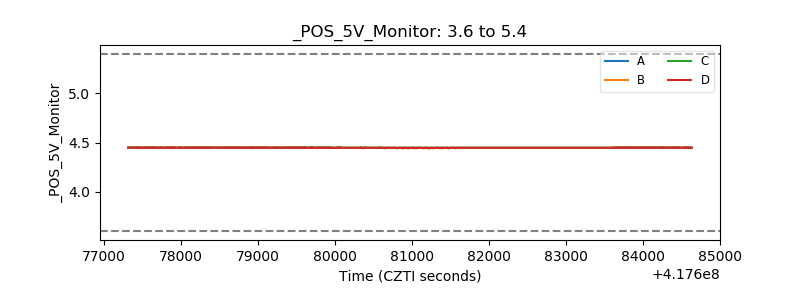 |
| _ROLL_ROT | 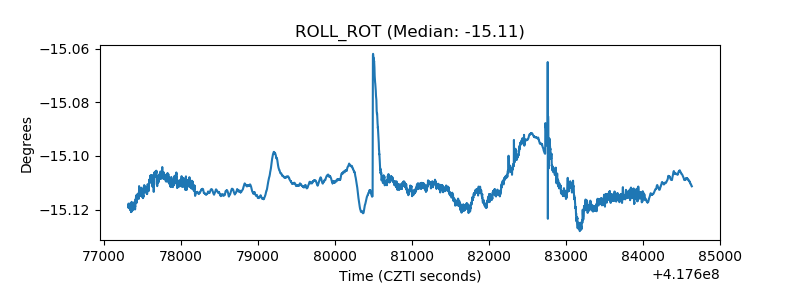 |
| _Roll_DEC | 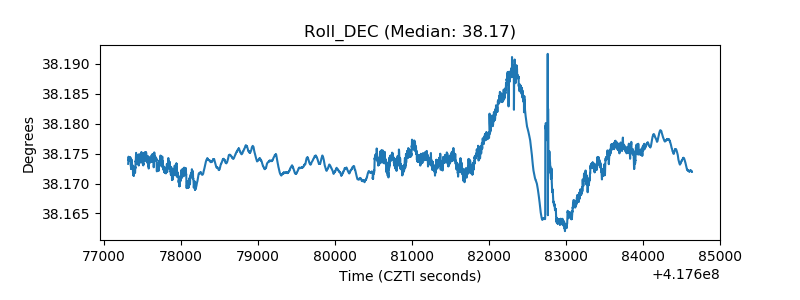 |
| _Roll_RA | 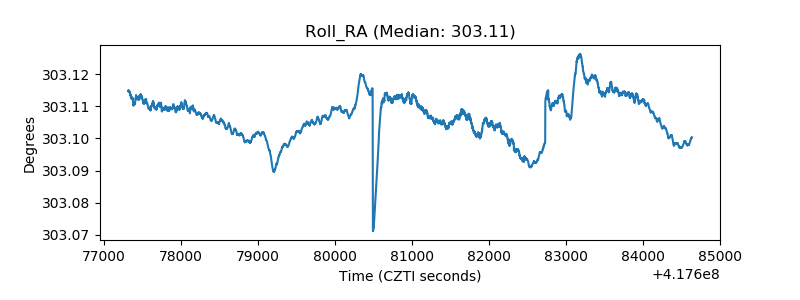 |
| Veto Counter | 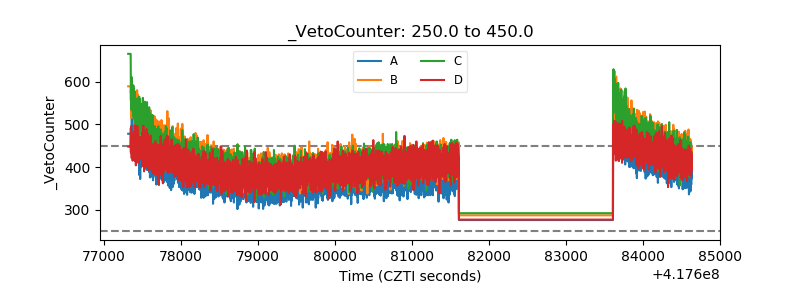 |