| Param | Original file | Final file |
|---|---|---|
| Filename | modeM0/AS1T05_070T01_9000005544_40536cztM0_level2.fits | modeM0/AS1T05_070T01_9000005544_40536cztM0_level2_quad_clean.evt |
| Size (bytes) | 1,590,575,040 | 419,523,840 |
| Size | 1.5 GB | 400.1 MB |
| Events in quadrant A | 13,904,015 | 2,943,199 |
| Events in quadrant B | 12,113,863 | 3,025,095 |
| Events in quadrant C | 13,523,608 | 2,847,591 |
| Events in quadrant D | 17,377,808 | 2,148,764 |
| Mode M0 | |||
|---|---|---|---|
| Quadrant | BADHDUFLAG | Total packets | Discarded packets |
| A | 0 | 55802 | 5 |
| B | 0 | 52267 | 5 |
| C | 0 | 55641 | 5 |
| D | 0 | 68627 | 5 |
| Mode M9 | |||
|---|---|---|---|
| Quadrant | BADHDUFLAG | Total packets | Discarded packets |
| A | 0 | 103 | 0 |
| B | 0 | 103 | 0 |
| C | 0 | 103 | 0 |
| D | 0 | 103 | 0 |
| Mode SS | |||
|---|---|---|---|
| Quadrant | BADHDUFLAG | Total packets | Discarded packets |
| A | 0 | 512 | 0 |
| B | 0 | 512 | 0 |
| C | 0 | 512 | 0 |
| D | 0 | 512 | 0 |
| Quadrant | Total seconds | Saturated seconds | Saturation percentage |
|---|---|---|---|
| A | 25260 | 75 | 0.296912% |
| B | 25260 | 109 | 0.431512% |
| C | 25260 | 231 | 0.914489% |
| D | 25260 | 5456 | 21.599367% |
Noise dominated data is calculated using 1-second bins in cleaned event files. If a bin has >2000 counts, and if more than 50% of those come from <1% of pixels, then it is considered to be noise-dominated and hence unusable.
| Quadrant | # 1 sec bins | Bins with >0 counts | Bins with >2000 counts | High rate bins dominated by noise | Noise dominated (total time) | Noise dominated (detector-on time) | Marked lightcurve |
|---|---|---|---|---|---|---|---|
| A | 35455 | 25265 | 24 | 24 | 0.07% | 0.09% | 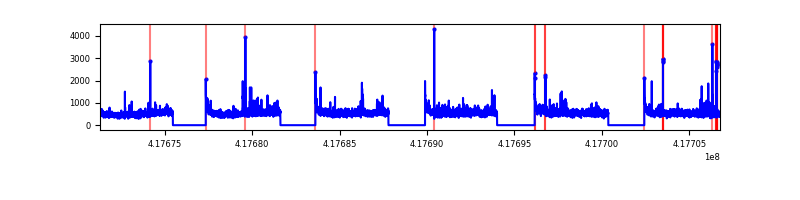 |
| B | 35455 | 25265 | 57 | 57 | 0.16% | 0.23% | 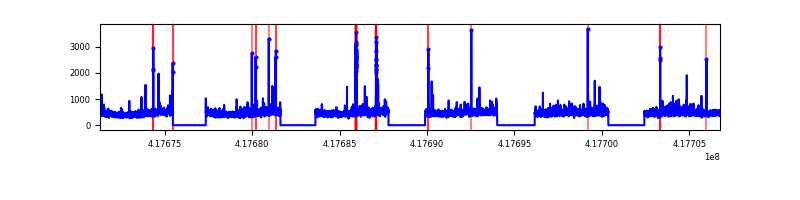 |
| C | 35455 | 25265 | 210 | 210 | 0.59% | 0.83% | 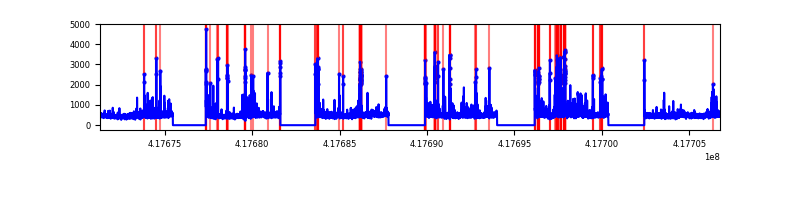 |
| D | 35455 | 25265 | 1214 | 1214 | 3.42% | 4.81% | 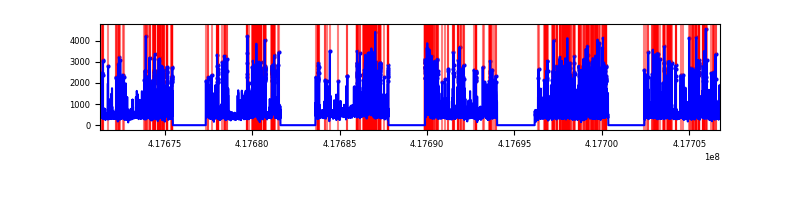 |
Top three noisy pixels from each quadrant. If the there are fewer than three noisy pixels in the level2.evt file, extra rows are filled as -1
| Pixel properties | Quadrant properties | ||||||
|---|---|---|---|---|---|---|---|
| Quadrant | DetID | PixID | Counts | Sigma | Mean | Median | Sigma |
| A | 10 | 83 | 2097038 | 3636.89 | 2850 | 2795 | 575.8 |
| A | 12 | 189 | 302879 | 521.13 | 2850 | 2795 | 575.8 |
| A | 3 | 1 | 240568 | 412.92 | 2850 | 2795 | 575.8 |
| B | 3 | 112 | 422730 | 779.95 | 2828 | 2751 | 538.5 |
| B | 15 | 85 | 229350 | 420.82 | 2828 | 2751 | 538.5 |
| B | 0 | 230 | 202267 | 370.52 | 2828 | 2751 | 538.5 |
| C | 15 | 214 | 1098868 | 1708.47 | 2756 | 2776 | 641.6 |
| C | 14 | 254 | 1065232 | 1656.04 | 2756 | 2776 | 641.6 |
| C | 10 | 20 | 521294 | 808.21 | 2756 | 2776 | 641.6 |
| D | 2 | 250 | 3055231 | 5048.81 | 2461 | 2395 | 604.7 |
| D | 12 | 227 | 2522900 | 4168.44 | 2461 | 2395 | 604.7 |
| D | 12 | 191 | 979515 | 1615.97 | 2461 | 2395 | 604.7 |
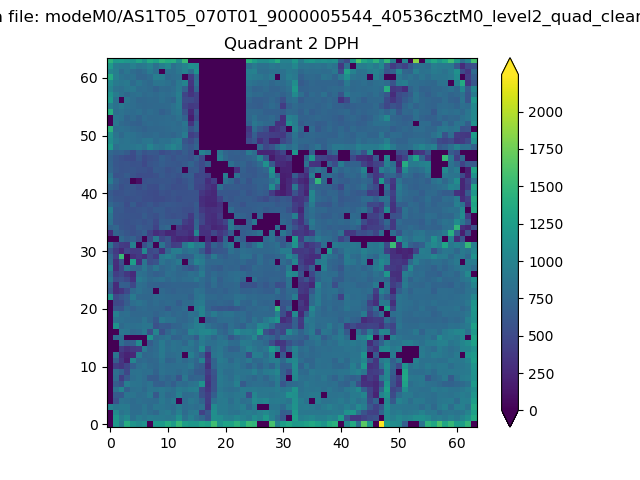
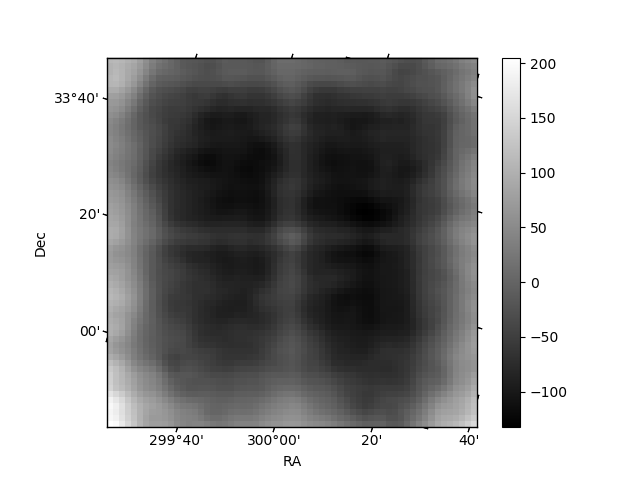
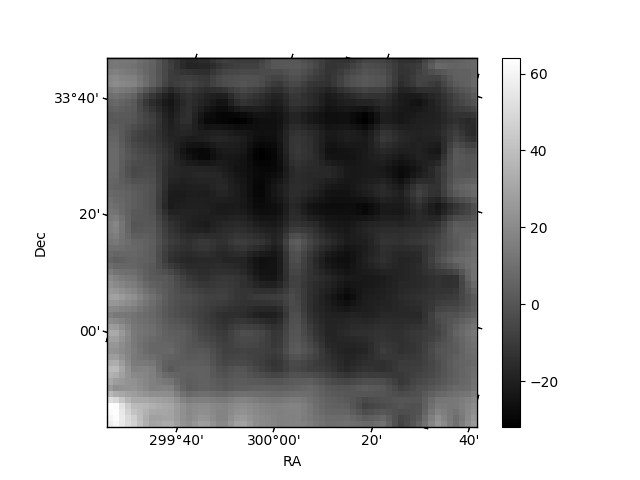
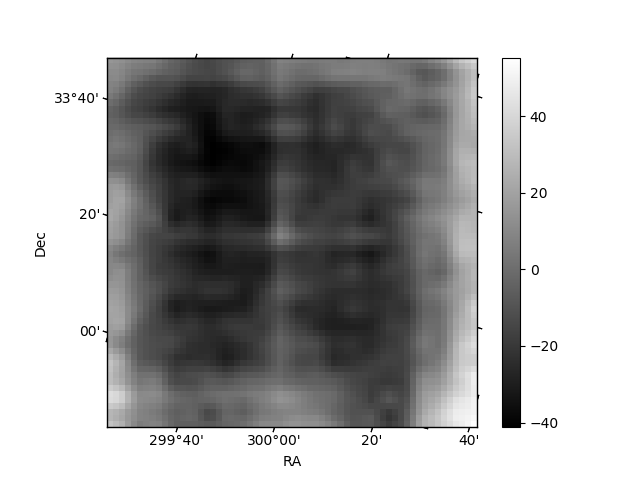
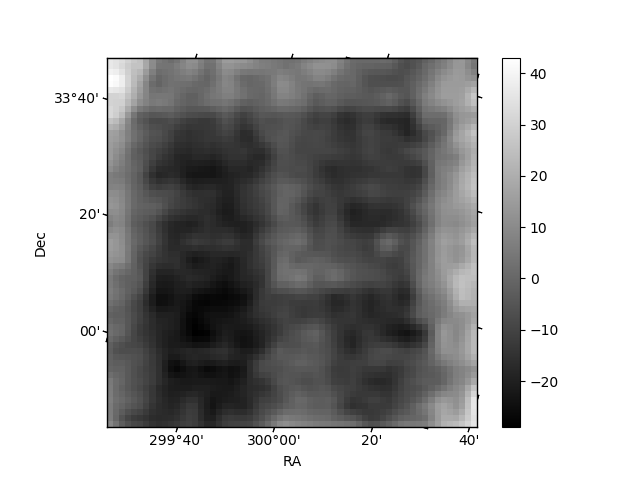
Histogram calculated using DETX and DETY for each event in the final _common_clean file
| Quadrant A | 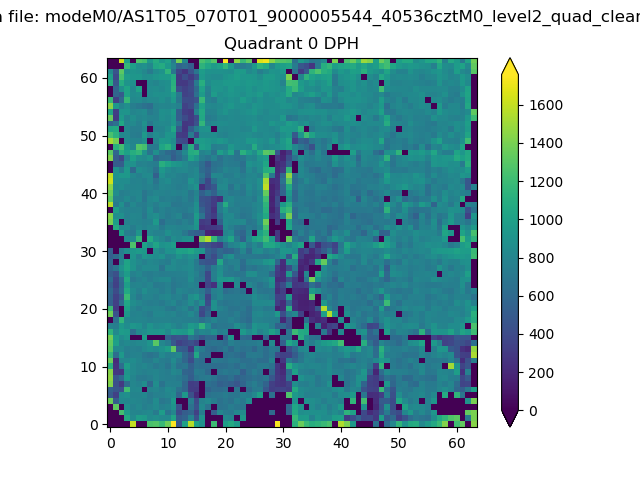 |
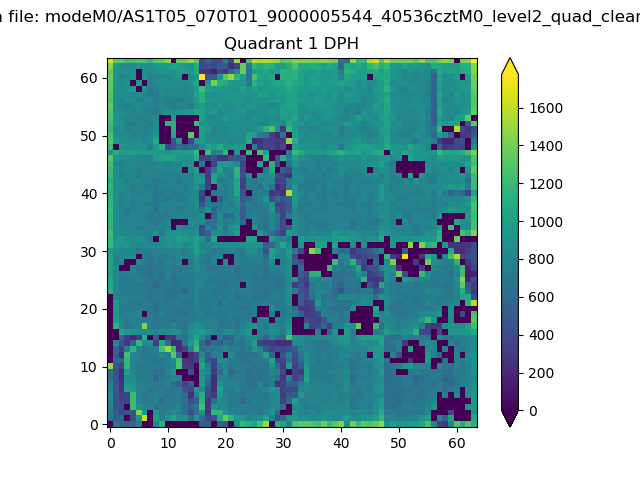 |
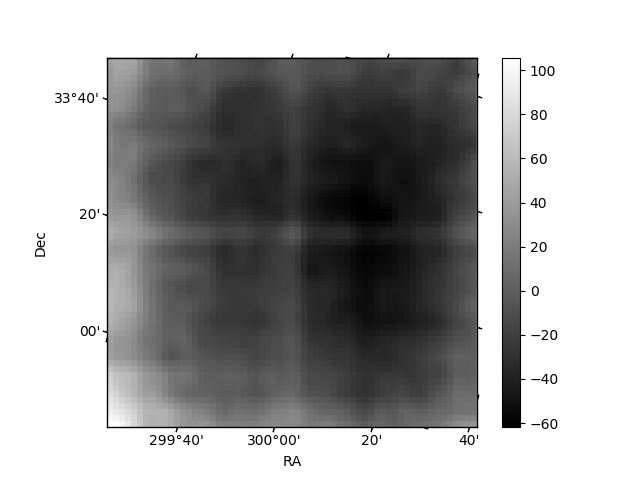
Quadrant B |
|---|---|---|---|
| Quadrant D | 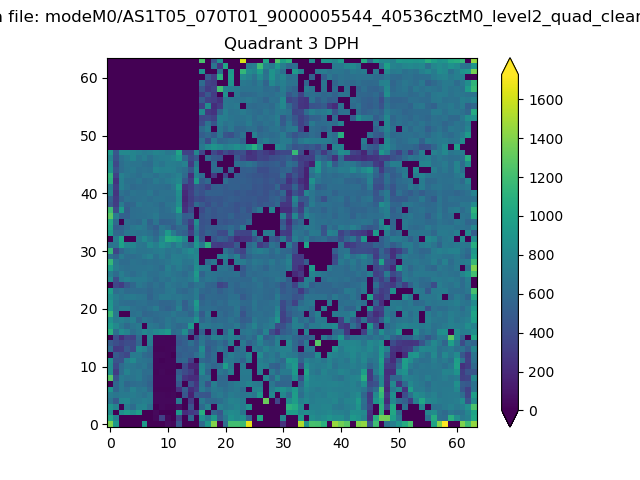 |
 |
Quadrant C |
| Plot type | Count rate plots | Images |
|---|---|---|
| Comparison with Poisson distribution Blue bars denote a histogram of data divided into 1 sec bins. Red curve is a Poisson curve with rate = median count rate of data. |
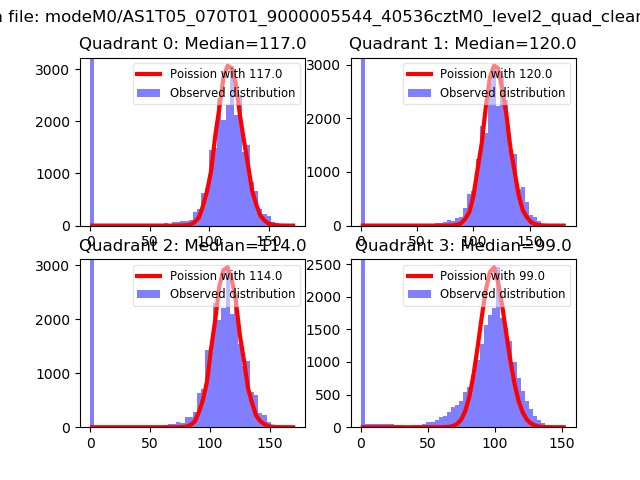 |
 |
| Quadrant-wise count rates Data is divided into 100 sec bins |
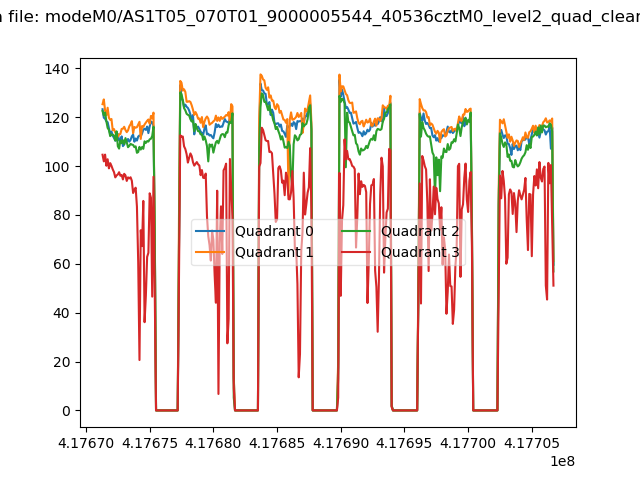 |
|
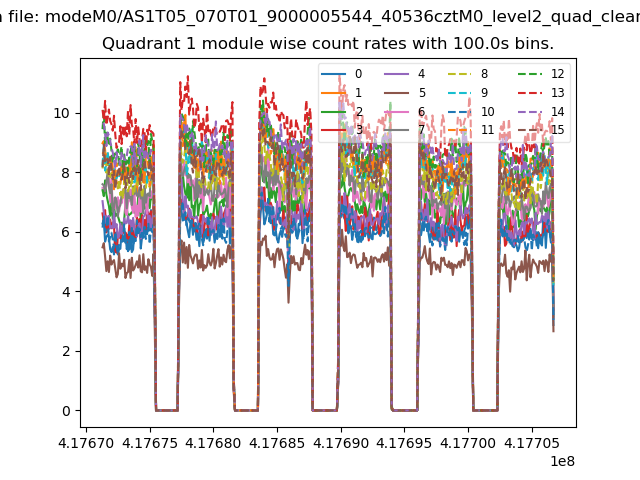
| Module-wise count rates for Quadrant A Data is divided into 100 sec bins |
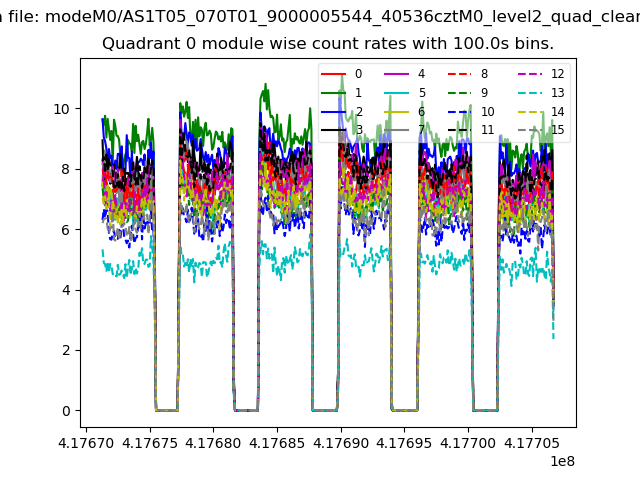 |
 |
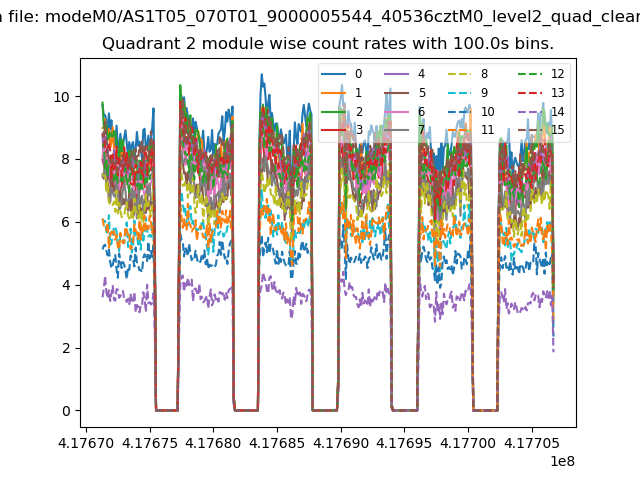
| Module-wise count rates for Quadrant B Data is divided into 100 sec bins |
 |
 |
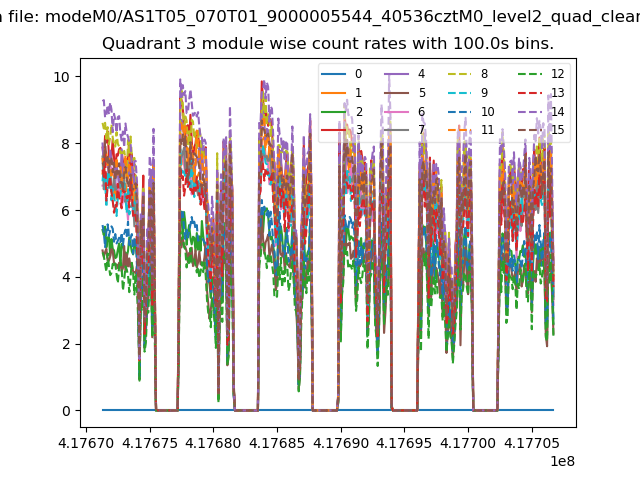
| Module-wise count rates for Quadrant C Data is divided into 100 sec bins |
 |
 |
| Module-wise count rates for Quadrant D Data is divided into 100 sec bins |
 |
 |
| Parameter | Plot |
|---|---|
| CZT HV Monitor | 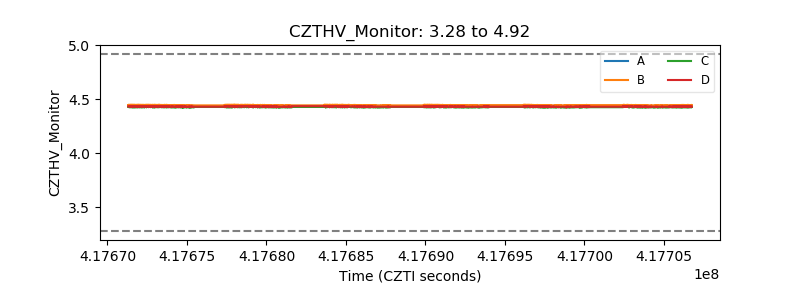 |
| D_VDD | 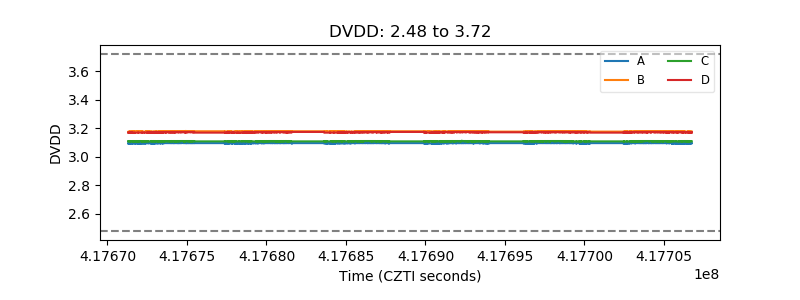 |
| Temperature 1 | 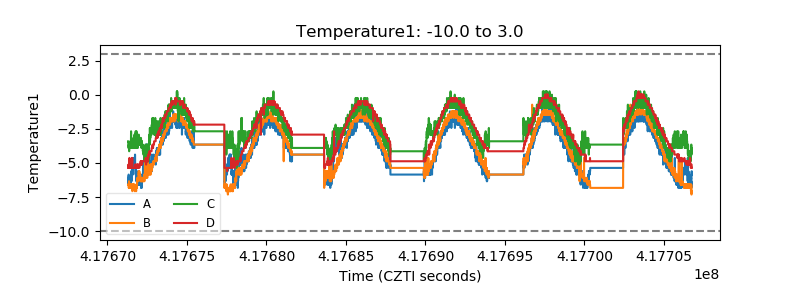 |
| Veto HV Monitor | 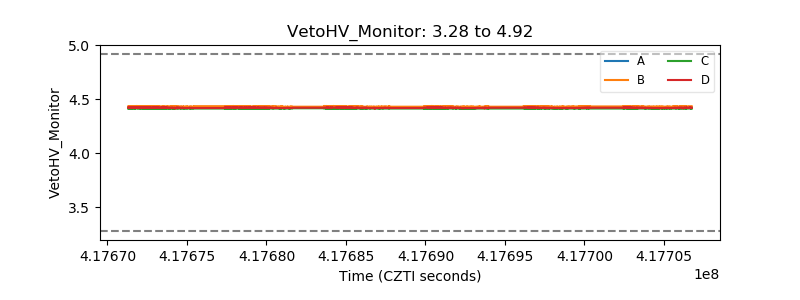 |
| Veto LLD | 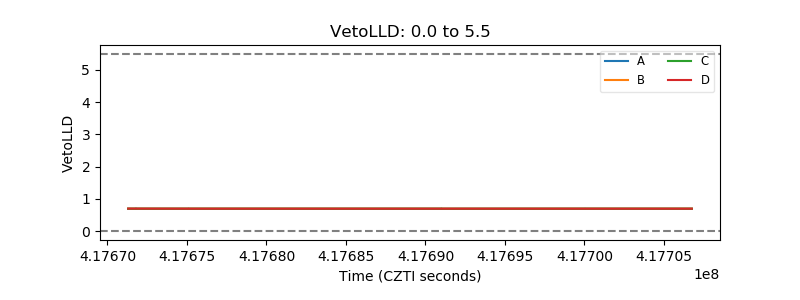 |
| Alpha Counter | 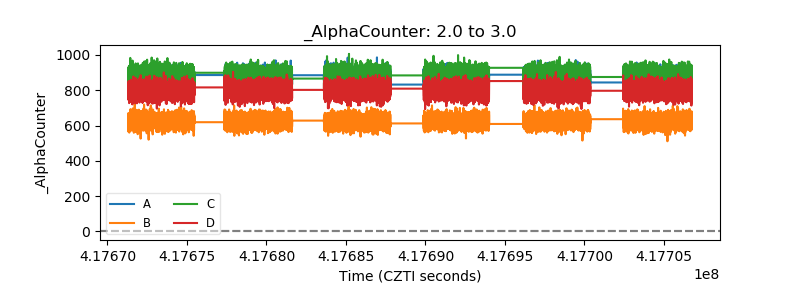 |
| _CPM_Rate | 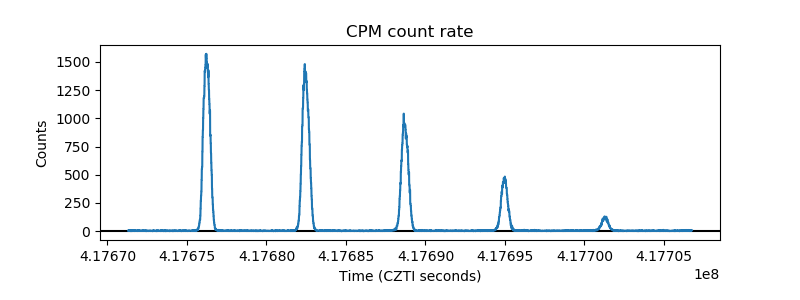 |
| CZT Counter | 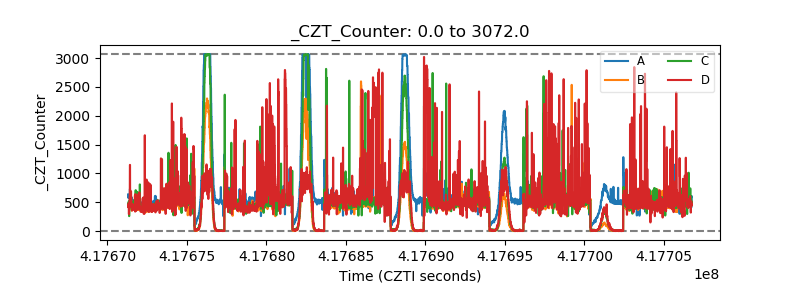 |
| +2.5 Volts monitor | 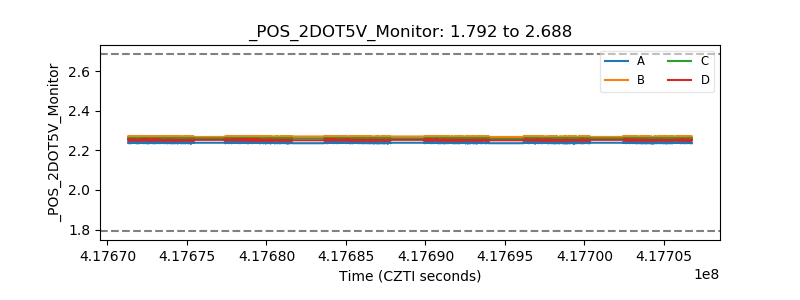 |
| +5 Volts monitor | 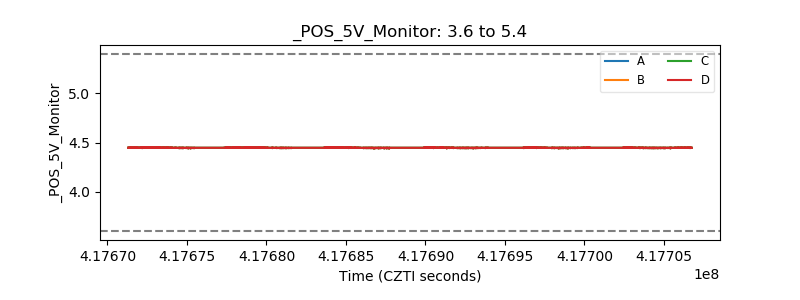 |
| _ROLL_ROT | 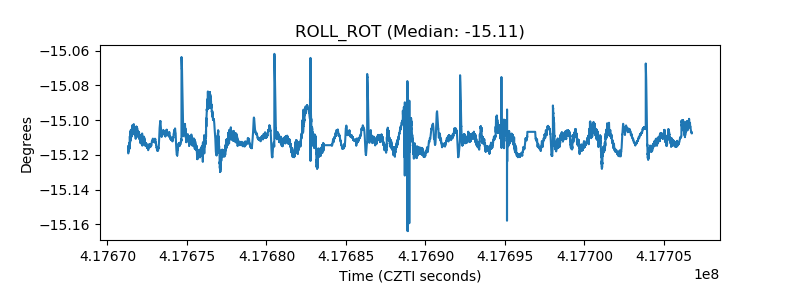 |
| _Roll_DEC | 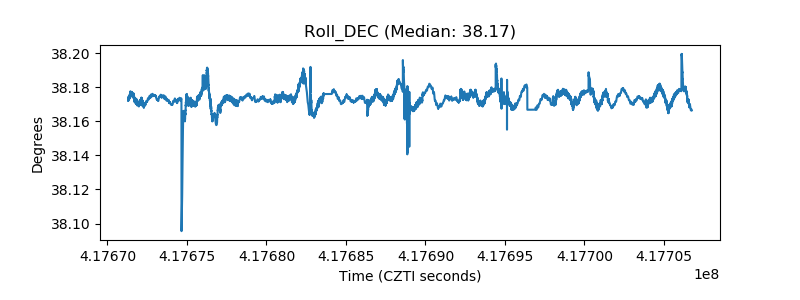 |
| _Roll_RA | 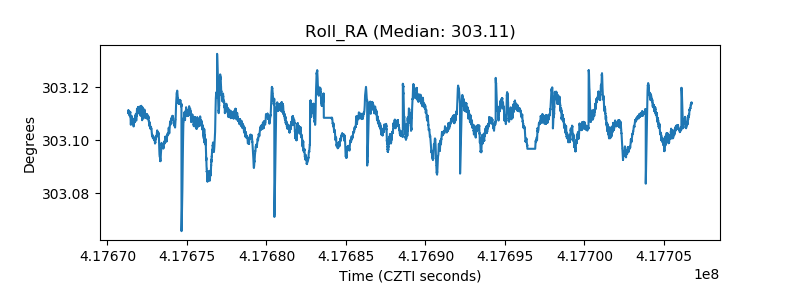 |
| Veto Counter | 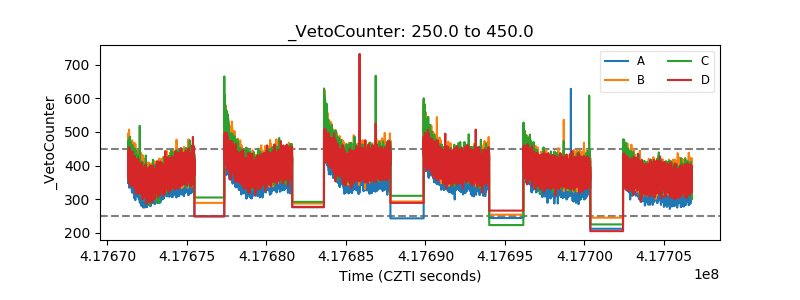 |