| Param | Original file | Final file |
|---|---|---|
| Filename | modeM0/AS1T05_070T01_9000005544_40709cztM0_level2.fits | modeM0/AS1T05_070T01_9000005544_40709cztM0_level2_quad_clean.evt |
| Size (bytes) | 54,135,360 | 10,969,920 |
| Size | 51.6 MB | 10.5 MB |
| Events in quadrant A | 390,988 | 75,565 |
| Events in quadrant B | 336,990 | 78,769 |
| Events in quadrant C | 912,370 | 51,155 |
| Events in quadrant D | 304,932 | 69,808 |
| Mode M0 | |||
|---|---|---|---|
| Quadrant | BADHDUFLAG | Total packets | Discarded packets |
| A | 0 | 2030 | 429 |
| B | 0 | 1828 | 310 |
| C | 0 | 4522 | 1358 |
| D | 0 | 1739 | 246 |
| Mode M9 | |||
|---|---|---|---|
| Quadrant | BADHDUFLAG | Total packets | Discarded packets |
| A | 0 | 4 | 4 |
| B | 0 | 5 | 5 |
| C | 0 | 5 | 4 |
| D | 0 | 4 | 3 |
| Mode SS | |||
|---|---|---|---|
| Quadrant | BADHDUFLAG | Total packets | Discarded packets |
| A | 0 | 17 | 1 |
| B | 0 | 17 | 2 |
| C | 0 | 17 | 2 |
| D | 0 | 17 | 0 |
| Quadrant | Total seconds | Saturated seconds | Saturation percentage |
|---|---|---|---|
| A | 717 | 2 | 0.278940% |
| B | 725 | 3 | 0.413793% |
| C | 645 | 174 | 26.976744% |
| D | 746 | 30 | 4.021448% |
Noise dominated data is calculated using 1-second bins in cleaned event files. If a bin has >2000 counts, and if more than 50% of those come from <1% of pixels, then it is considered to be noise-dominated and hence unusable.
| Quadrant | # 1 sec bins | Bins with >0 counts | Bins with >2000 counts | High rate bins dominated by noise | Noise dominated (total time) | Noise dominated (detector-on time) | Marked lightcurve |
|---|---|---|---|---|---|---|---|
| A | 905 | 800 | 1 | 1 | 0.11% | 0.12% | 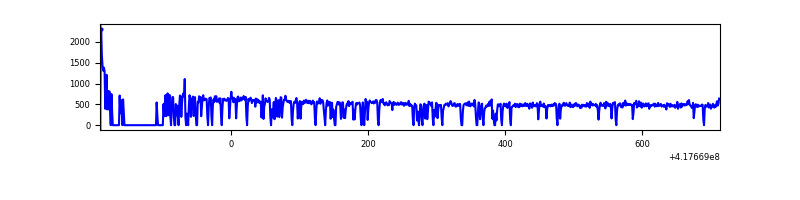 |
| B | 905 | 806 | 2 | 2 | 0.22% | 0.25% | 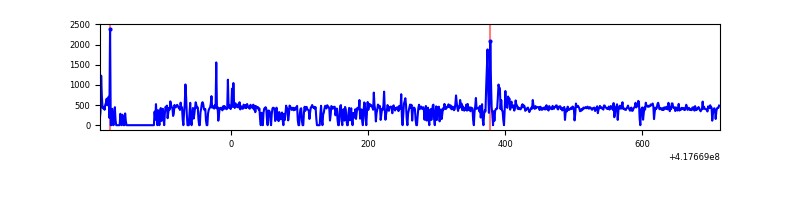 |
| C | 904 | 728 | 172 | 172 | 19.03% | 23.63% | 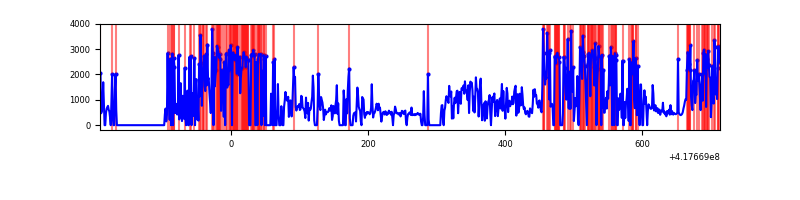 |
| D | 905 | 819 | 0 | 0 | 0.00% | 0.00% | 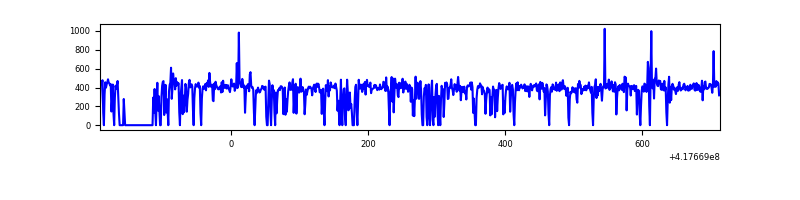 |
Top three noisy pixels from each quadrant. If the there are fewer than three noisy pixels in the level2.evt file, extra rows are filled as -1
| Pixel properties | Quadrant properties | ||||||
|---|---|---|---|---|---|---|---|
| Quadrant | DetID | PixID | Counts | Sigma | Mean | Median | Sigma |
| A | 10 | 83 | 89343 | 5081.96 | 76 | 74 | 17.6 |
| A | 15 | 174 | 4803 | 269.22 | 76 | 74 | 17.6 |
| A | 10 | 67 | 1405 | 75.77 | 76 | 74 | 17.6 |
| B | 0 | 190 | 24586 | 1445.85 | 76 | 74 | 17.0 |
| B | 5 | 255 | 8278 | 483.92 | 76 | 74 | 17.0 |
| B | 12 | 111 | 1971 | 111.9 | 76 | 74 | 17.0 |
| C | 9 | 187 | 644417 | 42352.06 | 57 | 57 | 15.2 |
| C | 15 | 214 | 26964 | 1768.53 | 57 | 57 | 15.2 |
| C | 14 | 254 | 11181 | 731.15 | 57 | 57 | 15.2 |
| D | 12 | 191 | 17552 | 894.58 | 73 | 71 | 19.5 |
| D | 2 | 249 | 2888 | 144.16 | 73 | 71 | 19.5 |
| D | 2 | 234 | 2731 | 136.12 | 73 | 71 | 19.5 |
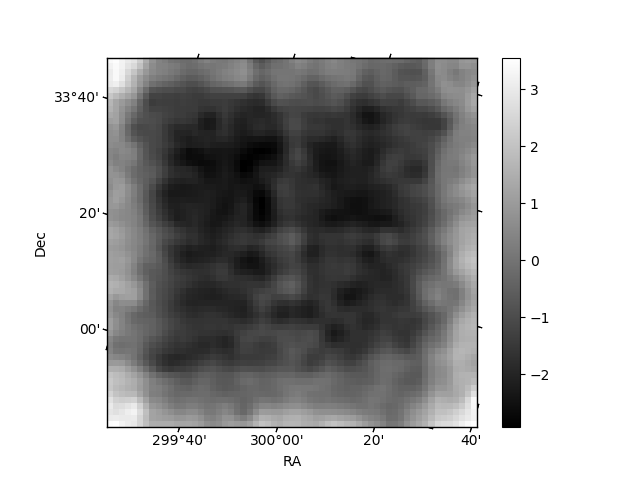
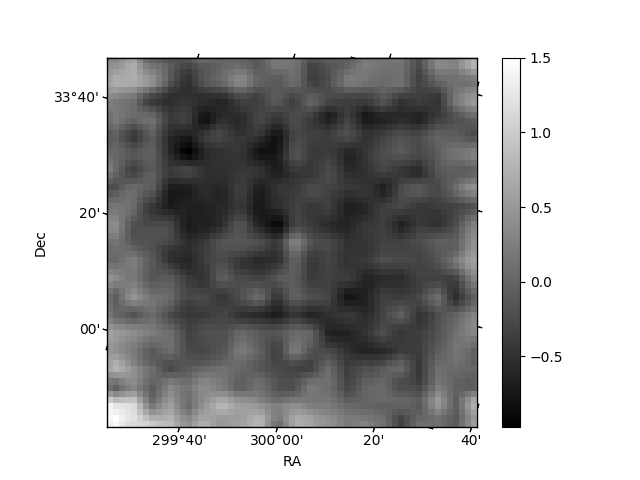
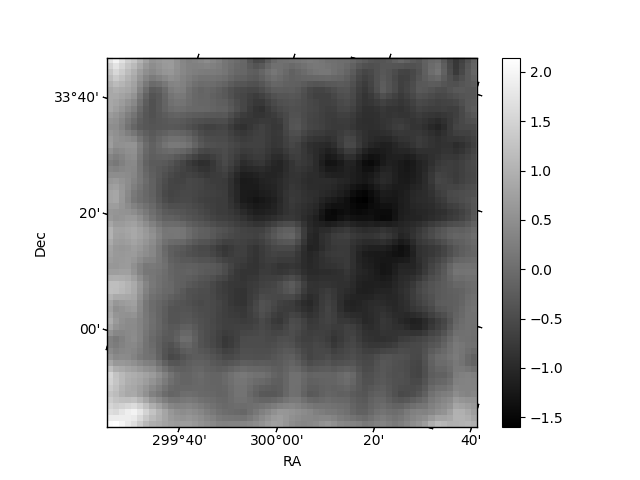
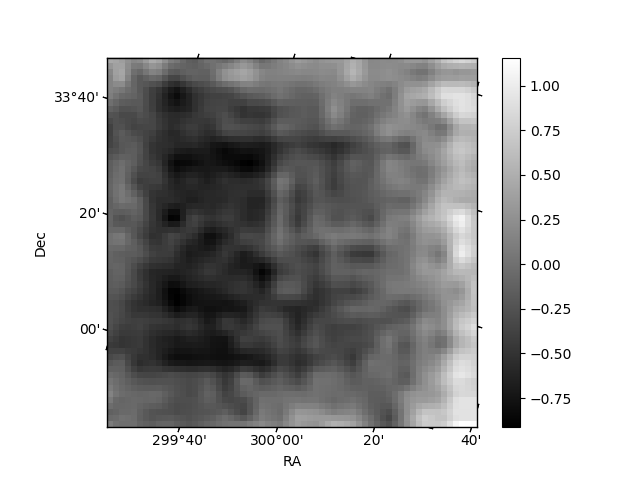
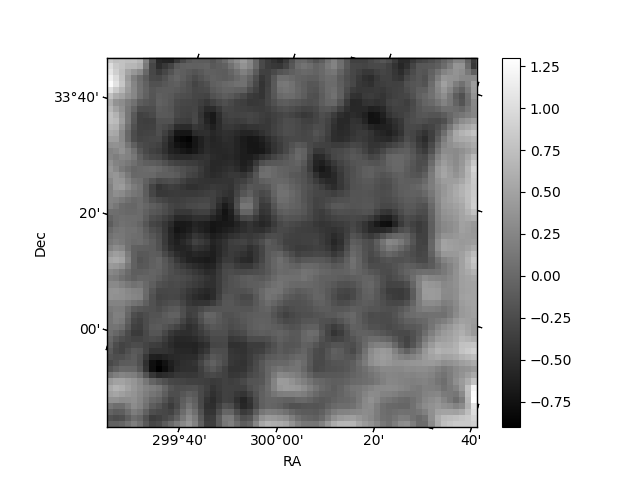
Histogram calculated using DETX and DETY for each event in the final _common_clean file
| Quadrant A | 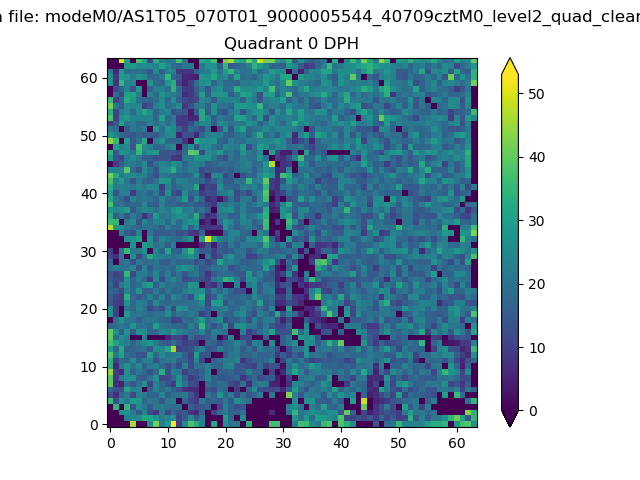 |
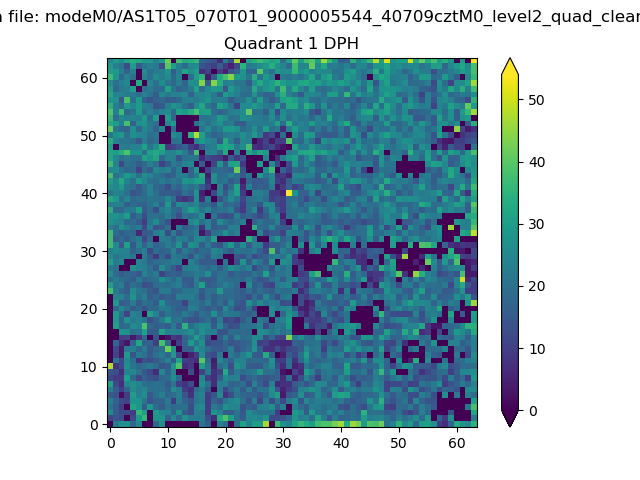 |
Quadrant B |
|---|---|---|---|
| Quadrant D | 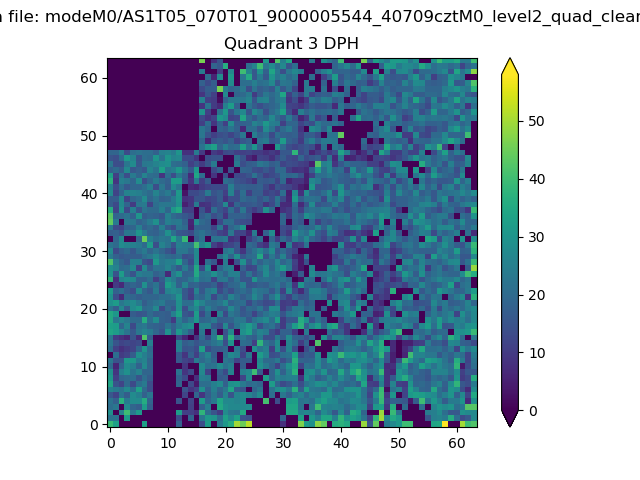 |
 |
Quadrant C |
| Plot type | Count rate plots | Images |
|---|---|---|
| Comparison with Poisson distribution Blue bars denote a histogram of data divided into 1 sec bins. Red curve is a Poisson curve with rate = median count rate of data. |
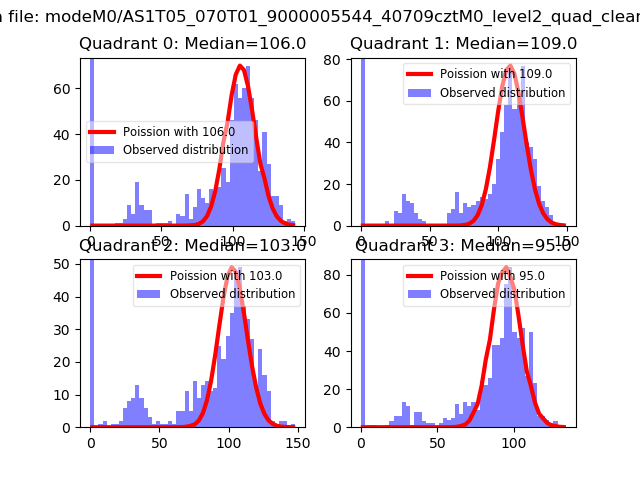 |
 |
| Quadrant-wise count rates Data is divided into 100 sec bins |
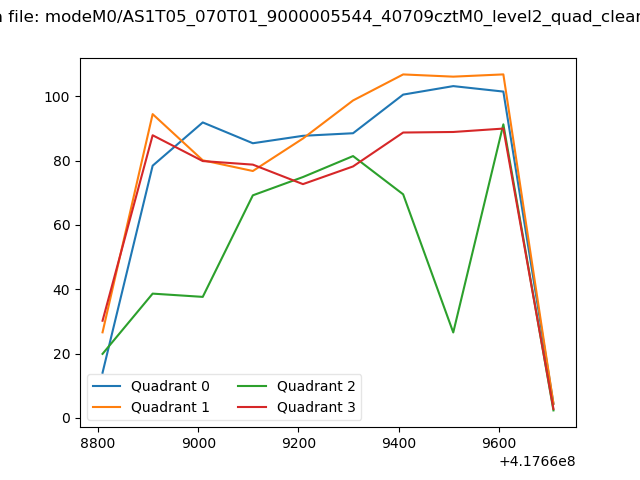 |
|
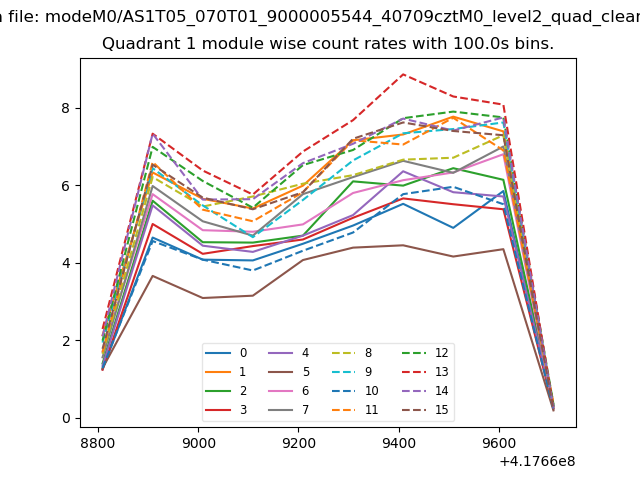
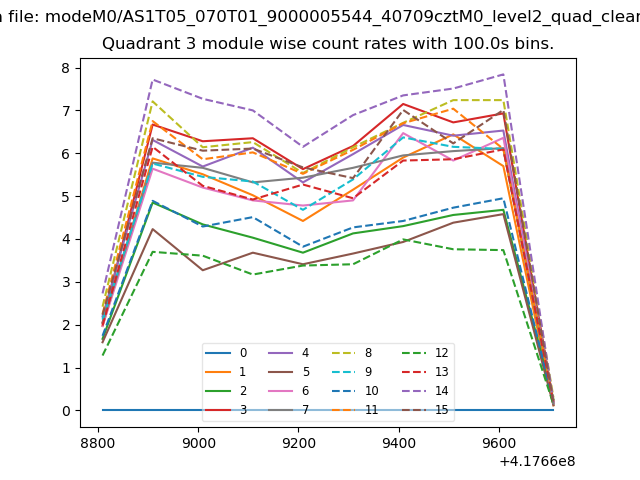
| Module-wise count rates for Quadrant A Data is divided into 100 sec bins |
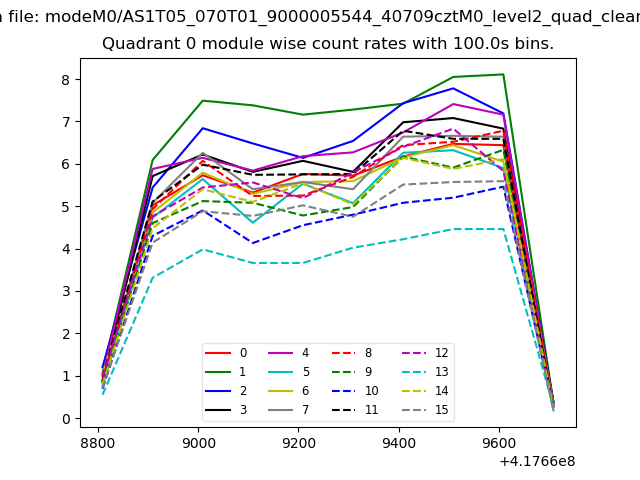 |
 |
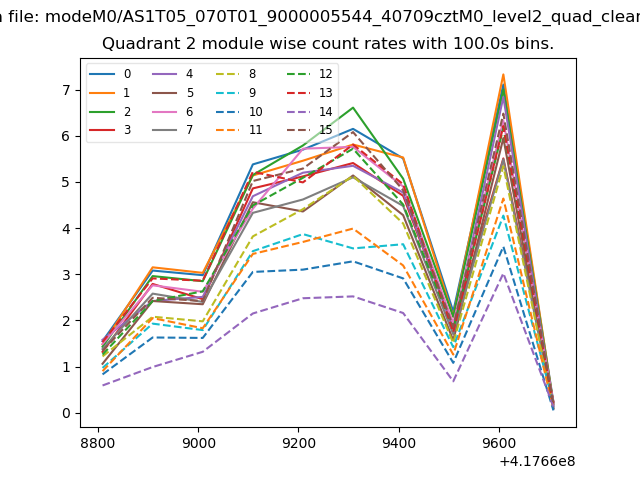
| Module-wise count rates for Quadrant B Data is divided into 100 sec bins |
 |
 |
| Module-wise count rates for Quadrant C Data is divided into 100 sec bins |
 |
 |
| Module-wise count rates for Quadrant D Data is divided into 100 sec bins |
 |
 |
| Parameter | Plot |
|---|---|
| CZT HV Monitor | 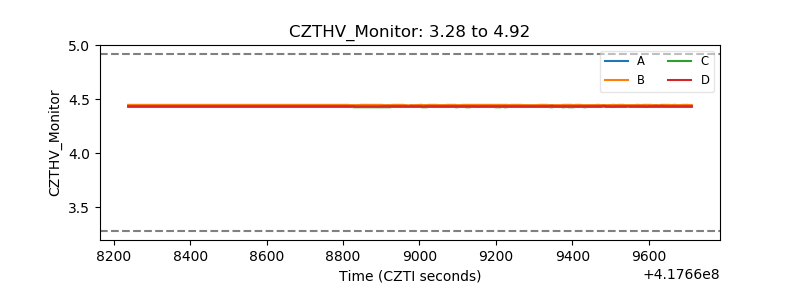 |
| D_VDD | 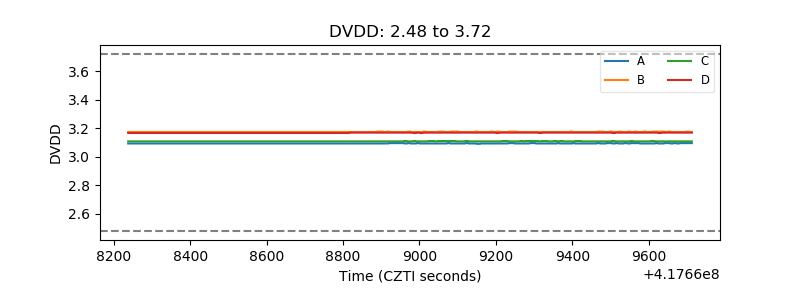 |
| Temperature 1 | 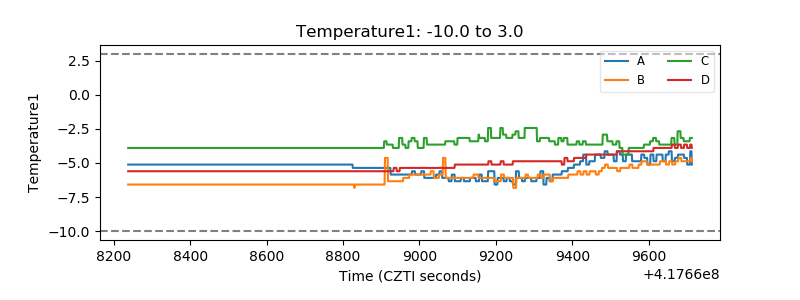 |
| Veto HV Monitor | 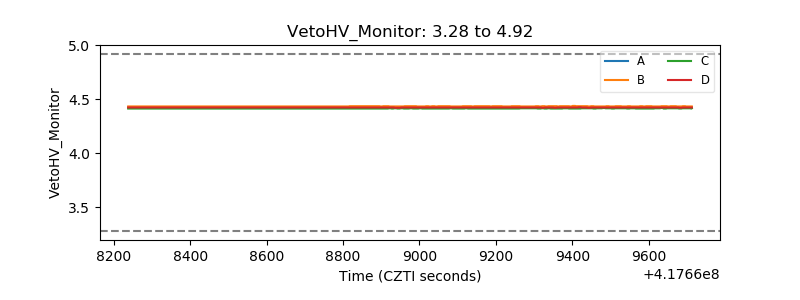 |
| Veto LLD | 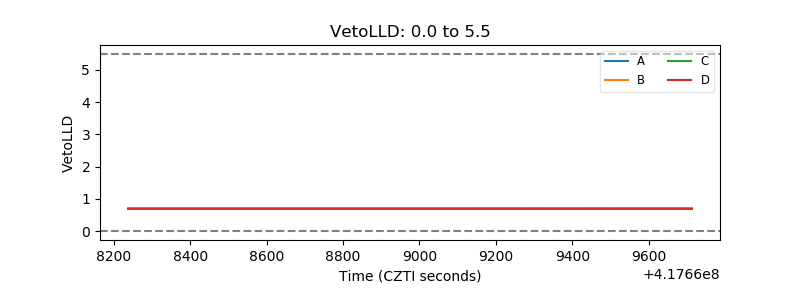 |
| Alpha Counter | 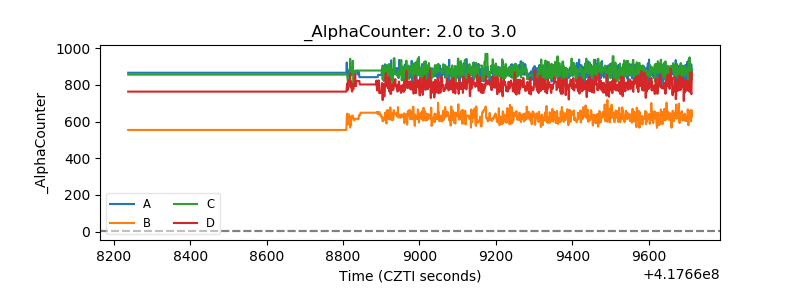 |
| _CPM_Rate | 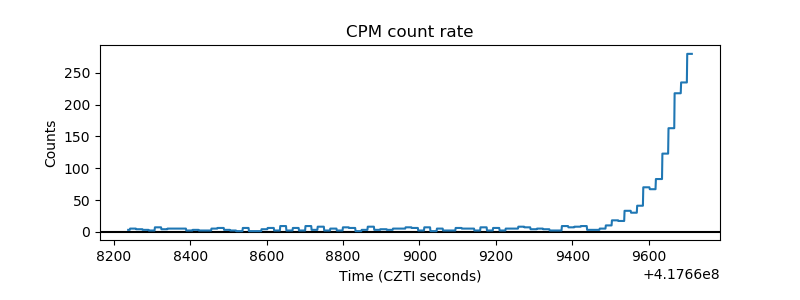 |
| CZT Counter | 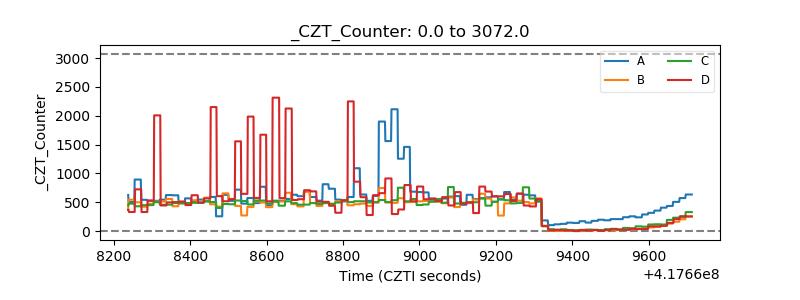 |
| +2.5 Volts monitor | 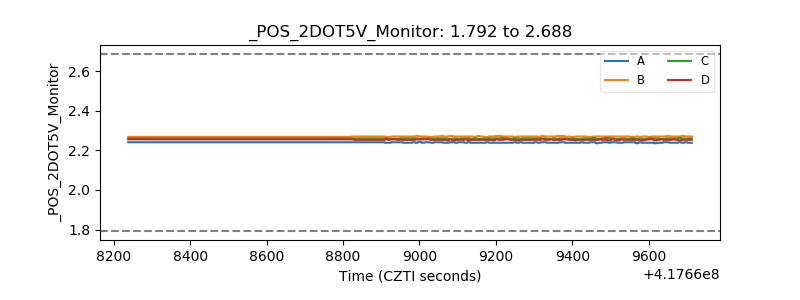 |
| +5 Volts monitor | 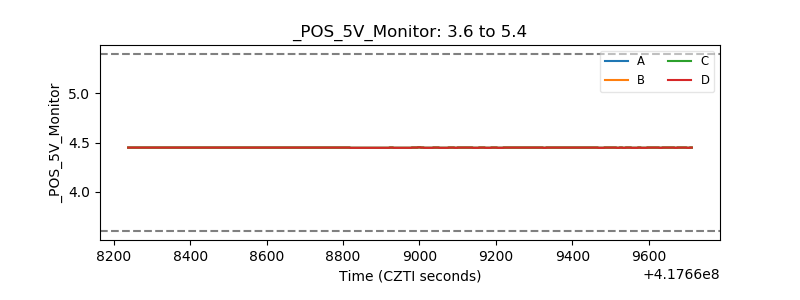 |
| _ROLL_ROT | 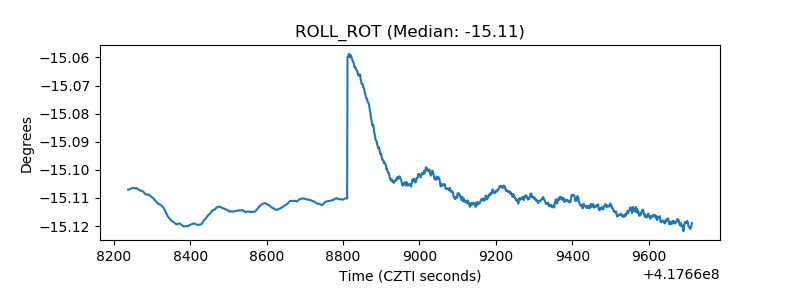 |
| _Roll_DEC | 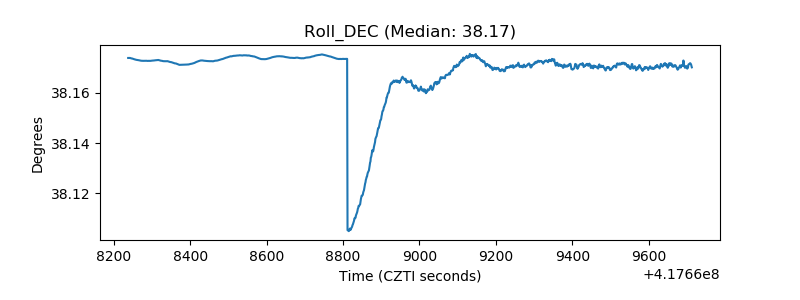 |
| _Roll_RA | 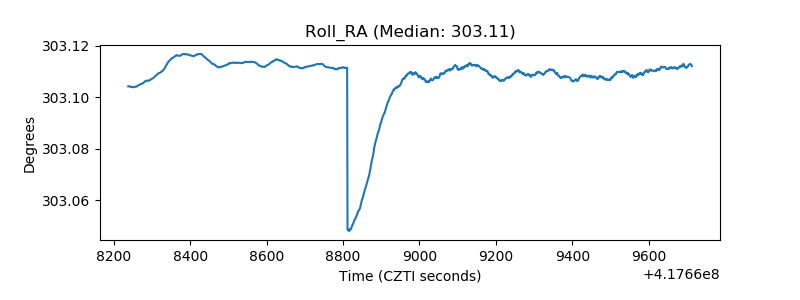 |
| Veto Counter | 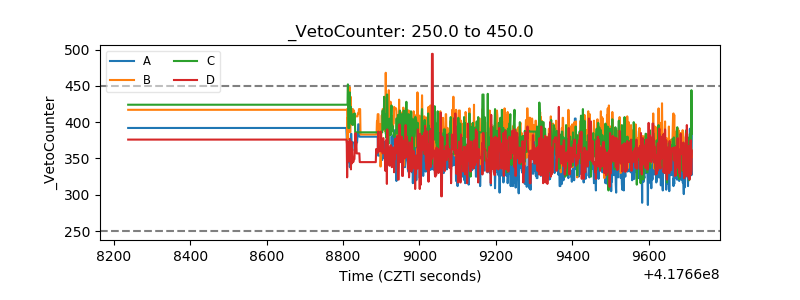 |