| Param | Original file | Final file |
|---|---|---|
| Filename | modeM0/AS1A12_006T09_9000005546_40537cztM0_level2.fits | modeM0/AS1A12_006T09_9000005546_40537cztM0_level2_quad_clean.evt |
| Size (bytes) | 405,601,920 | 88,375,680 |
| Size | 386.8 MB | 84.3 MB |
| Events in quadrant A | 3,221,393 | 621,533 |
| Events in quadrant B | 3,171,859 | 627,526 |
| Events in quadrant C | 2,741,216 | 599,460 |
| Events in quadrant D | 5,441,243 | 433,470 |
| Mode M9 | |||
|---|---|---|---|
| Quadrant | BADHDUFLAG | Total packets | Discarded packets |
| A | 0 | 19 | 0 |
| B | 0 | 19 | 0 |
| C | 0 | 19 | 0 |
| D | 0 | 19 | 0 |
| Mode M0 | |||
|---|---|---|---|
| Quadrant | BADHDUFLAG | Total packets | Discarded packets |
| A | 0 | 13059 | 3 |
| B | 0 | 13125 | 2 |
| C | 0 | 11714 | 2 |
| D | 0 | 20017 | 2 |
| Mode SS | |||
|---|---|---|---|
| Quadrant | BADHDUFLAG | Total packets | Discarded packets |
| A | 0 | 116 | 0 |
| B | 0 | 116 | 0 |
| C | 0 | 116 | 0 |
| D | 0 | 116 | 0 |
| Quadrant | Total seconds | Saturated seconds | Saturation percentage |
|---|---|---|---|
| A | 5626 | 10 | 0.177746% |
| B | 5626 | 70 | 1.244223% |
| C | 5626 | 14 | 0.248845% |
| D | 5626 | 1437 | 25.542126% |
Noise dominated data is calculated using 1-second bins in cleaned event files. If a bin has >2000 counts, and if more than 50% of those come from <1% of pixels, then it is considered to be noise-dominated and hence unusable.
| Quadrant | # 1 sec bins | Bins with >0 counts | Bins with >2000 counts | High rate bins dominated by noise | Noise dominated (total time) | Noise dominated (detector-on time) | Marked lightcurve |
|---|---|---|---|---|---|---|---|
| A | 7119 | 5627 | 6 | 6 | 0.08% | 0.11% | 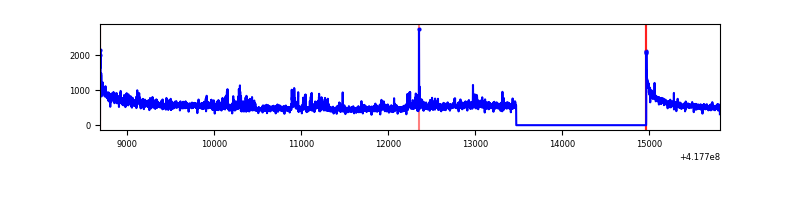 |
| B | 7119 | 5627 | 49 | 49 | 0.69% | 0.87% | 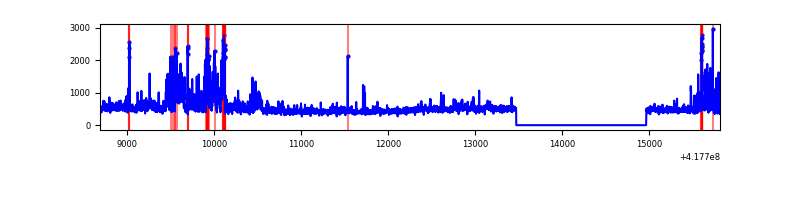 |
| C | 7119 | 5627 | 8 | 8 | 0.11% | 0.14% | 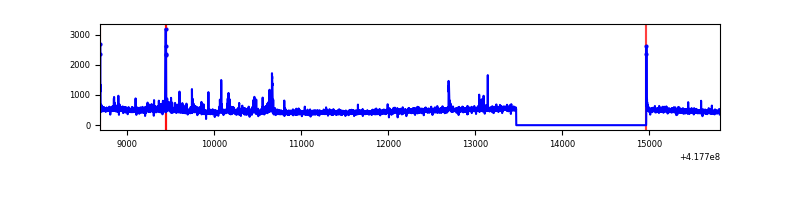 |
| D | 7119 | 5626 | 730 | 730 | 10.25% | 12.98% | 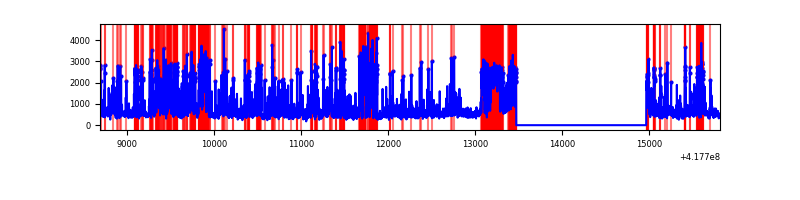 |
Top three noisy pixels from each quadrant. If the there are fewer than three noisy pixels in the level2.evt file, extra rows are filled as -1
| Pixel properties | Quadrant properties | ||||||
|---|---|---|---|---|---|---|---|
| Quadrant | DetID | PixID | Counts | Sigma | Mean | Median | Sigma |
| A | 10 | 83 | 542288 | 4272.38 | 614 | 603 | 126.8 |
| A | 12 | 189 | 134854 | 1058.87 | 614 | 603 | 126.8 |
| A | 6 | 10 | 131618 | 1033.34 | 614 | 603 | 126.8 |
| B | 4 | 171 | 361851 | 3033.0 | 609 | 593 | 119.1 |
| B | 3 | 112 | 215482 | 1804.13 | 609 | 593 | 119.1 |
| B | 15 | 85 | 116946 | 976.86 | 609 | 593 | 119.1 |
| C | 15 | 214 | 249037 | 1784.36 | 595 | 600 | 139.2 |
| C | 10 | 20 | 129620 | 926.66 | 595 | 600 | 139.2 |
| C | 0 | 10 | 17498 | 121.37 | 595 | 600 | 139.2 |
| D | 2 | 250 | 1809859 | 13918.95 | 520 | 506 | 130.0 |
| D | 12 | 227 | 1012077 | 7781.79 | 520 | 506 | 130.0 |
| D | 12 | 191 | 169999 | 1303.87 | 520 | 506 | 130.0 |
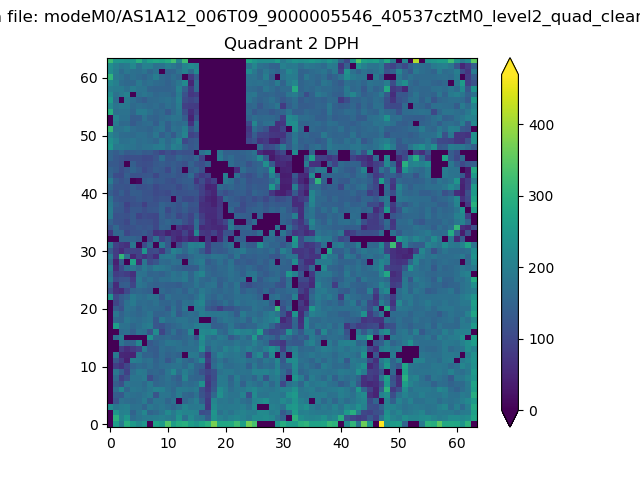
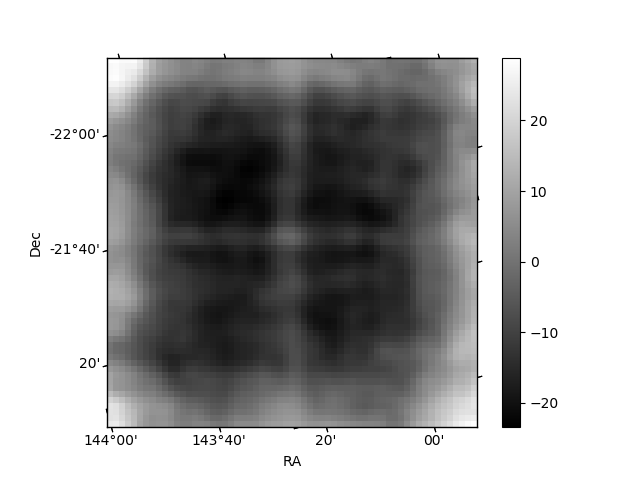
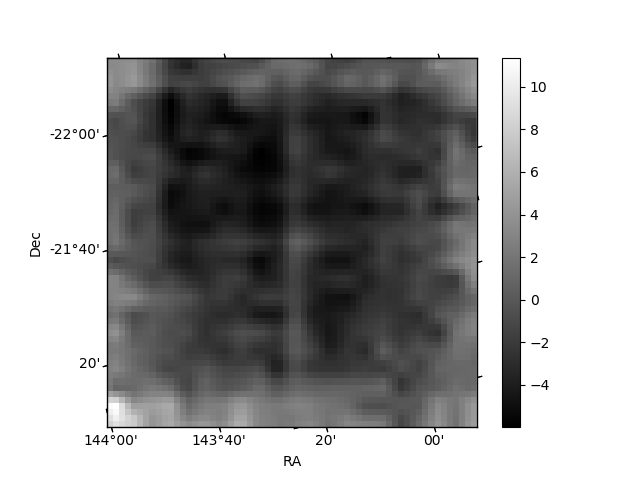
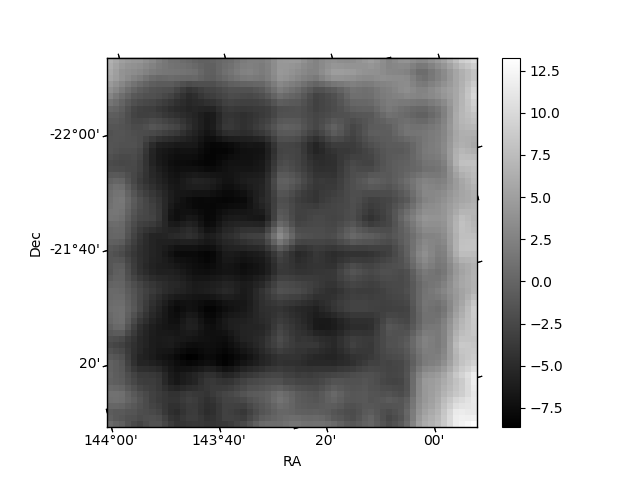
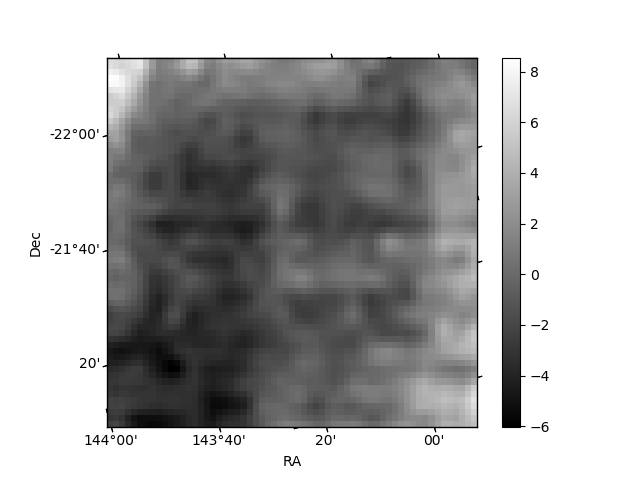
Histogram calculated using DETX and DETY for each event in the final _common_clean file
| Quadrant A | 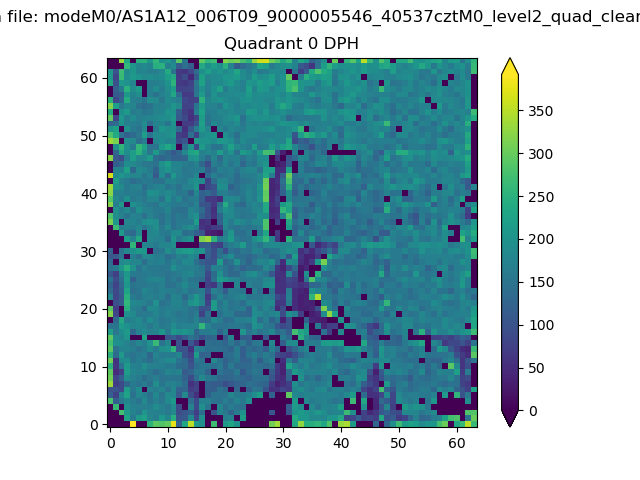 |
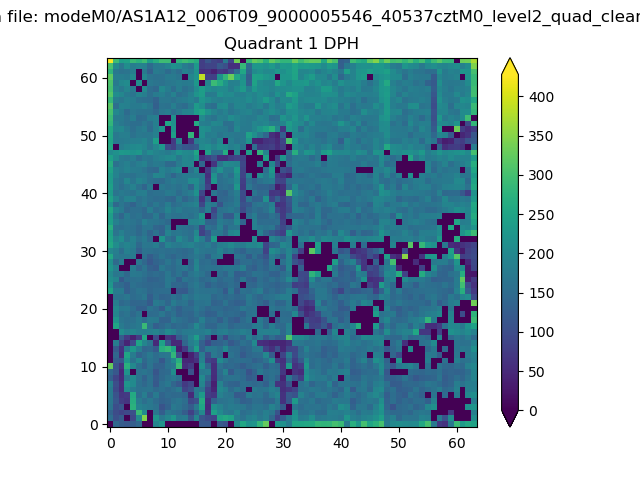 |
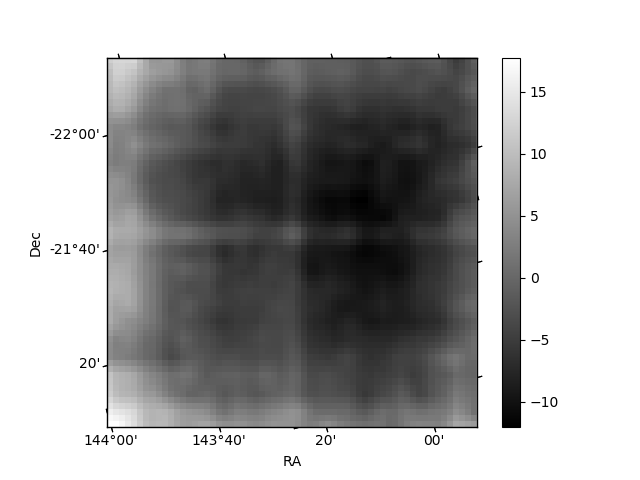
Quadrant B |
|---|---|---|---|
| Quadrant D | 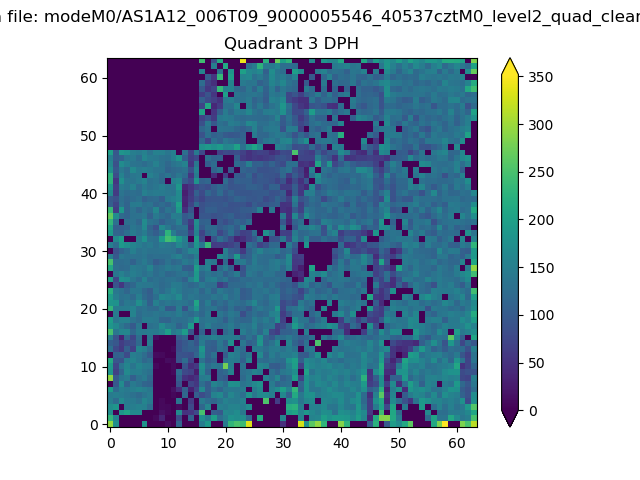 |
 |
Quadrant C |
| Plot type | Count rate plots | Images |
|---|---|---|
| Comparison with Poisson distribution Blue bars denote a histogram of data divided into 1 sec bins. Red curve is a Poisson curve with rate = median count rate of data. |
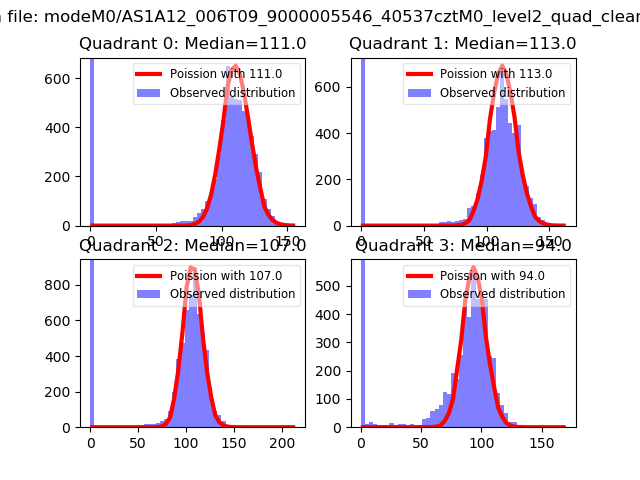 |
 |
| Quadrant-wise count rates Data is divided into 100 sec bins |
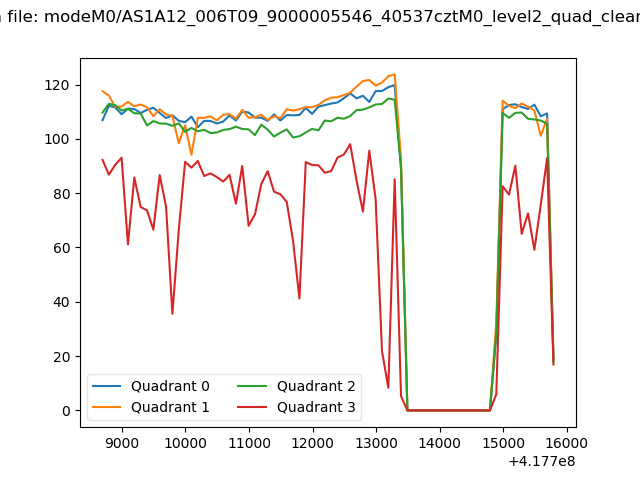 |
|
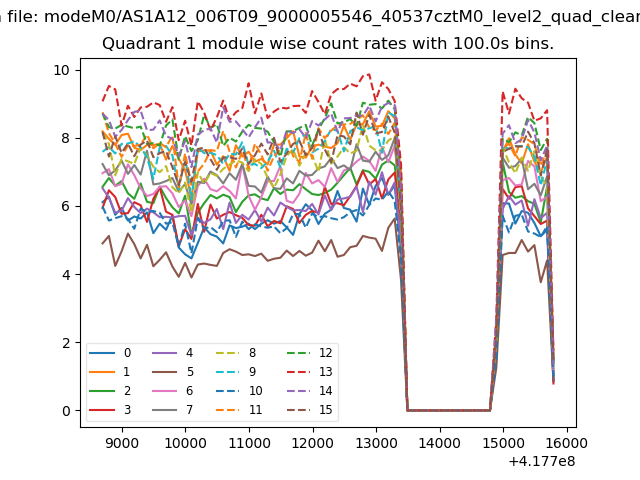
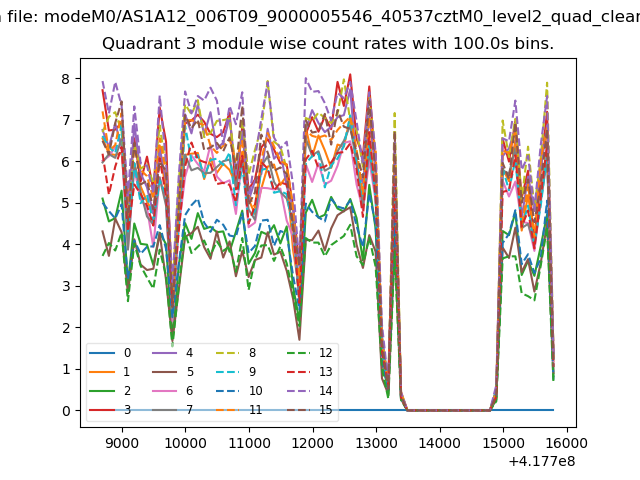
| Module-wise count rates for Quadrant A Data is divided into 100 sec bins |
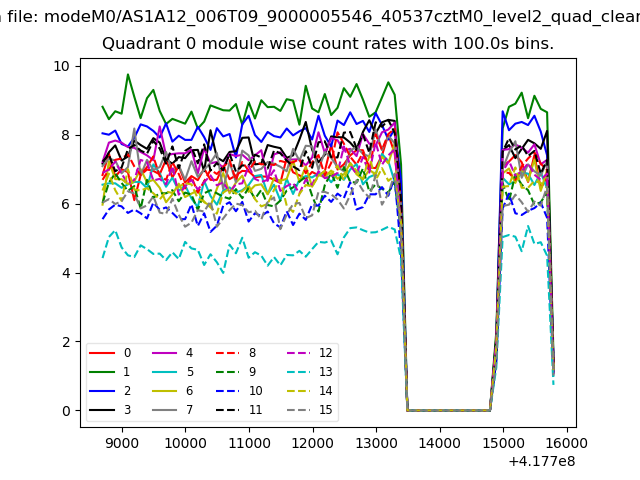 |
 |
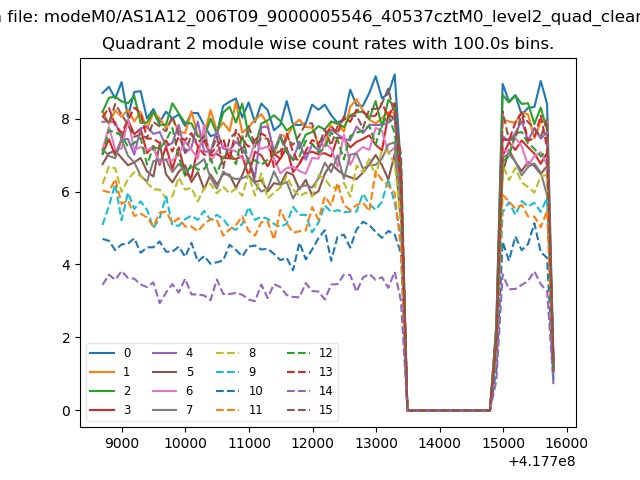
| Module-wise count rates for Quadrant B Data is divided into 100 sec bins |
 |
 |
| Module-wise count rates for Quadrant C Data is divided into 100 sec bins |
 |
 |
| Module-wise count rates for Quadrant D Data is divided into 100 sec bins |
 |
 |
| Parameter | Plot |
|---|---|
| CZT HV Monitor | 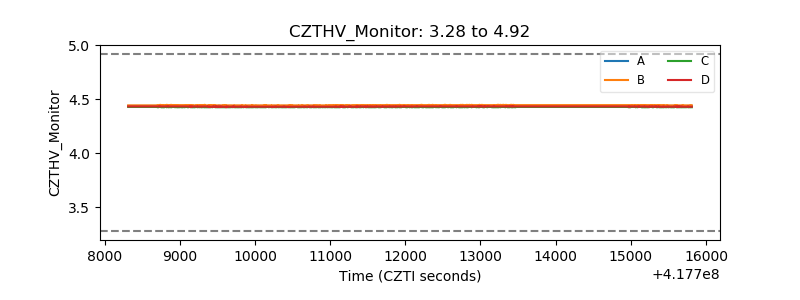 |
| D_VDD | 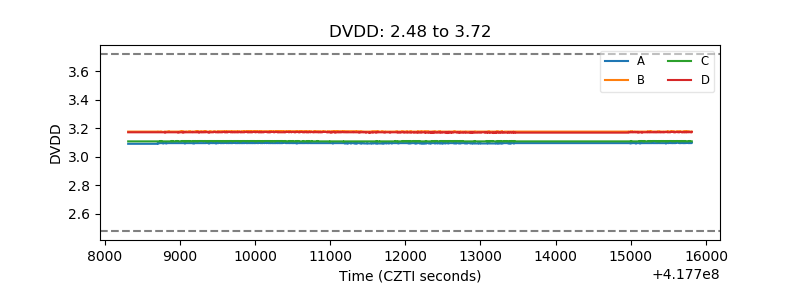 |
| Temperature 1 | 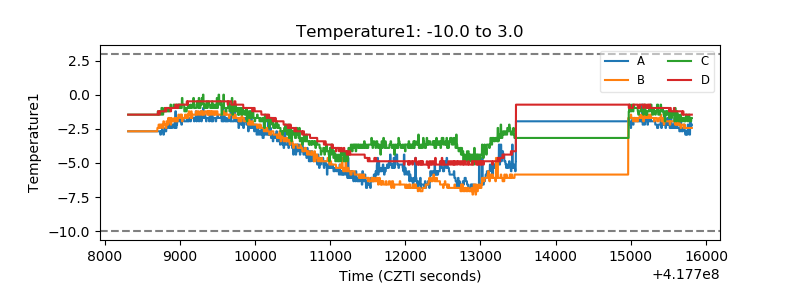 |
| Veto HV Monitor | 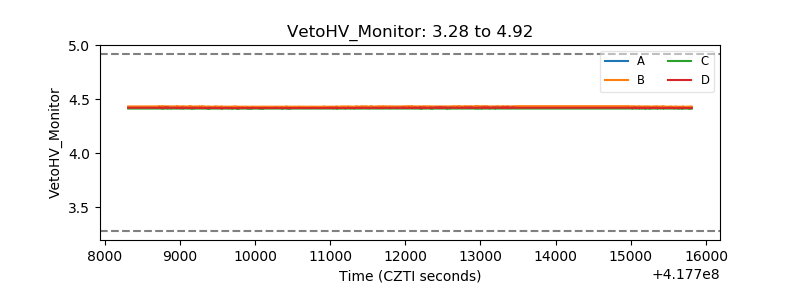 |
| Veto LLD | 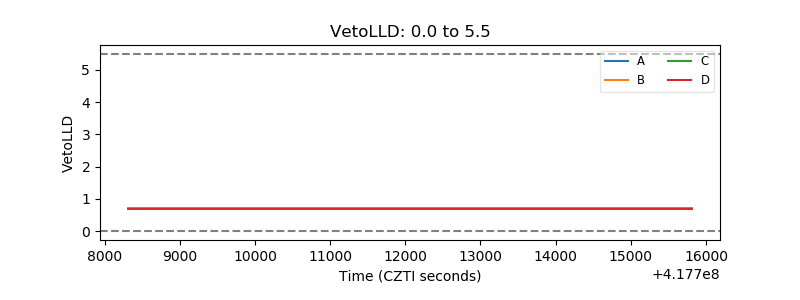 |
| Alpha Counter | 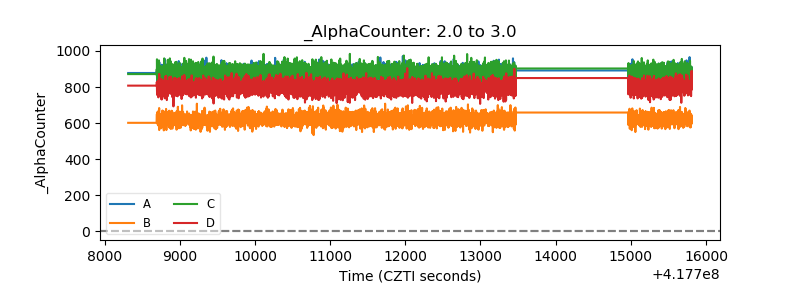 |
| _CPM_Rate | 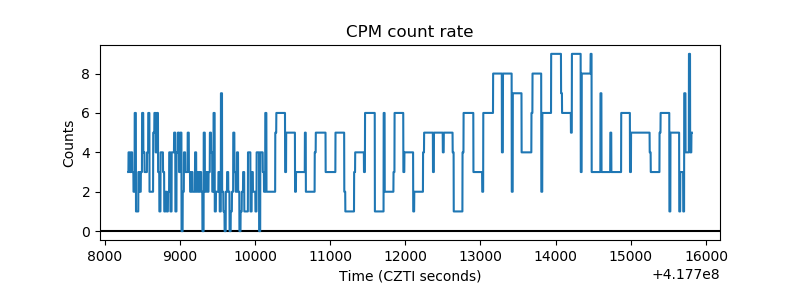 |
| CZT Counter | 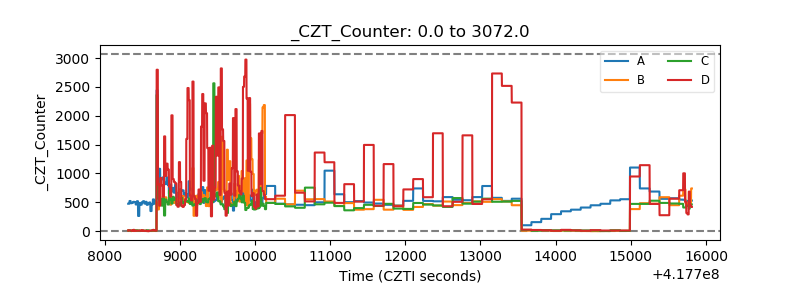 |
| +2.5 Volts monitor | 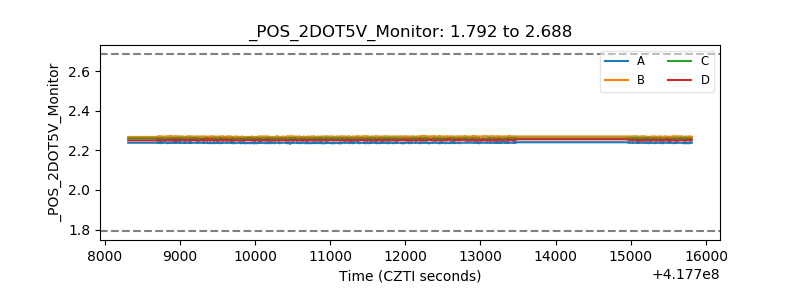 |
| +5 Volts monitor | 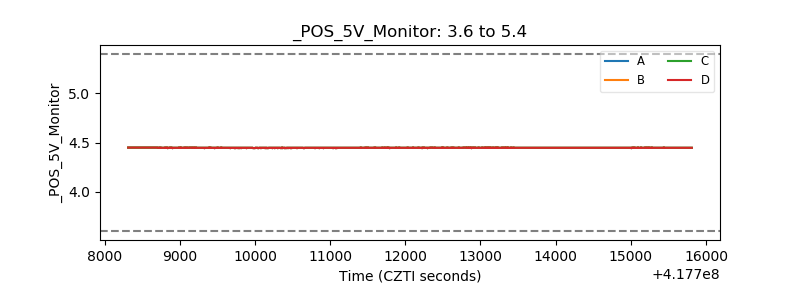 |
| _ROLL_ROT | 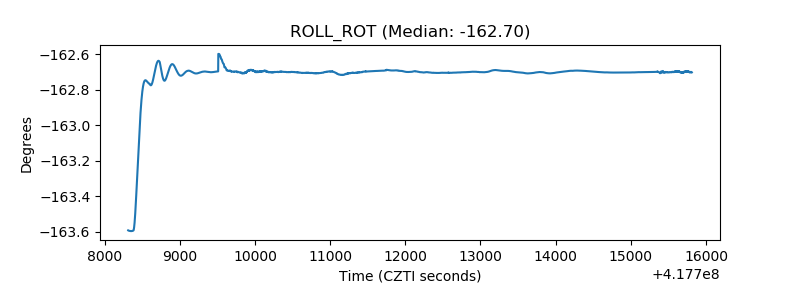 |
| _Roll_DEC | 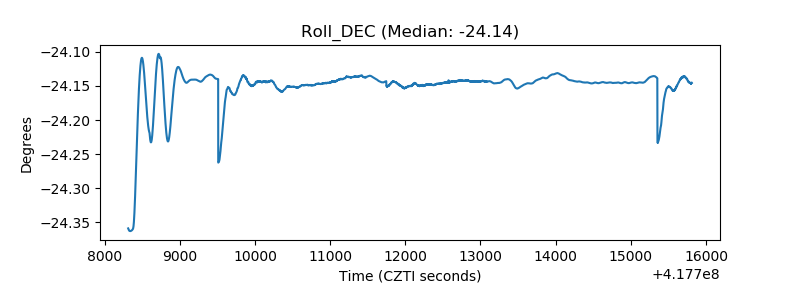 |
| _Roll_RA | 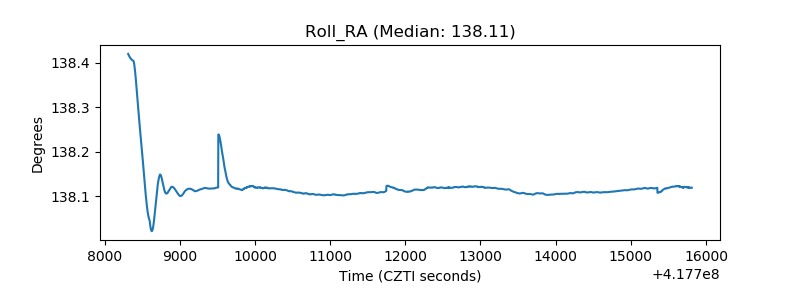 |
| Veto Counter | 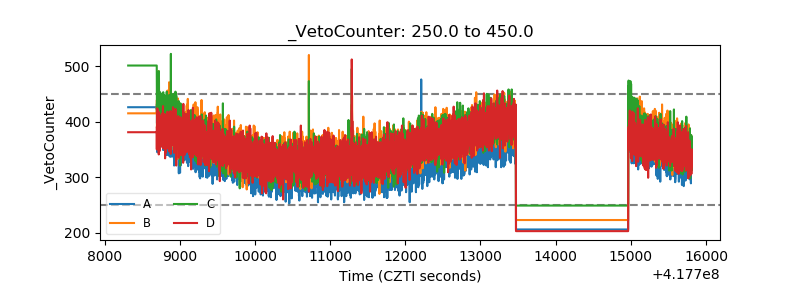 |