| Param | Original file | Final file |
|---|---|---|
| Filename | modeM0/AS1A12_006T09_9000005546_40538cztM0_level2.fits | modeM0/AS1A12_006T09_9000005546_40538cztM0_level2_quad_clean.evt |
| Size (bytes) | 396,676,800 | 91,779,840 |
| Size | 378.3 MB | 87.5 MB |
| Events in quadrant A | 3,191,936 | 642,462 |
| Events in quadrant B | 2,933,518 | 653,601 |
| Events in quadrant C | 2,753,683 | 621,267 |
| Events in quadrant D | 5,345,746 | 450,104 |
| Mode M9 | |||
|---|---|---|---|
| Quadrant | BADHDUFLAG | Total packets | Discarded packets |
| A | 0 | 20 | 0 |
| B | 0 | 20 | 0 |
| C | 0 | 20 | 0 |
| D | 0 | 21 | 0 |
| Mode M0 | |||
|---|---|---|---|
| Quadrant | BADHDUFLAG | Total packets | Discarded packets |
| A | 0 | 13084 | 3 |
| B | 0 | 12656 | 2 |
| C | 0 | 12037 | 2 |
| D | 0 | 19934 | 2 |
| Mode SS | |||
|---|---|---|---|
| Quadrant | BADHDUFLAG | Total packets | Discarded packets |
| A | 0 | 120 | 0 |
| B | 0 | 120 | 0 |
| C | 0 | 120 | 0 |
| D | 0 | 120 | 0 |
| Quadrant | Total seconds | Saturated seconds | Saturation percentage |
|---|---|---|---|
| A | 5885 | 11 | 0.186916% |
| B | 5885 | 50 | 0.849618% |
| C | 5885 | 9 | 0.152931% |
| D | 5885 | 1507 | 25.607477% |
Noise dominated data is calculated using 1-second bins in cleaned event files. If a bin has >2000 counts, and if more than 50% of those come from <1% of pixels, then it is considered to be noise-dominated and hence unusable.
| Quadrant | # 1 sec bins | Bins with >0 counts | Bins with >2000 counts | High rate bins dominated by noise | Noise dominated (total time) | Noise dominated (detector-on time) | Marked lightcurve |
|---|---|---|---|---|---|---|---|
| A | 7198 | 5886 | 5 | 5 | 0.07% | 0.08% | 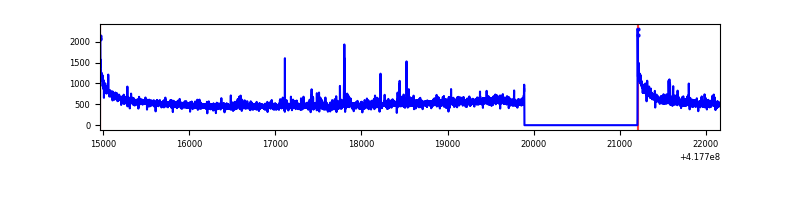 |
| B | 7198 | 5886 | 27 | 27 | 0.38% | 0.46% | 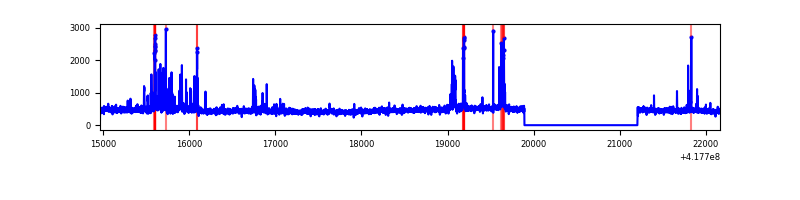 |
| C | 7198 | 5886 | 4 | 4 | 0.06% | 0.07% | 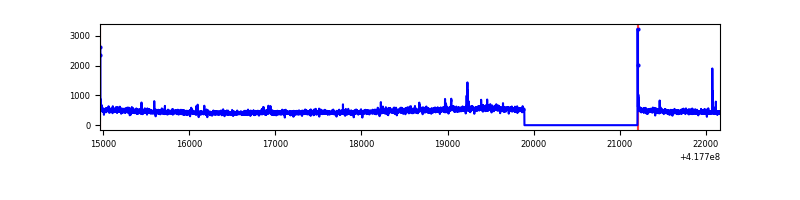 |
| D | 7197 | 5885 | 502 | 502 | 6.98% | 8.53% | 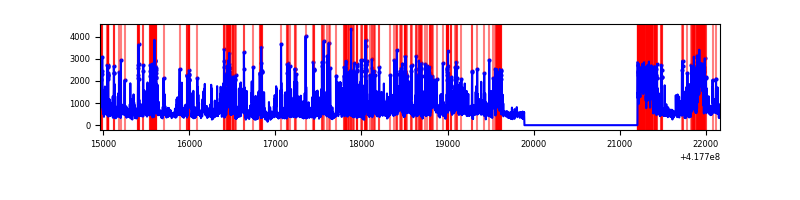 |
Top three noisy pixels from each quadrant. If the there are fewer than three noisy pixels in the level2.evt file, extra rows are filled as -1
| Pixel properties | Quadrant properties | ||||||
|---|---|---|---|---|---|---|---|
| Quadrant | DetID | PixID | Counts | Sigma | Mean | Median | Sigma |
| A | 10 | 83 | 553755 | 4167.53 | 644 | 631 | 132.7 |
| A | 12 | 189 | 96000 | 718.56 | 644 | 631 | 132.7 |
| A | 3 | 1 | 16404 | 118.84 | 644 | 631 | 132.7 |
| B | 15 | 85 | 166824 | 1337.38 | 638 | 619 | 124.3 |
| B | 0 | 156 | 101135 | 808.81 | 638 | 619 | 124.3 |
| B | 3 | 112 | 88818 | 709.7 | 638 | 619 | 124.3 |
| C | 15 | 214 | 258624 | 1749.25 | 623 | 626 | 147.5 |
| C | 10 | 20 | 24750 | 163.56 | 623 | 626 | 147.5 |
| C | 0 | 10 | 18804 | 123.25 | 623 | 626 | 147.5 |
| D | 2 | 250 | 1185039 | 8637.38 | 551 | 536 | 137.1 |
| D | 12 | 227 | 1075976 | 7842.09 | 551 | 536 | 137.1 |
| D | 12 | 6 | 284895 | 2073.54 | 551 | 536 | 137.1 |
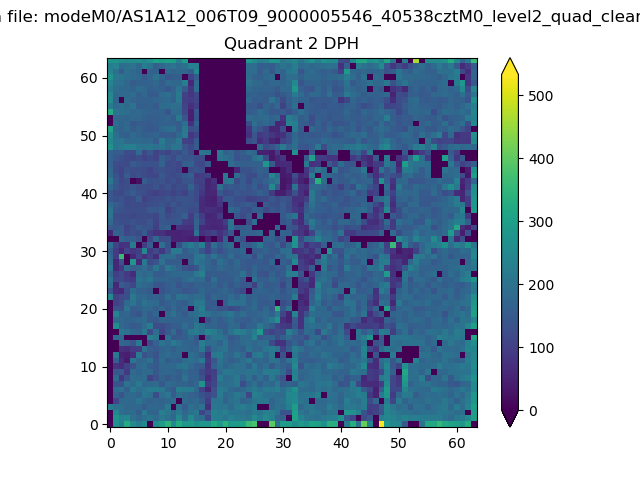
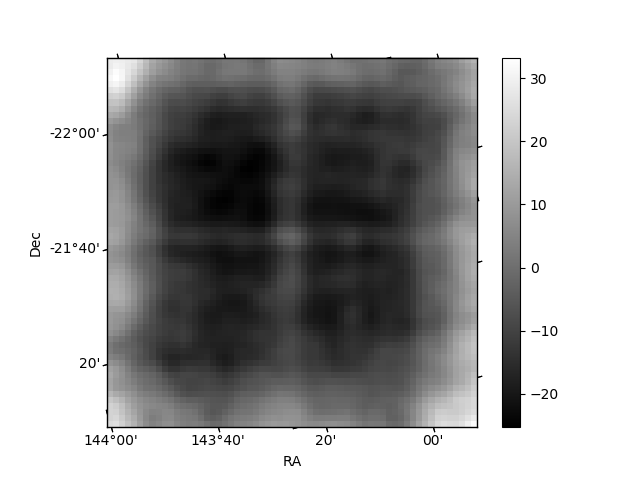
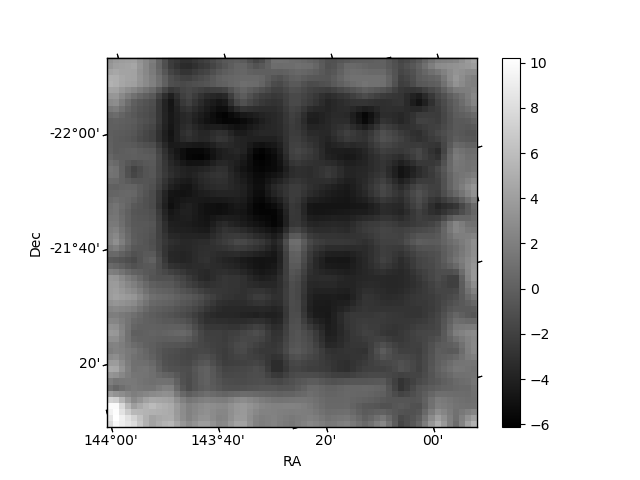
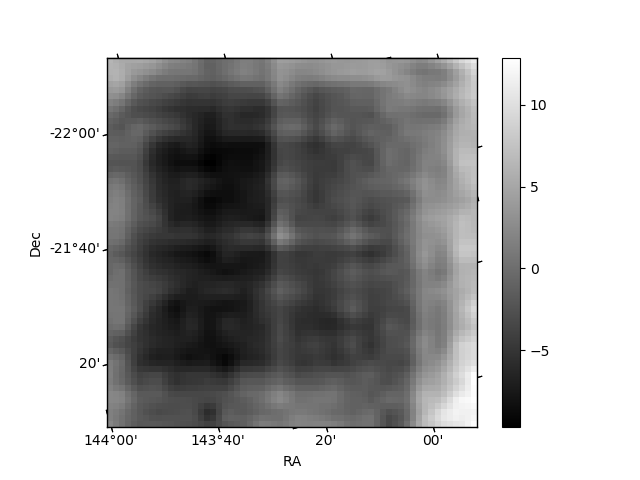
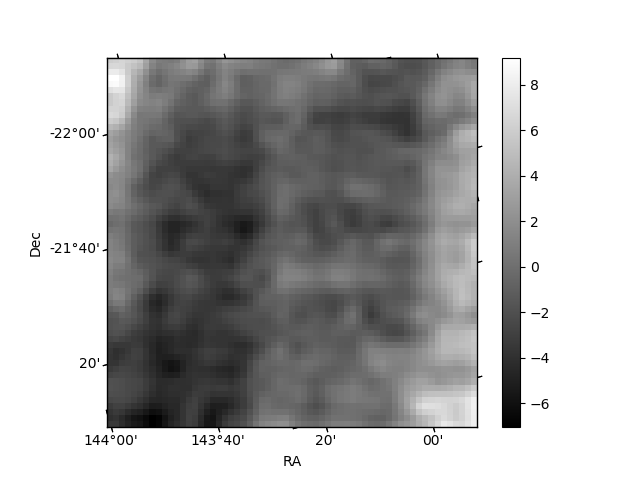
Histogram calculated using DETX and DETY for each event in the final _common_clean file
| Quadrant A | 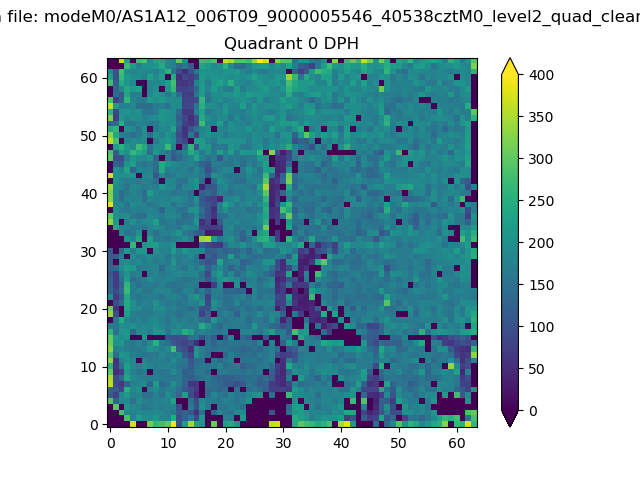 |
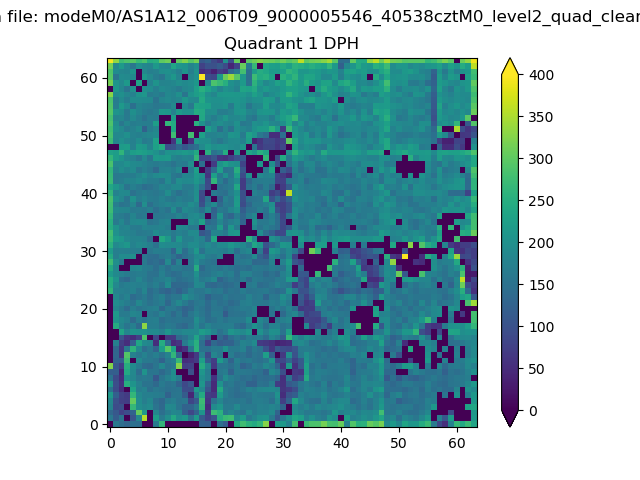 |
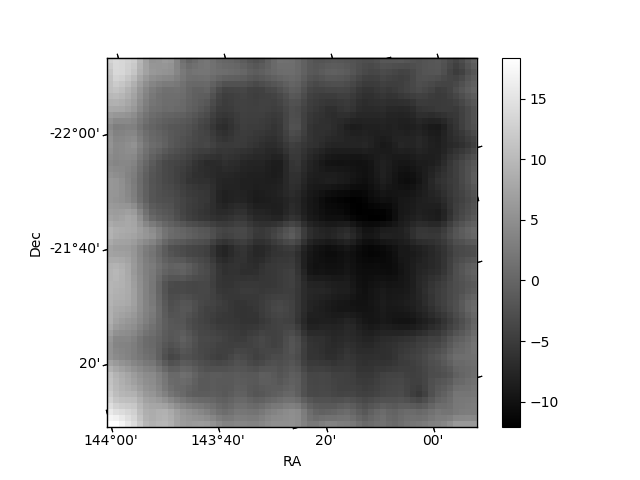
Quadrant B |
|---|---|---|---|
| Quadrant D | 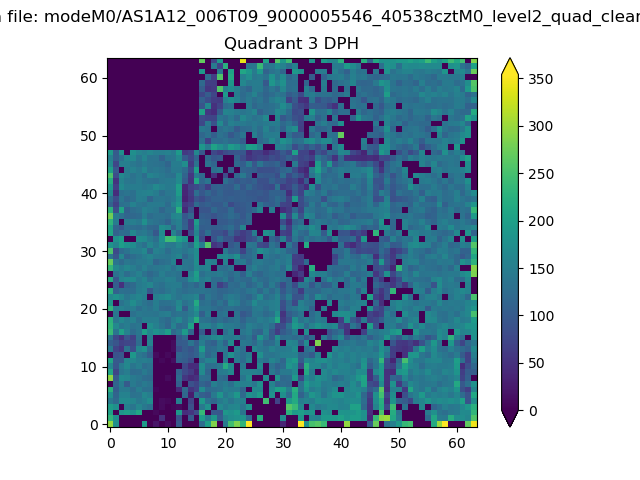 |
 |
Quadrant C |
| Plot type | Count rate plots | Images |
|---|---|---|
| Comparison with Poisson distribution Blue bars denote a histogram of data divided into 1 sec bins. Red curve is a Poisson curve with rate = median count rate of data. |
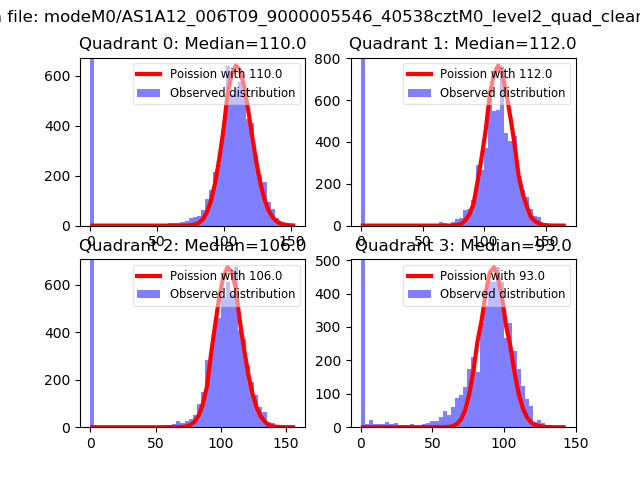 |
 |
| Quadrant-wise count rates Data is divided into 100 sec bins |
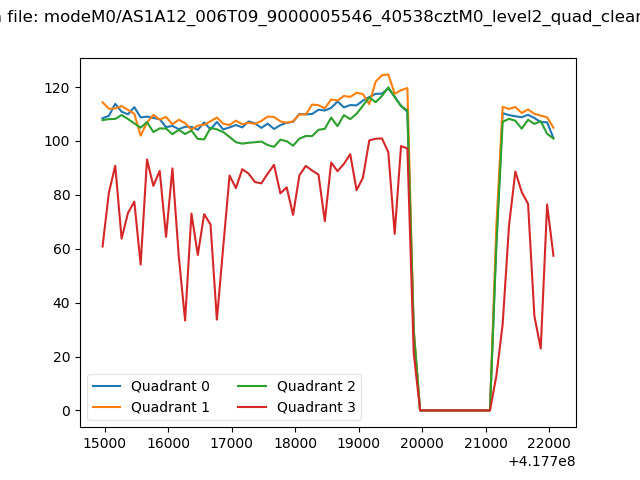 |
|
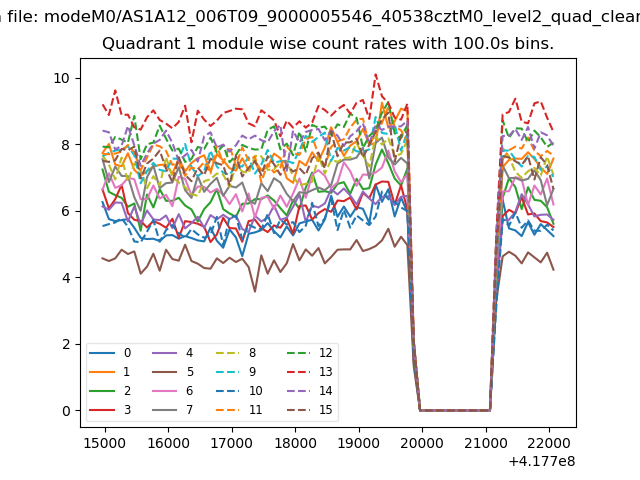
| Module-wise count rates for Quadrant A Data is divided into 100 sec bins |
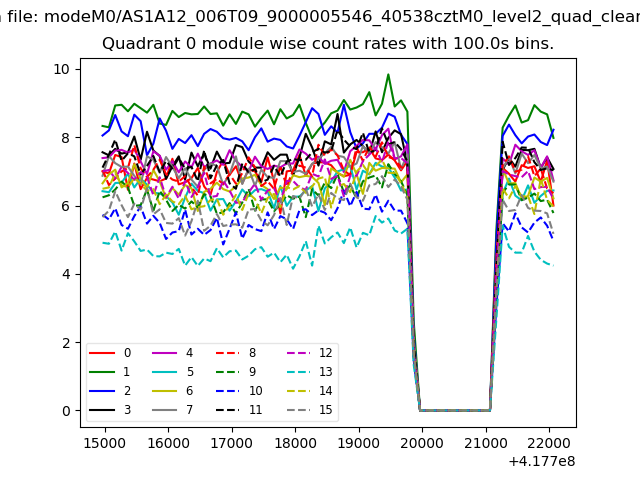 |
 |
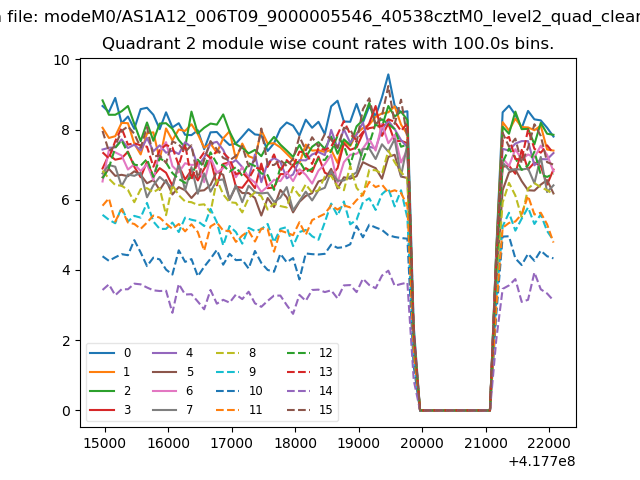
| Module-wise count rates for Quadrant B Data is divided into 100 sec bins |
 |
 |
| Module-wise count rates for Quadrant C Data is divided into 100 sec bins |
 |
 |
| Module-wise count rates for Quadrant D Data is divided into 100 sec bins |
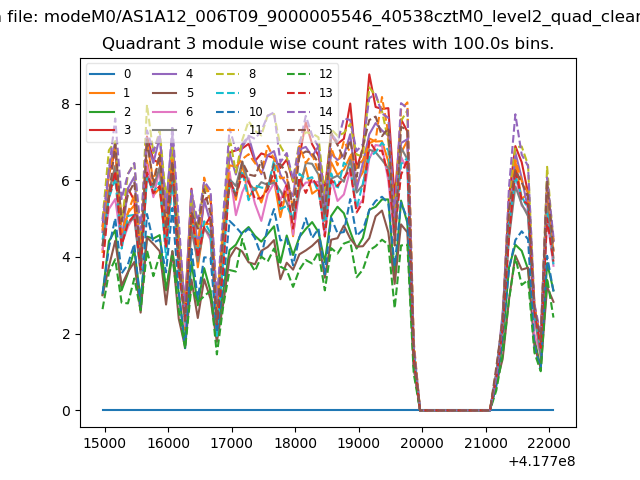 |
 |
| Parameter | Plot |
|---|---|
| CZT HV Monitor | 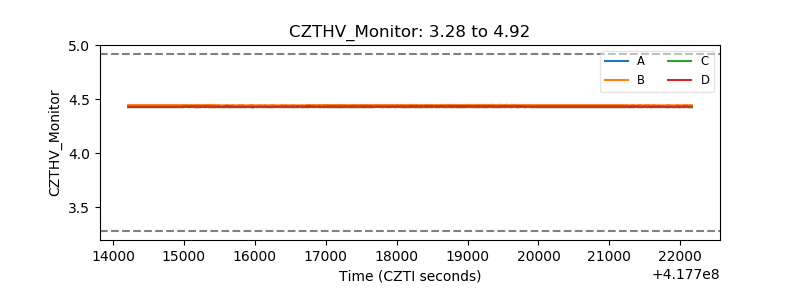 |
| D_VDD | 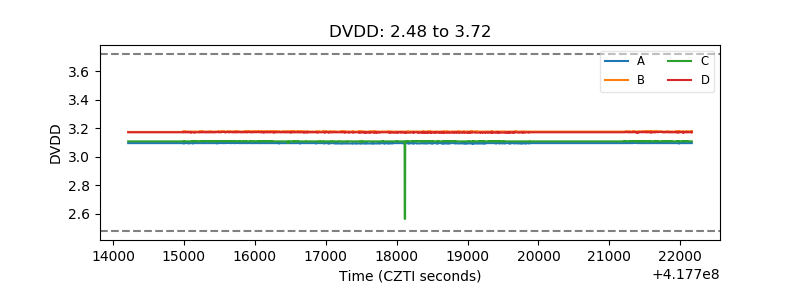 |
| Temperature 1 | 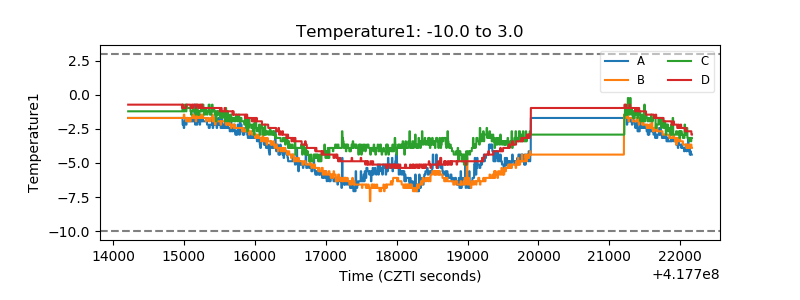 |
| Veto HV Monitor | 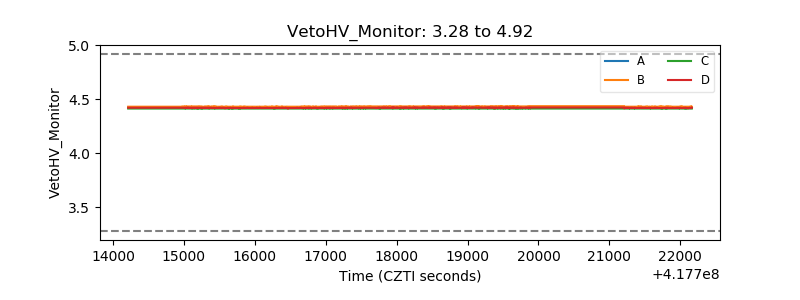 |
| Veto LLD | 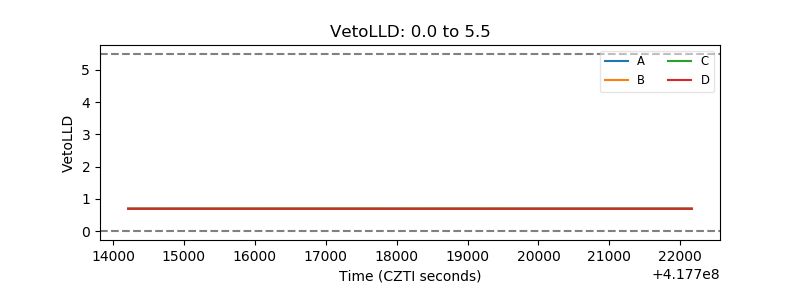 |
| Alpha Counter | 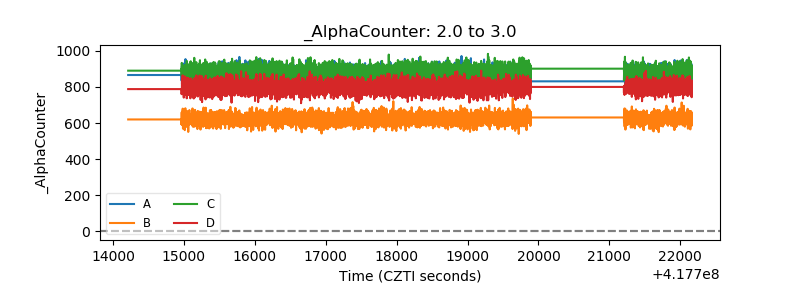 |
| _CPM_Rate | 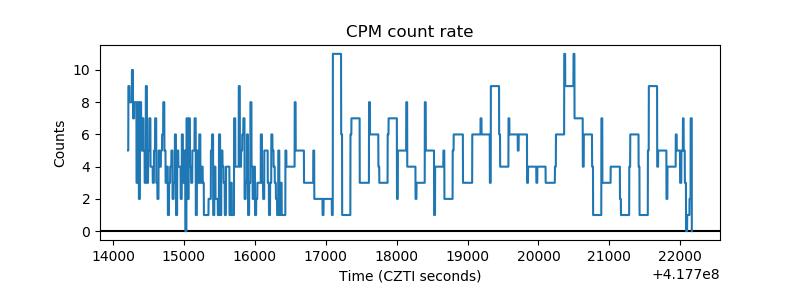 |
| CZT Counter |  |
| +2.5 Volts monitor | 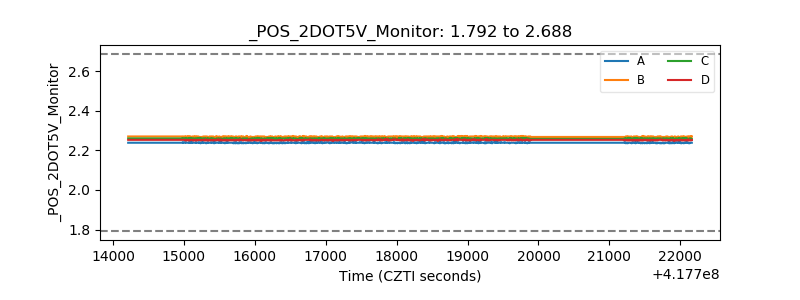 |
| +5 Volts monitor | 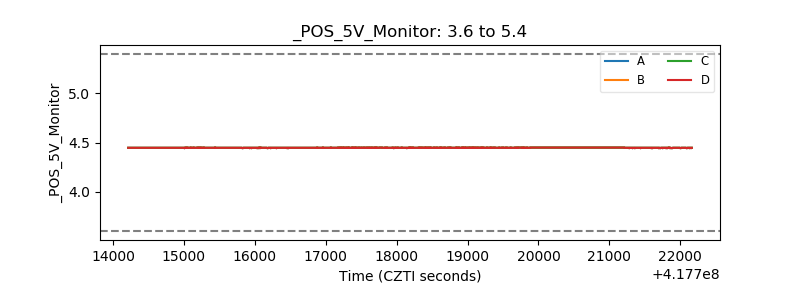 |
| _ROLL_ROT | 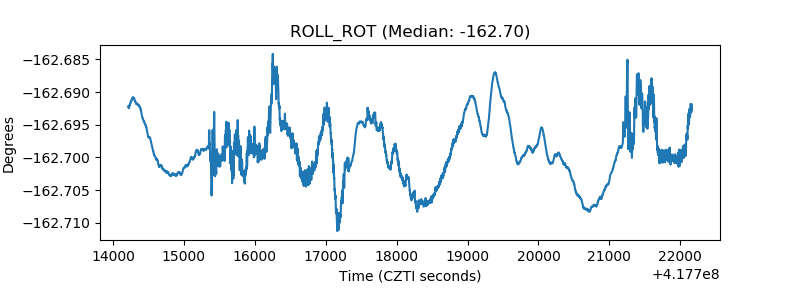 |
| _Roll_DEC | 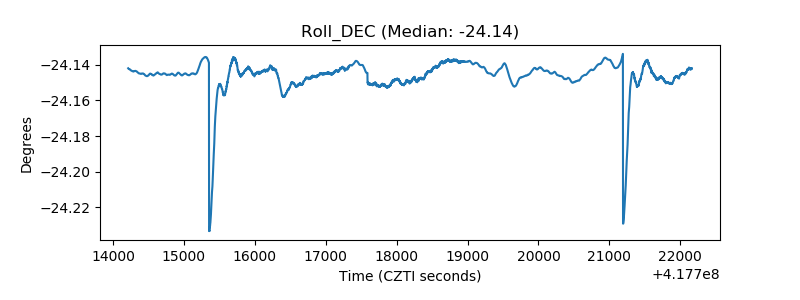 |
| _Roll_RA | 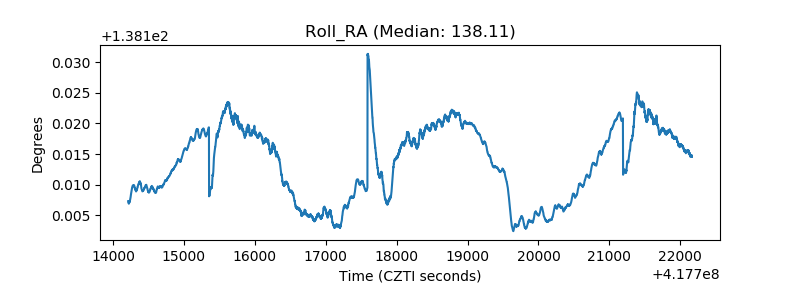 |
| Veto Counter | 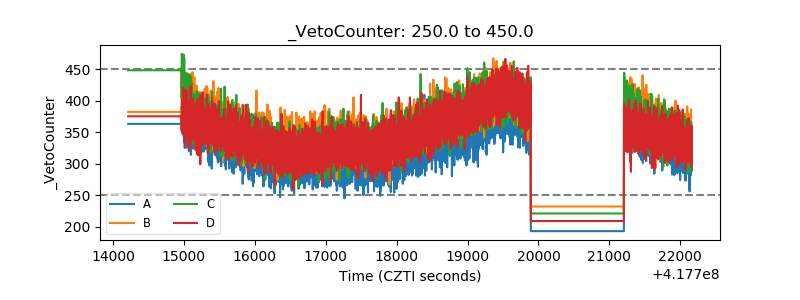 |