| Param | Original file | Final file |
|---|---|---|
| Filename | modeM0/AS1A12_006T09_9000005546_40541cztM0_level2.fits | modeM0/AS1A12_006T09_9000005546_40541cztM0_level2_quad_clean.evt |
| Size (bytes) | 392,080,320 | 90,207,360 |
| Size | 373.9 MB | 86.0 MB |
| Events in quadrant A | 3,168,962 | 630,293 |
| Events in quadrant B | 3,329,943 | 640,642 |
| Events in quadrant C | 2,950,963 | 607,592 |
| Events in quadrant D | 4,613,036 | 448,630 |
| Mode M9 | |||
|---|---|---|---|
| Quadrant | BADHDUFLAG | Total packets | Discarded packets |
| A | 0 | 18 | 0 |
| B | 0 | 18 | 0 |
| C | 0 | 18 | 0 |
| D | 0 | 19 | 0 |
| Mode M0 | |||
|---|---|---|---|
| Quadrant | BADHDUFLAG | Total packets | Discarded packets |
| A | 0 | 12943 | 2 |
| B | 0 | 13799 | 2 |
| C | 0 | 12653 | 2 |
| D | 0 | 17613 | 2 |
| Mode SS | |||
|---|---|---|---|
| Quadrant | BADHDUFLAG | Total packets | Discarded packets |
| A | 0 | 118 | 0 |
| B | 0 | 118 | 0 |
| C | 0 | 118 | 0 |
| D | 0 | 118 | 0 |
| Quadrant | Total seconds | Saturated seconds | Saturation percentage |
|---|---|---|---|
| A | 5779 | 14 | 0.242256% |
| B | 5779 | 84 | 1.453539% |
| C | 5779 | 35 | 0.605641% |
| D | 5779 | 1358 | 23.498875% |
Noise dominated data is calculated using 1-second bins in cleaned event files. If a bin has >2000 counts, and if more than 50% of those come from <1% of pixels, then it is considered to be noise-dominated and hence unusable.
| Quadrant | # 1 sec bins | Bins with >0 counts | Bins with >2000 counts | High rate bins dominated by noise | Noise dominated (total time) | Noise dominated (detector-on time) | Marked lightcurve |
|---|---|---|---|---|---|---|---|
| A | 7061 | 5780 | 6 | 6 | 0.08% | 0.10% | 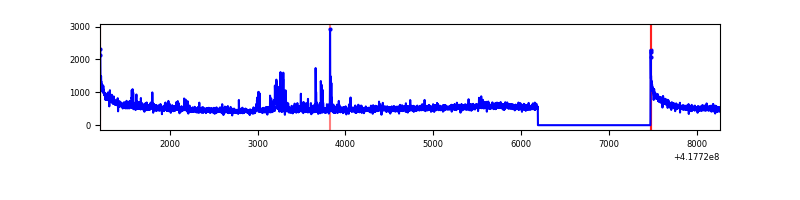 |
| B | 7061 | 5780 | 44 | 44 | 0.62% | 0.76% | 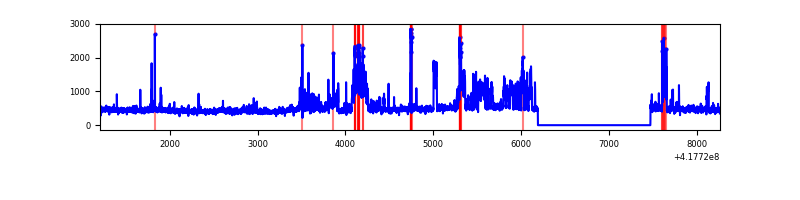 |
| C | 7061 | 5780 | 18 | 18 | 0.25% | 0.31% | 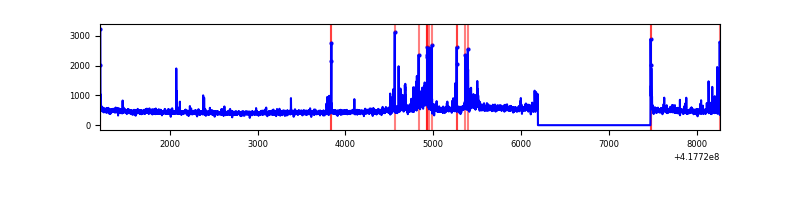 |
| D | 7061 | 5780 | 436 | 436 | 6.17% | 7.54% | 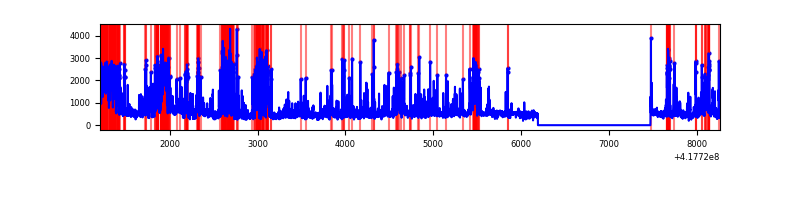 |
Top three noisy pixels from each quadrant. If the there are fewer than three noisy pixels in the level2.evt file, extra rows are filled as -1
| Pixel properties | Quadrant properties | ||||||
|---|---|---|---|---|---|---|---|
| Quadrant | DetID | PixID | Counts | Sigma | Mean | Median | Sigma |
| A | 10 | 83 | 534620 | 4032.22 | 634 | 621 | 132.4 |
| A | 12 | 189 | 144389 | 1085.59 | 634 | 621 | 132.4 |
| A | 3 | 1 | 24743 | 182.14 | 634 | 621 | 132.4 |
| B | 7 | 202 | 660730 | 5354.77 | 628 | 609 | 123.3 |
| B | 3 | 112 | 83404 | 671.62 | 628 | 609 | 123.3 |
| B | 0 | 156 | 30116 | 239.35 | 628 | 609 | 123.3 |
| C | 15 | 214 | 252012 | 1731.78 | 614 | 618 | 145.2 |
| C | 14 | 254 | 193594 | 1329.35 | 614 | 618 | 145.2 |
| C | 10 | 20 | 84062 | 574.82 | 614 | 618 | 145.2 |
| D | 2 | 250 | 1375154 | 9962.78 | 548 | 532 | 138.0 |
| D | 12 | 227 | 552672 | 4001.72 | 548 | 532 | 138.0 |
| D | 12 | 6 | 216379 | 1564.38 | 548 | 532 | 138.0 |
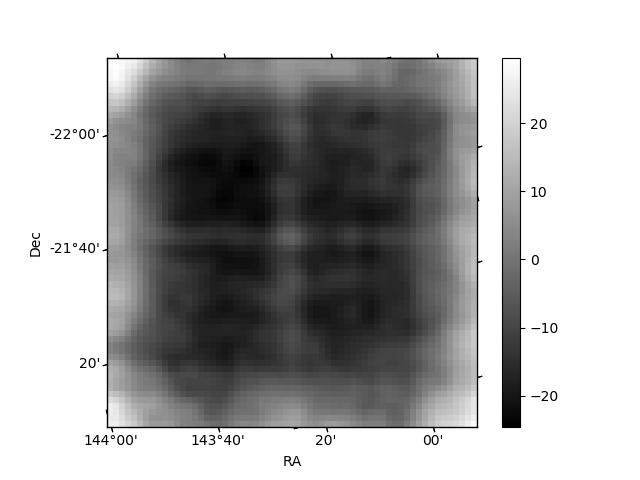
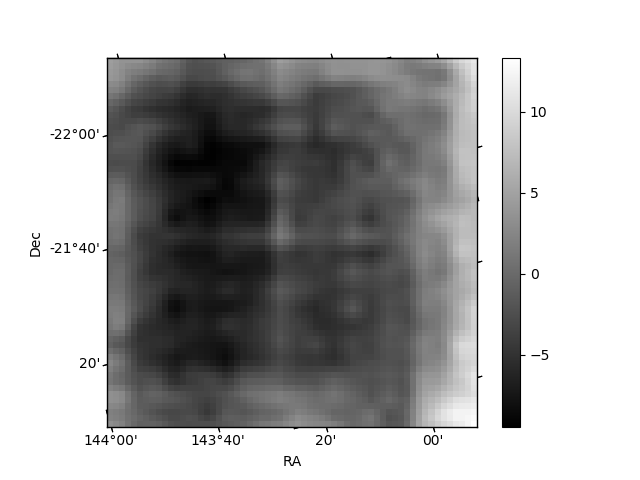
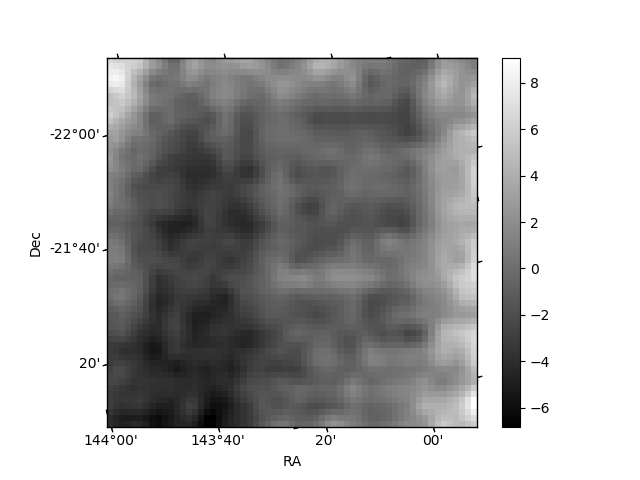
Histogram calculated using DETX and DETY for each event in the final _common_clean file
| Quadrant A | 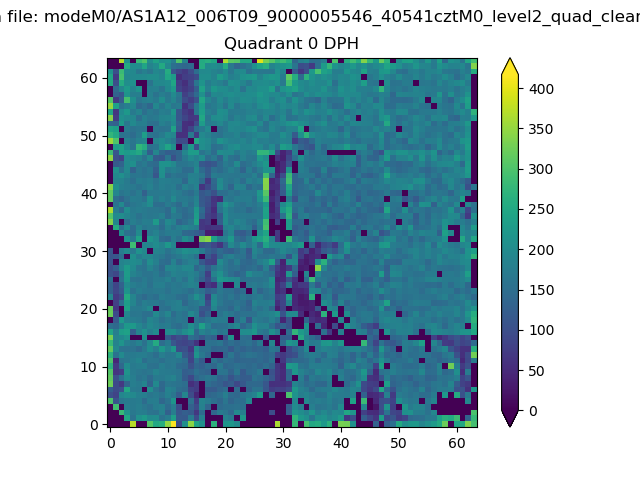 |
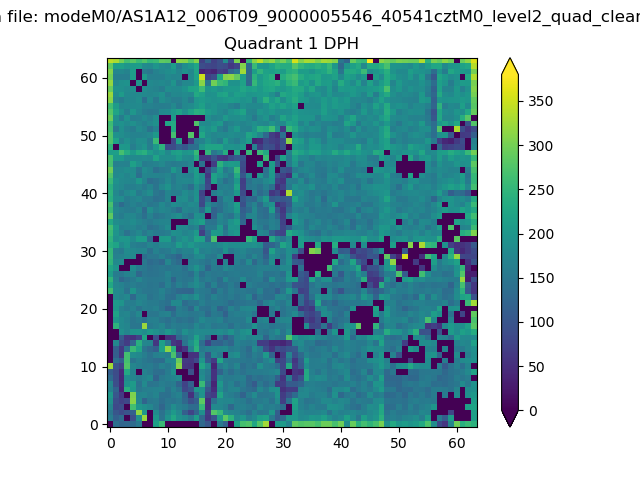 |
Quadrant B |
|---|---|---|---|
| Quadrant D | 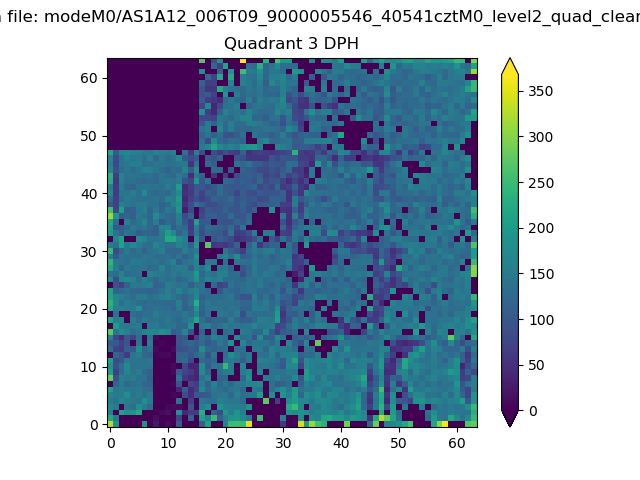 |
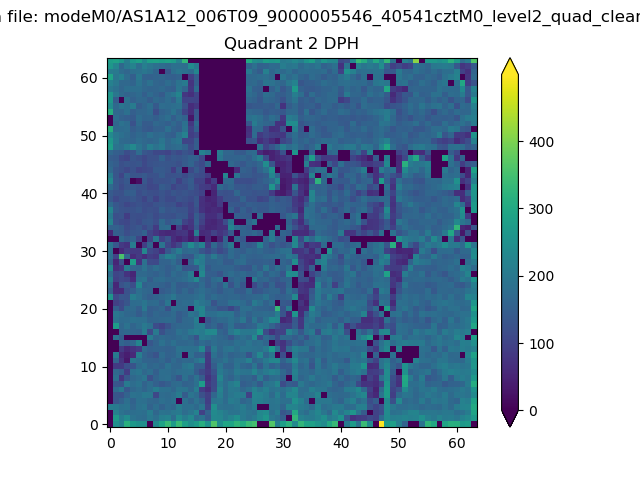 |
Quadrant C |
| Plot type | Count rate plots | Images |
|---|---|---|
| Comparison with Poisson distribution Blue bars denote a histogram of data divided into 1 sec bins. Red curve is a Poisson curve with rate = median count rate of data. |
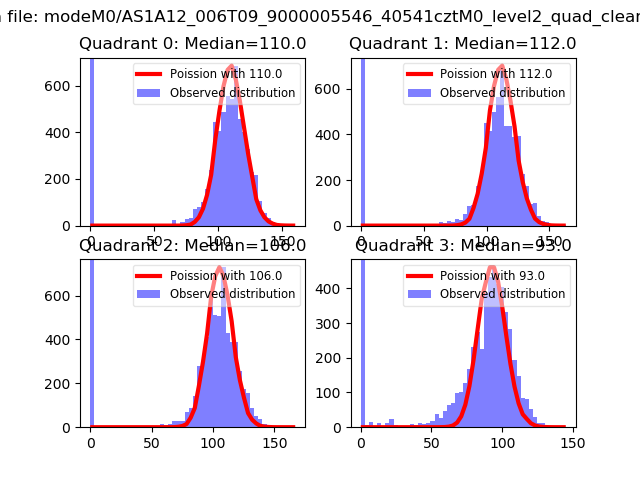 |
 |
| Quadrant-wise count rates Data is divided into 100 sec bins |
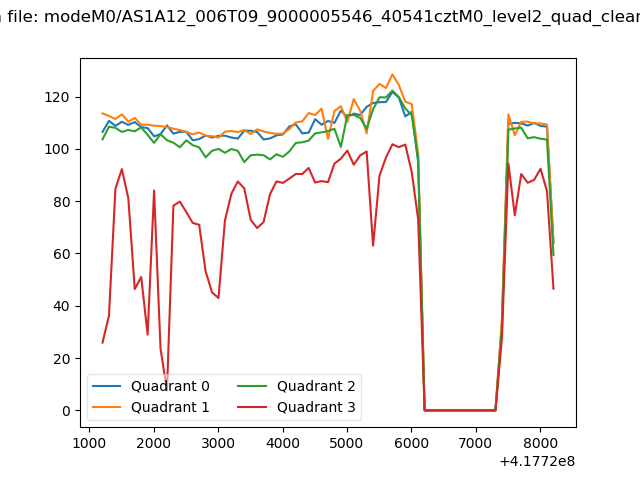 |
|
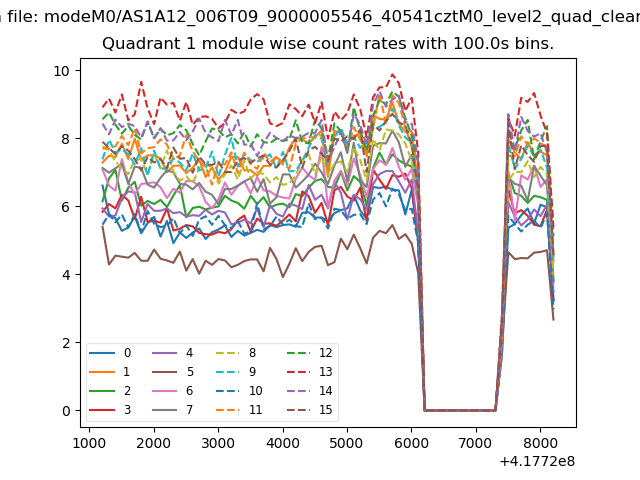
| Module-wise count rates for Quadrant A Data is divided into 100 sec bins |
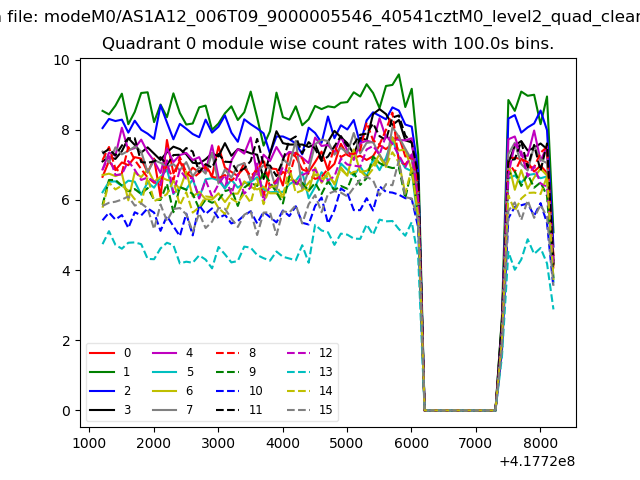 |
 |
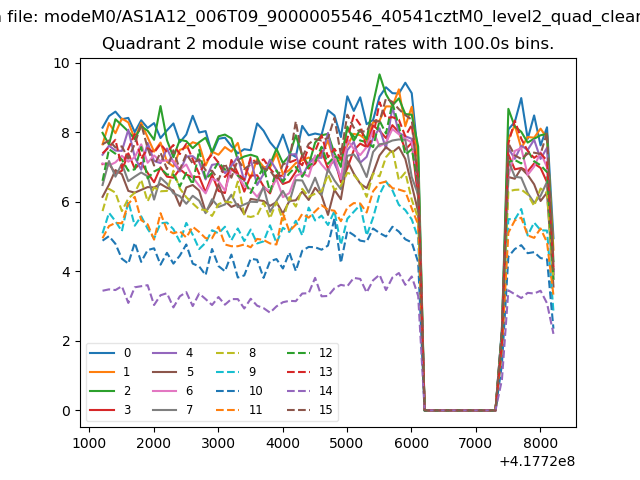
| Module-wise count rates for Quadrant B Data is divided into 100 sec bins |
 |
 |
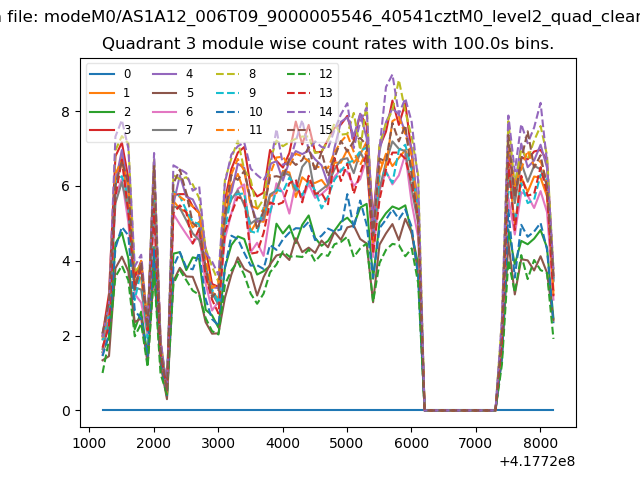
| Module-wise count rates for Quadrant C Data is divided into 100 sec bins |
 |
 |
| Module-wise count rates for Quadrant D Data is divided into 100 sec bins |
 |
 |
| Parameter | Plot |
|---|---|
| CZT HV Monitor | 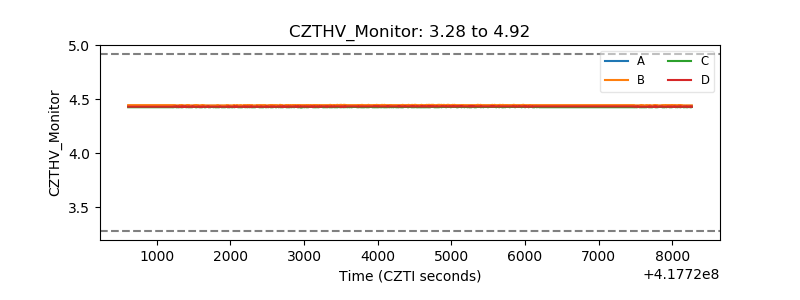 |
| D_VDD | 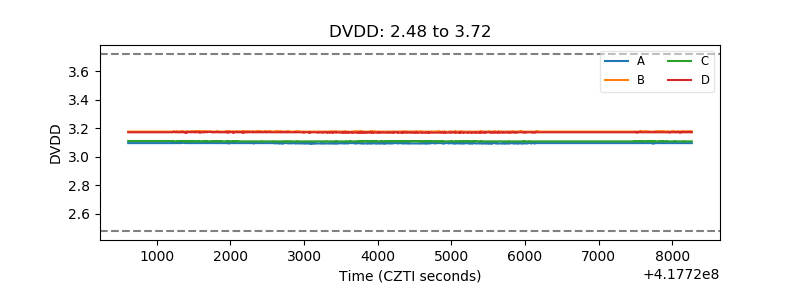 |
| Temperature 1 | 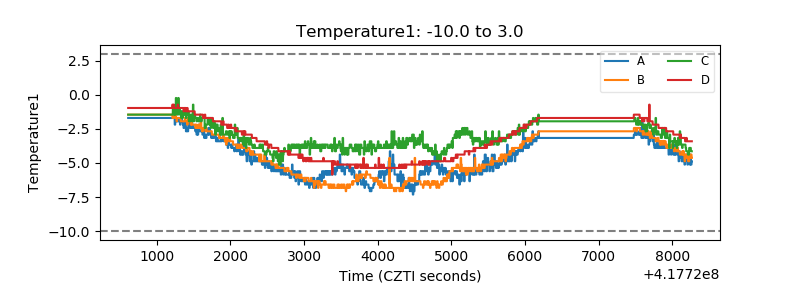 |
| Veto HV Monitor | 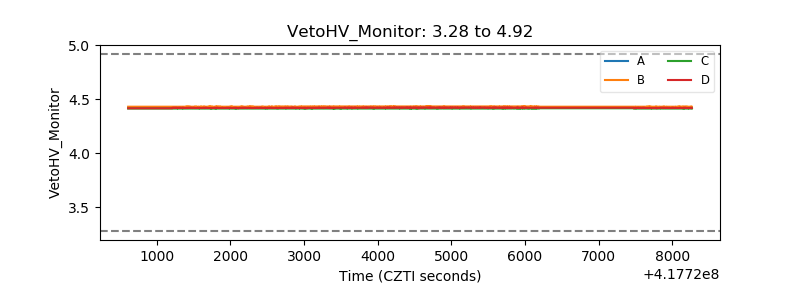 |
| Veto LLD | 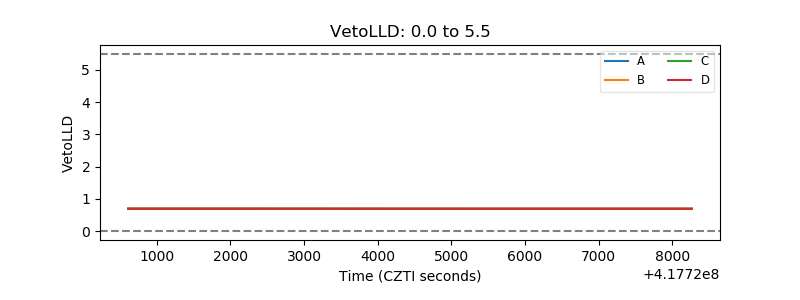 |
| Alpha Counter | 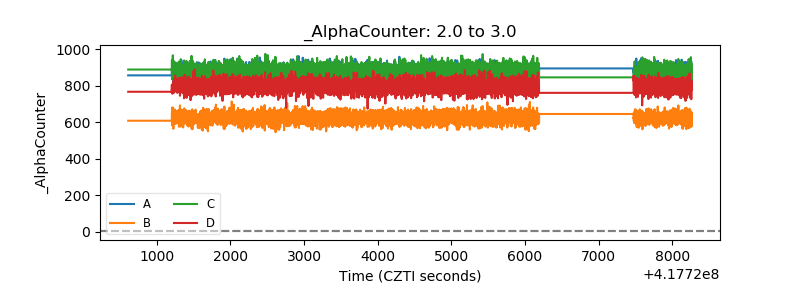 |
| _CPM_Rate | 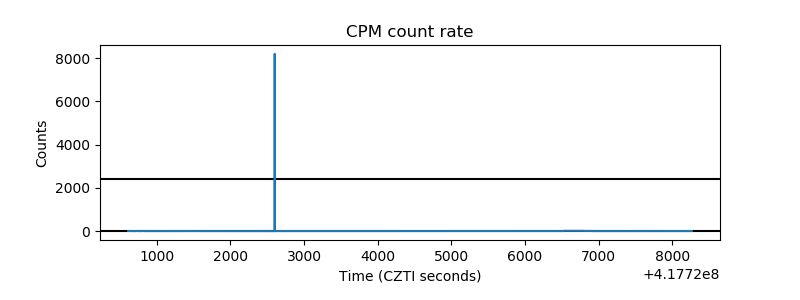 |
| CZT Counter | 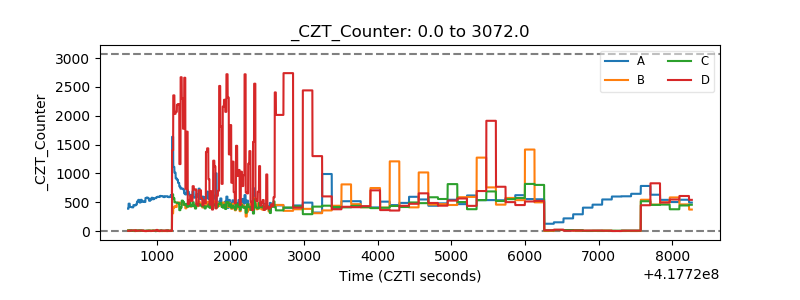 |
| +2.5 Volts monitor | 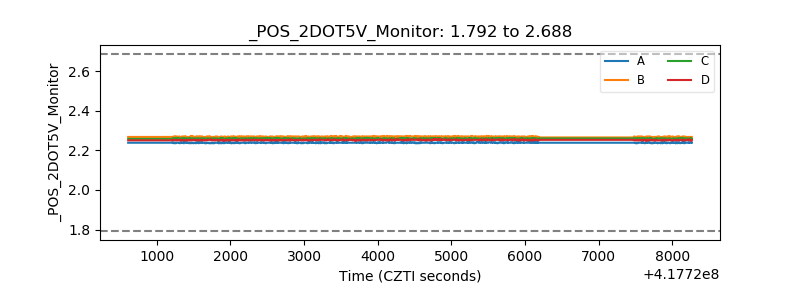 |
| +5 Volts monitor | 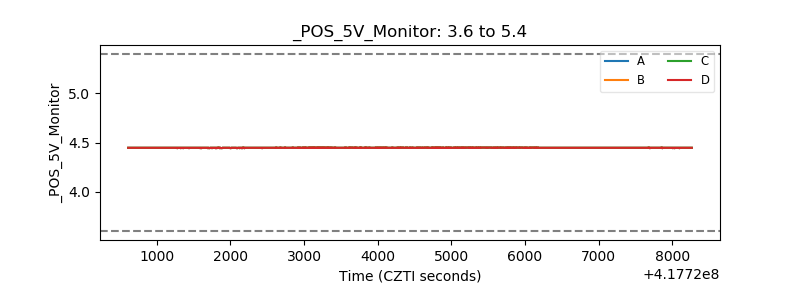 |
| _ROLL_ROT | 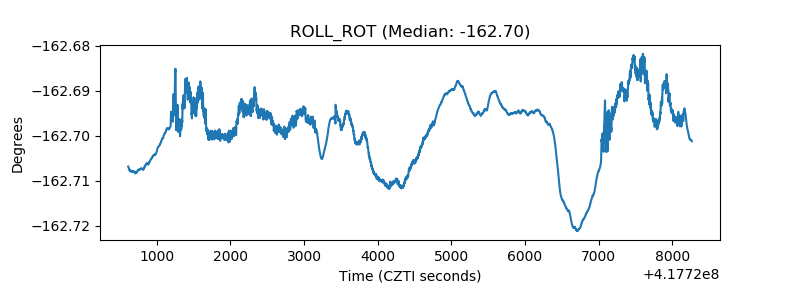 |
| _Roll_DEC | 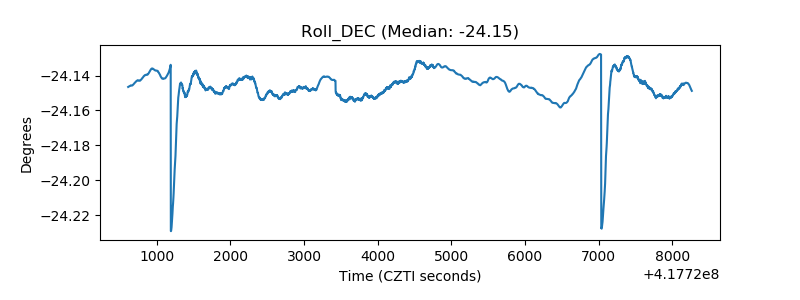 |
| _Roll_RA | 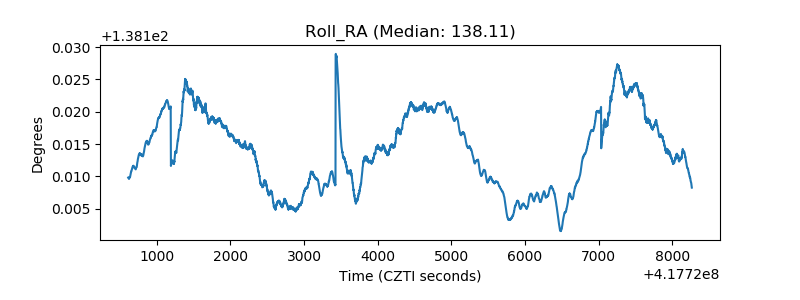 |
| Veto Counter | 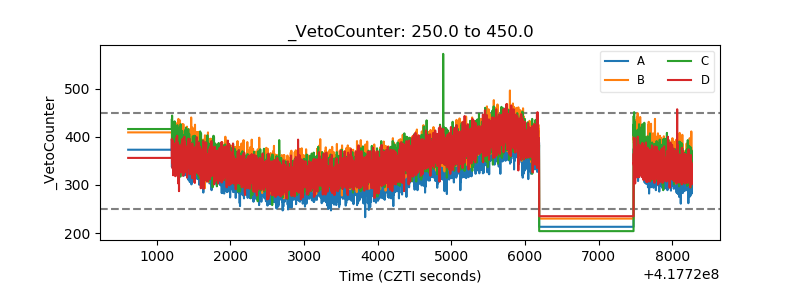 |