| Param | Original file | Final file |
|---|---|---|
| Filename | modeM0/AS1A12_011T26_9000005548_40541cztM0_level2.fits | modeM0/AS1A12_011T26_9000005548_40541cztM0_level2_quad_clean.evt |
| Size (bytes) | 571,193,280 | 137,197,440 |
| Size | 544.7 MB | 130.8 MB |
| Events in quadrant A | 4,598,258 | 936,434 |
| Events in quadrant B | 4,420,057 | 958,506 |
| Events in quadrant C | 4,681,807 | 927,196 |
| Events in quadrant D | 6,760,638 | 722,131 |
| Mode M0 | |||
|---|---|---|---|
| Quadrant | BADHDUFLAG | Total packets | Discarded packets |
| A | 0 | 19309 | 3 |
| B | 0 | 19105 | 2 |
| C | 0 | 19581 | 2 |
| D | 0 | 26188 | 2 |
| Mode SS | |||
|---|---|---|---|
| Quadrant | BADHDUFLAG | Total packets | Discarded packets |
| A | 0 | 178 | 0 |
| B | 0 | 178 | 0 |
| C | 0 | 178 | 0 |
| D | 0 | 178 | 0 |
| Mode M9 | |||
|---|---|---|---|
| Quadrant | BADHDUFLAG | Total packets | Discarded packets |
| A | 0 | 29 | 0 |
| B | 0 | 29 | 0 |
| C | 0 | 29 | 0 |
| D | 0 | 29 | 0 |
| Quadrant | Total seconds | Saturated seconds | Saturation percentage |
|---|---|---|---|
| A | 8788 | 30 | 0.341375% |
| B | 8788 | 18 | 0.204825% |
| C | 8788 | 36 | 0.409650% |
| D | 8788 | 1557 | 17.717342% |
Noise dominated data is calculated using 1-second bins in cleaned event files. If a bin has >2000 counts, and if more than 50% of those come from <1% of pixels, then it is considered to be noise-dominated and hence unusable.
| Quadrant | # 1 sec bins | Bins with >0 counts | Bins with >2000 counts | High rate bins dominated by noise | Noise dominated (total time) | Noise dominated (detector-on time) | Marked lightcurve |
|---|---|---|---|---|---|---|---|
| A | 11625 | 8790 | 24 | 24 | 0.21% | 0.27% | 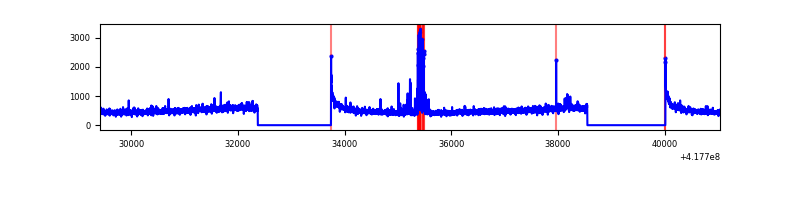 |
| B | 11625 | 8790 | 0 | 0 | 0.00% | 0.00% | 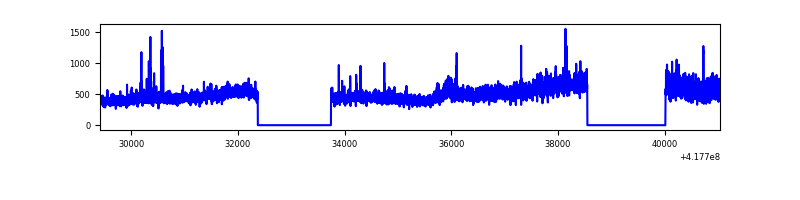 |
| C | 11625 | 8790 | 45 | 45 | 0.39% | 0.51% | 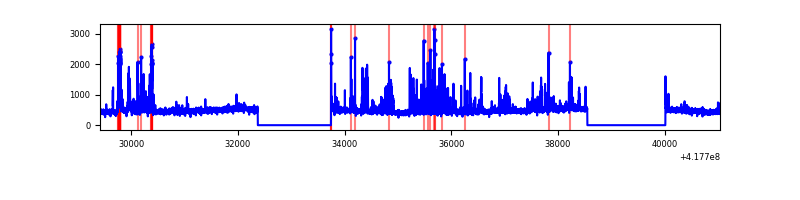 |
| D | 11625 | 8790 | 628 | 628 | 5.40% | 7.14% | 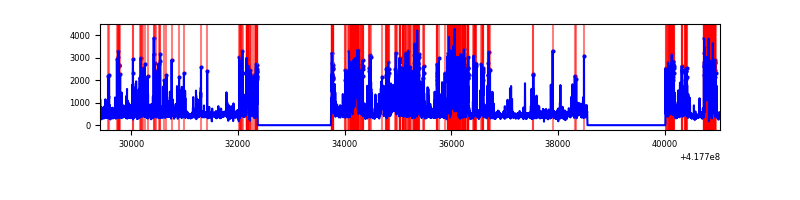 |
Top three noisy pixels from each quadrant. If the there are fewer than three noisy pixels in the level2.evt file, extra rows are filled as -1
| Pixel properties | Quadrant properties | ||||||
|---|---|---|---|---|---|---|---|
| Quadrant | DetID | PixID | Counts | Sigma | Mean | Median | Sigma |
| A | 10 | 83 | 665690 | 3440.01 | 946 | 926 | 193.2 |
| A | 7 | 3 | 161661 | 831.77 | 946 | 926 | 193.2 |
| A | 12 | 189 | 74192 | 379.14 | 946 | 926 | 193.2 |
| B | 3 | 112 | 608445 | 3295.22 | 941 | 914 | 184.4 |
| B | 7 | 202 | 33611 | 177.35 | 941 | 914 | 184.4 |
| B | 0 | 230 | 27112 | 142.1 | 941 | 914 | 184.4 |
| C | 14 | 254 | 439588 | 2024.22 | 922 | 928 | 216.7 |
| C | 15 | 214 | 377265 | 1736.63 | 922 | 928 | 216.7 |
| C | 10 | 20 | 255153 | 1173.13 | 922 | 928 | 216.7 |
| D | 2 | 250 | 2112591 | 10246.22 | 836 | 814 | 206.1 |
| D | 12 | 227 | 606322 | 2937.89 | 836 | 814 | 206.1 |
| D | 12 | 6 | 378649 | 1833.23 | 836 | 814 | 206.1 |
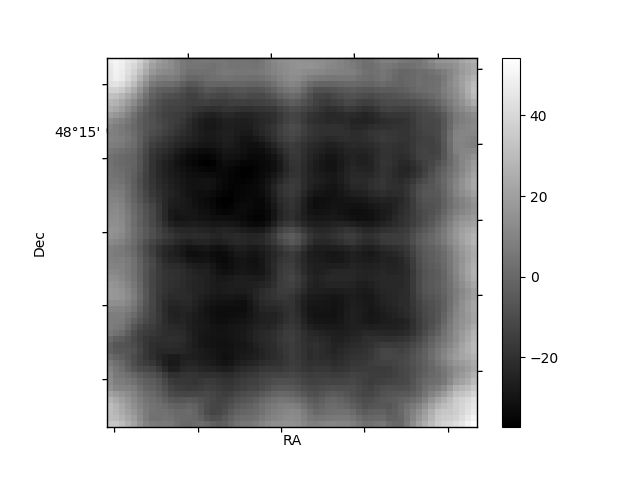
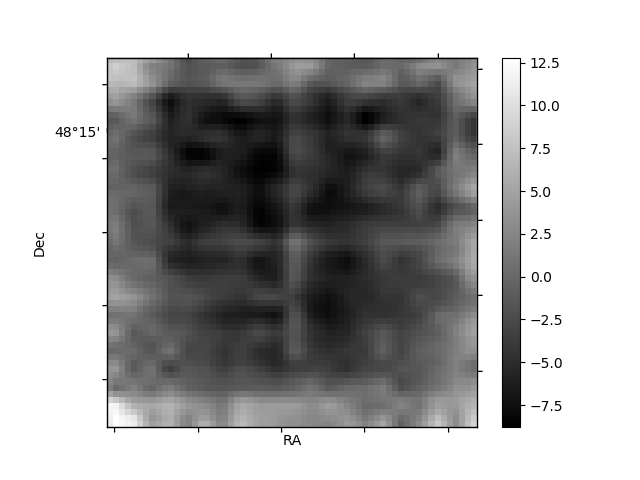
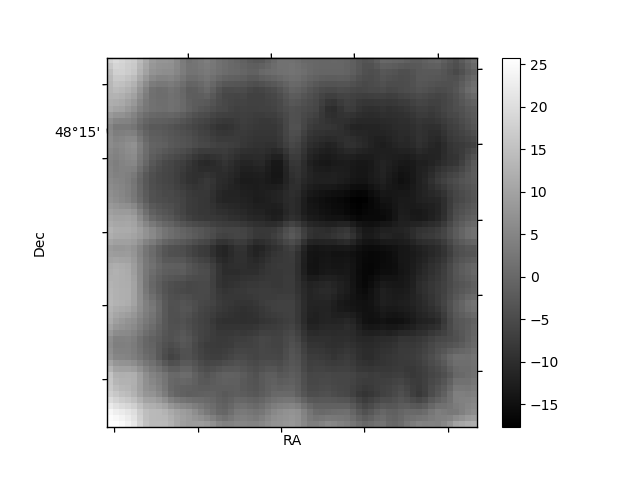
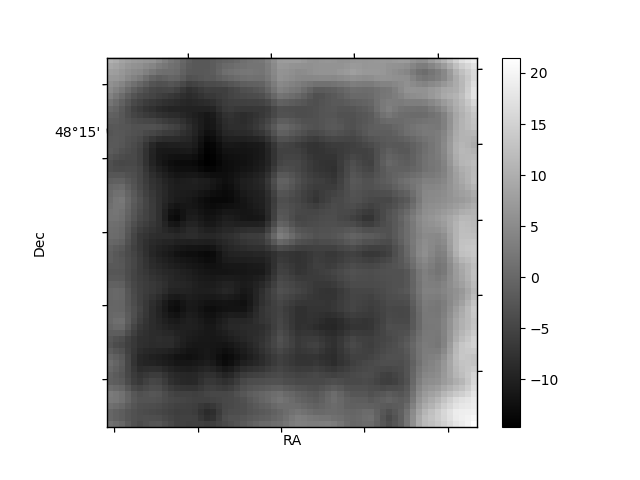
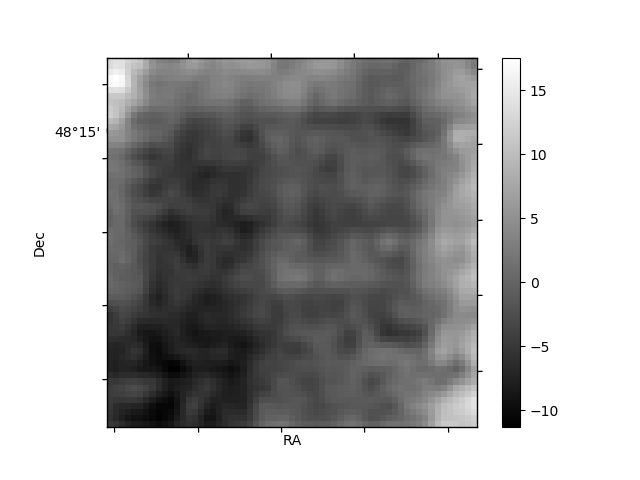
Histogram calculated using DETX and DETY for each event in the final _common_clean file
| Quadrant A | 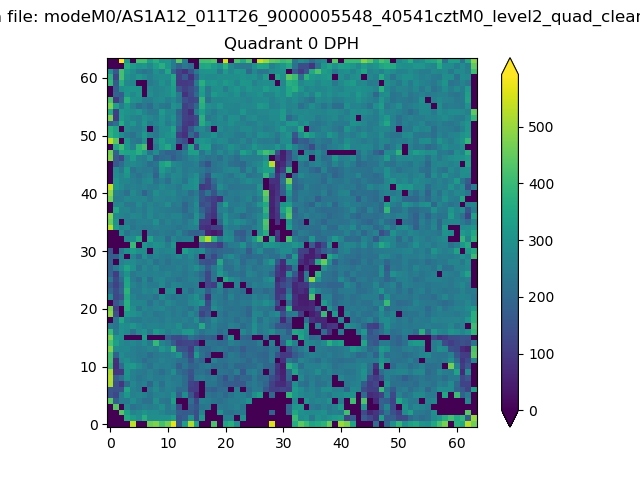 |
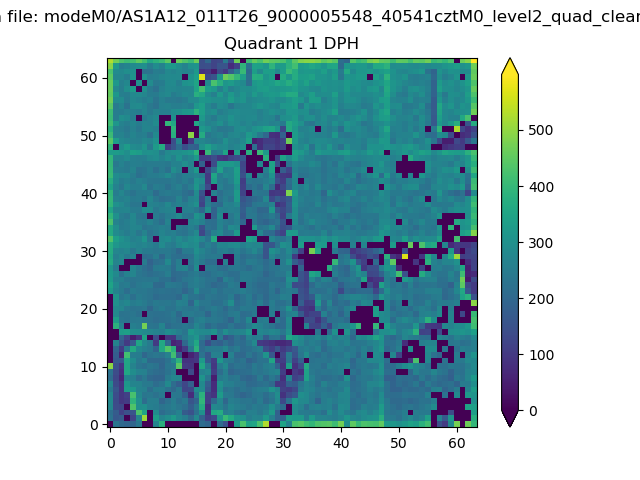 |
Quadrant B |
|---|---|---|---|
| Quadrant D | 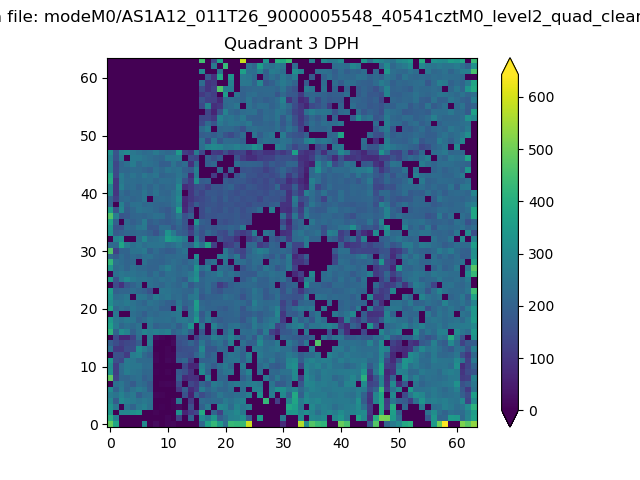 |
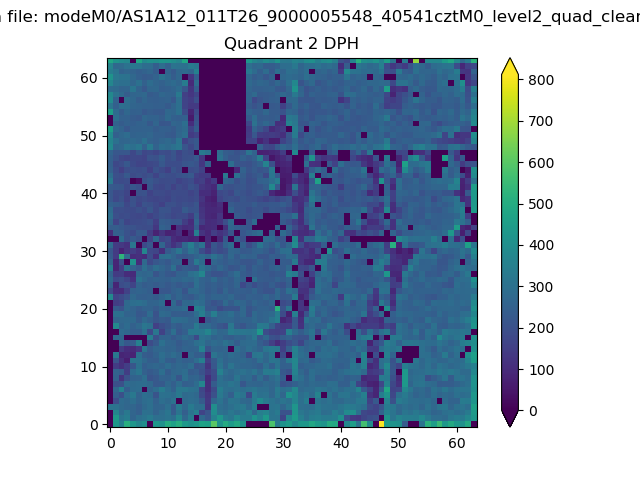 |
Quadrant C |
| Plot type | Count rate plots | Images |
|---|---|---|
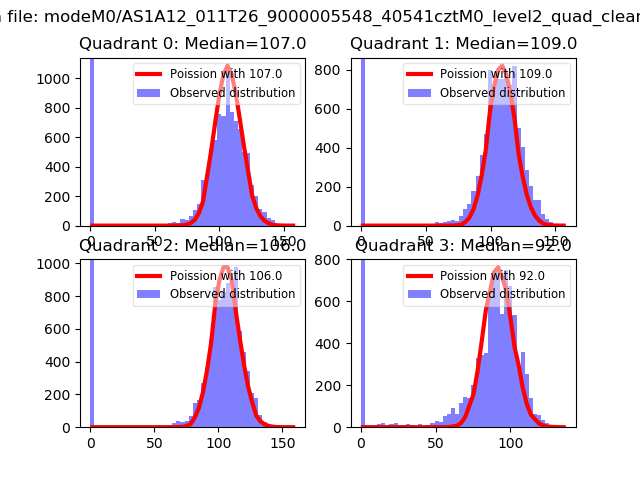
| Comparison with Poisson distribution Blue bars denote a histogram of data divided into 1 sec bins. Red curve is a Poisson curve with rate = median count rate of data. |
 |
 |
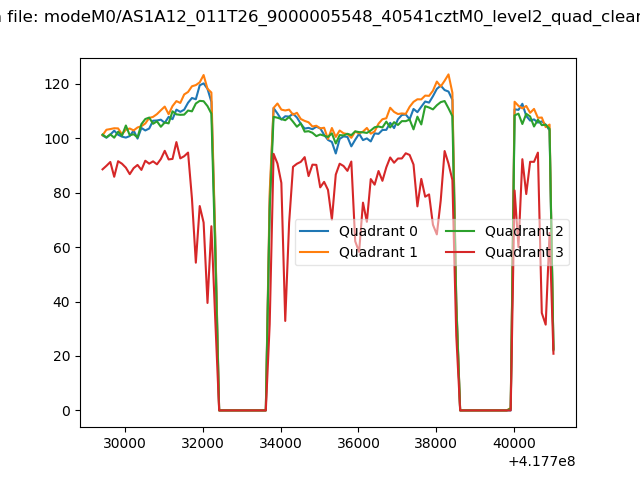
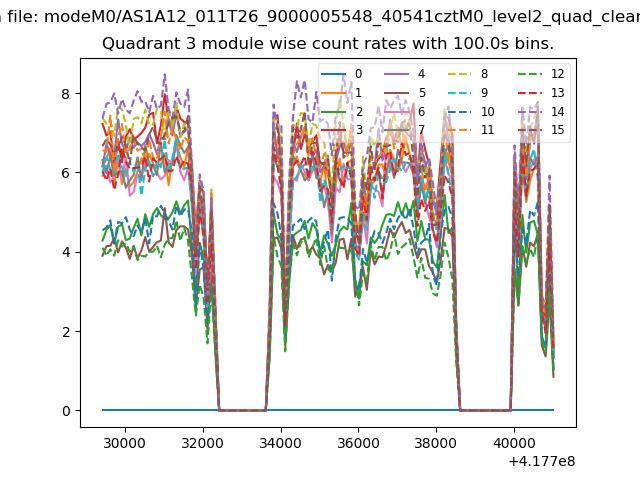
| Quadrant-wise count rates Data is divided into 100 sec bins |
 |
|
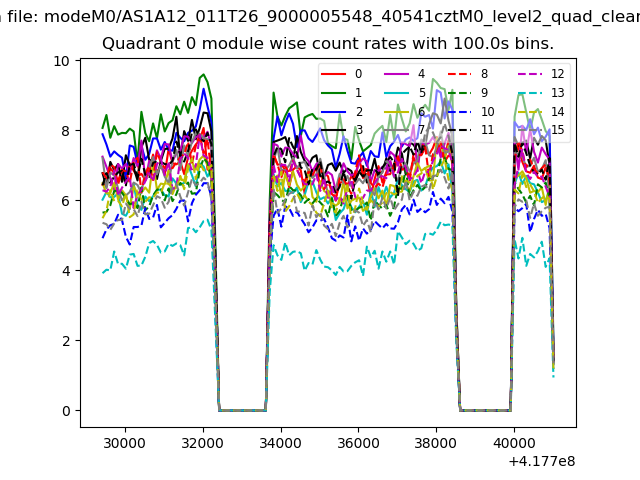
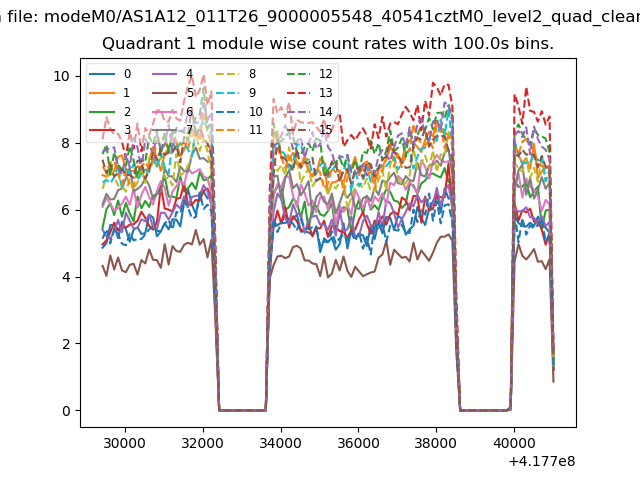
| Module-wise count rates for Quadrant A Data is divided into 100 sec bins |
 |
 |
| Module-wise count rates for Quadrant B Data is divided into 100 sec bins |
 |
 |
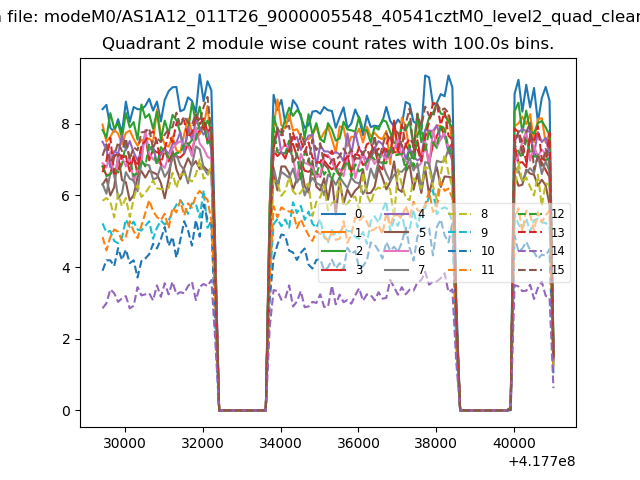
| Module-wise count rates for Quadrant C Data is divided into 100 sec bins |
 |
 |
| Module-wise count rates for Quadrant D Data is divided into 100 sec bins |
 |
 |
| Parameter | Plot |
|---|---|
| CZT HV Monitor | 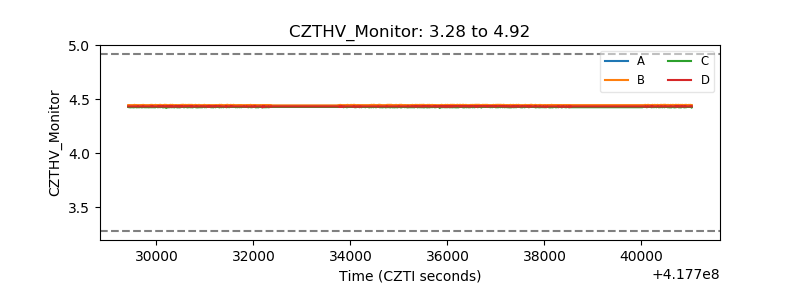 |
| D_VDD | 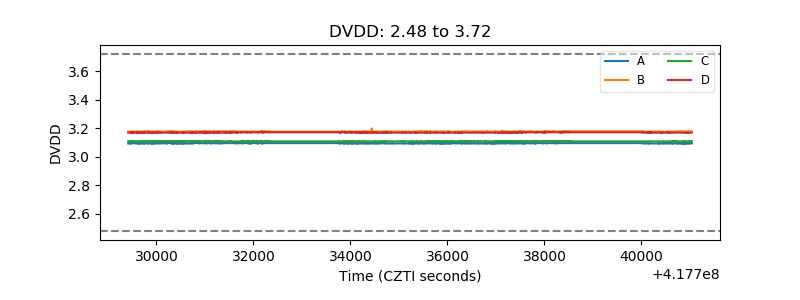 |
| Temperature 1 | 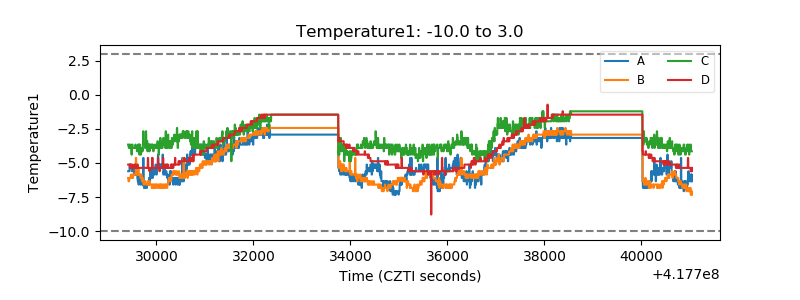 |
| Veto HV Monitor | 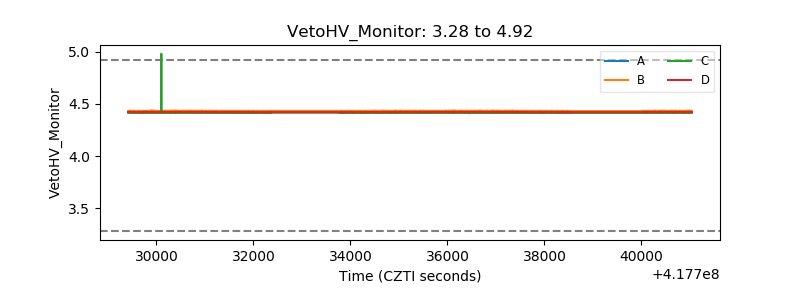 |
| Veto LLD | 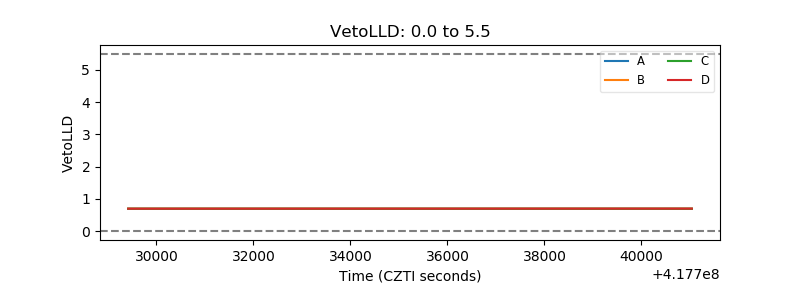 |
| Alpha Counter | 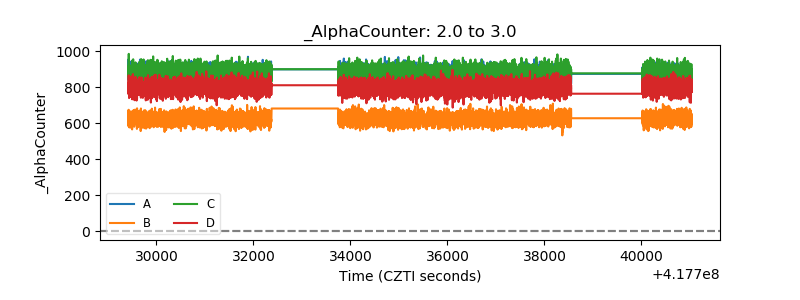 |
| _CPM_Rate | 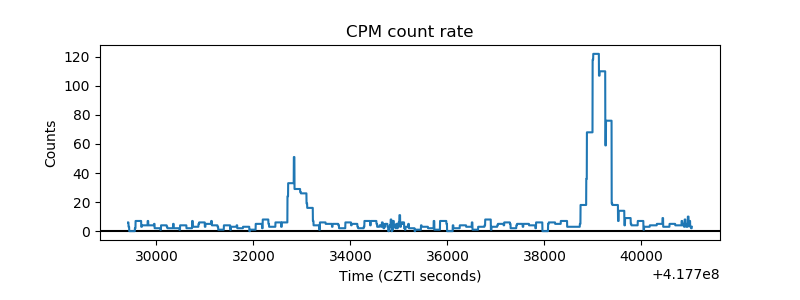 |
| CZT Counter | 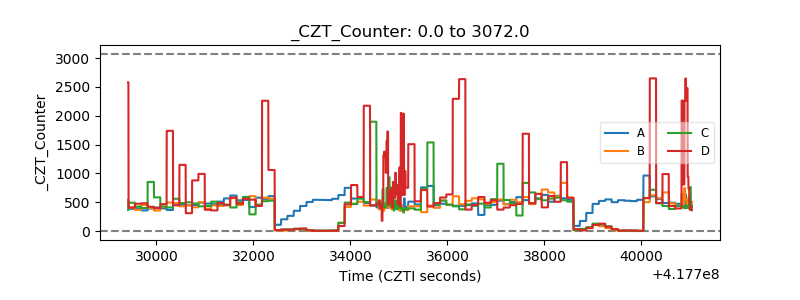 |
| +2.5 Volts monitor |  |
| +5 Volts monitor | 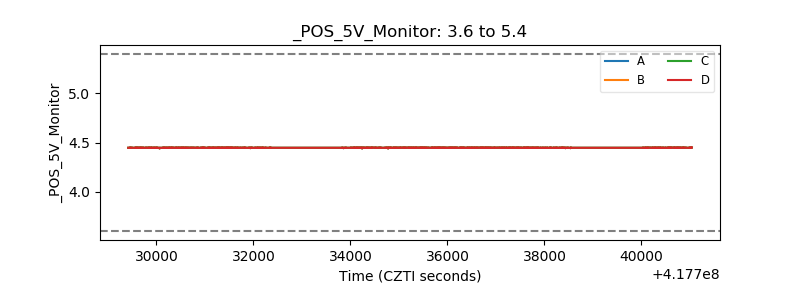 |
| _ROLL_ROT | 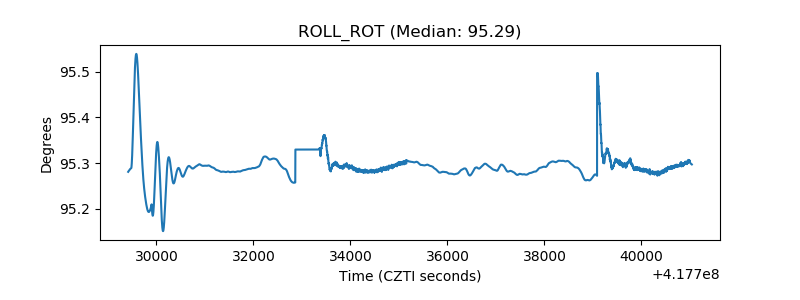 |
| _Roll_DEC | 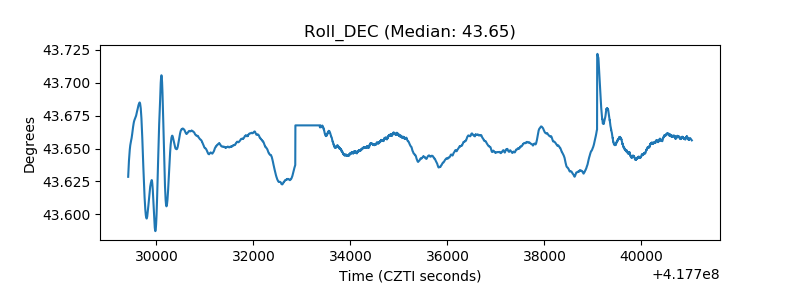 |
| _Roll_RA | 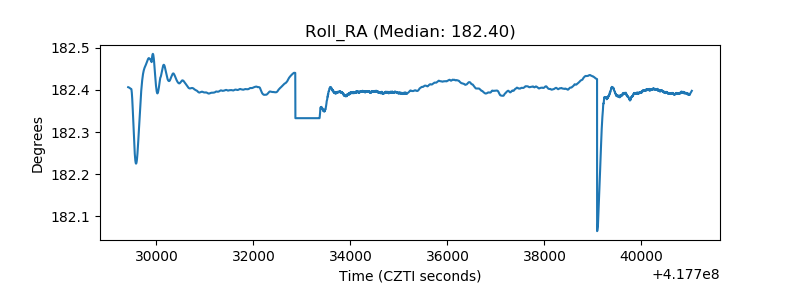 |
| Veto Counter | 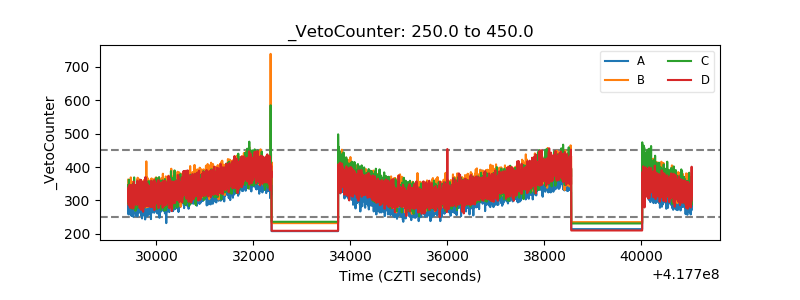 |