| Param | Original file | Final file |
|---|---|---|
| Filename | modeM0/AS1A12_011T26_9000005548_40542cztM0_level2.fits | modeM0/AS1A12_011T26_9000005548_40542cztM0_level2_quad_clean.evt |
| Size (bytes) | 332,061,120 | 86,592,960 |
| Size | 316.7 MB | 82.6 MB |
| Events in quadrant A | 2,924,292 | 586,331 |
| Events in quadrant B | 2,832,050 | 601,317 |
| Events in quadrant C | 3,000,352 | 573,756 |
| Events in quadrant D | 3,105,605 | 475,572 |
| Mode M0 | |||
|---|---|---|---|
| Quadrant | BADHDUFLAG | Total packets | Discarded packets |
| A | 0 | 12391 | 3 |
| B | 0 | 12044 | 2 |
| C | 0 | 12577 | 2 |
| D | 0 | 13350 | 2 |
| Mode SS | |||
|---|---|---|---|
| Quadrant | BADHDUFLAG | Total packets | Discarded packets |
| A | 0 | 110 | 0 |
| B | 0 | 110 | 0 |
| C | 0 | 110 | 0 |
| D | 0 | 110 | 0 |
| Mode M9 | |||
|---|---|---|---|
| Quadrant | BADHDUFLAG | Total packets | Discarded packets |
| A | 0 | 26 | 0 |
| B | 0 | 26 | 0 |
| C | 0 | 26 | 0 |
| D | 0 | 27 | 0 |
| Quadrant | Total seconds | Saturated seconds | Saturation percentage |
|---|---|---|---|
| A | 5505 | 16 | 0.290645% |
| B | 5505 | 12 | 0.217984% |
| C | 5505 | 104 | 1.889192% |
| D | 5505 | 652 | 11.843778% |
Noise dominated data is calculated using 1-second bins in cleaned event files. If a bin has >2000 counts, and if more than 50% of those come from <1% of pixels, then it is considered to be noise-dominated and hence unusable.
| Quadrant | # 1 sec bins | Bins with >0 counts | Bins with >2000 counts | High rate bins dominated by noise | Noise dominated (total time) | Noise dominated (detector-on time) | Marked lightcurve |
|---|---|---|---|---|---|---|---|
| A | 7087 | 5506 | 9 | 9 | 0.13% | 0.16% | 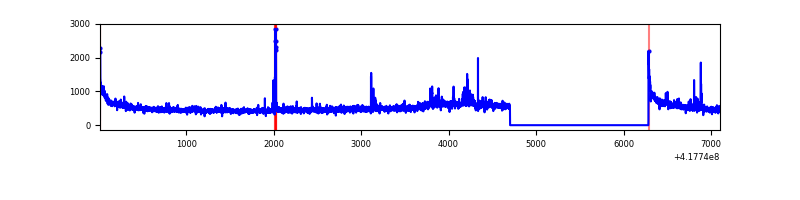 |
| B | 7087 | 5506 | 0 | 0 | 0.00% | 0.00% | 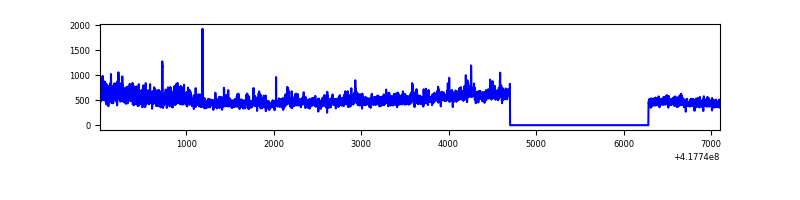 |
| C | 7087 | 5506 | 77 | 77 | 1.09% | 1.40% | 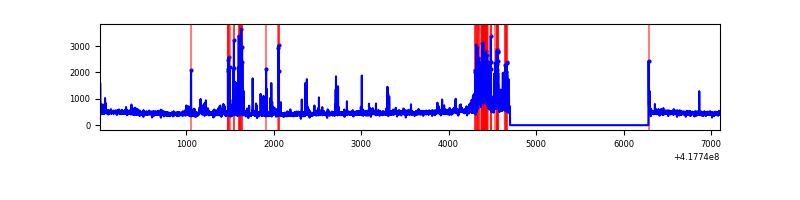 |
| D | 7087 | 5505 | 220 | 220 | 3.10% | 4.00% | 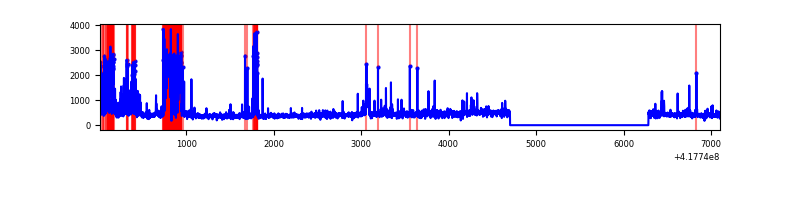 |
Top three noisy pixels from each quadrant. If the there are fewer than three noisy pixels in the level2.evt file, extra rows are filled as -1
| Pixel properties | Quadrant properties | ||||||
|---|---|---|---|---|---|---|---|
| Quadrant | DetID | PixID | Counts | Sigma | Mean | Median | Sigma |
| A | 10 | 83 | 474741 | 3932.22 | 585 | 572 | 120.6 |
| A | 12 | 189 | 86785 | 714.95 | 585 | 572 | 120.6 |
| A | 6 | 10 | 49807 | 408.3 | 585 | 572 | 120.6 |
| B | 3 | 112 | 503818 | 4396.29 | 584 | 568 | 114.5 |
| B | 12 | 111 | 14747 | 123.86 | 584 | 568 | 114.5 |
| B | 11 | 111 | 13369 | 111.83 | 584 | 568 | 114.5 |
| C | 14 | 254 | 486341 | 3625.77 | 570 | 575 | 134.0 |
| C | 15 | 214 | 240681 | 1792.16 | 570 | 575 | 134.0 |
| C | 10 | 20 | 35998 | 264.4 | 570 | 575 | 134.0 |
| D | 2 | 250 | 695261 | 5236.58 | 532 | 517 | 132.7 |
| D | 12 | 227 | 155874 | 1170.99 | 532 | 517 | 132.7 |
| D | 12 | 191 | 148991 | 1119.11 | 532 | 517 | 132.7 |
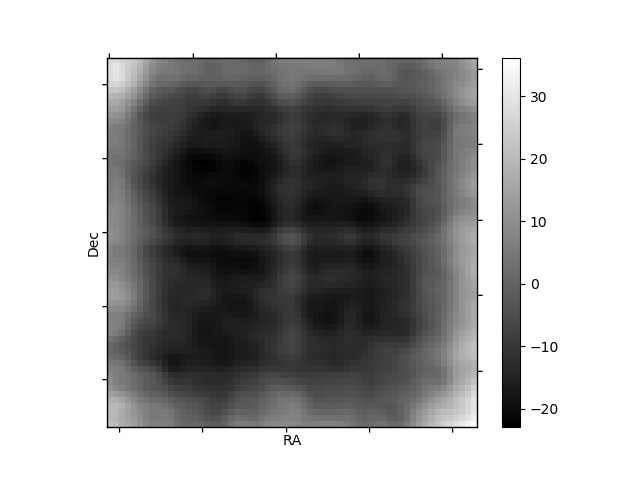
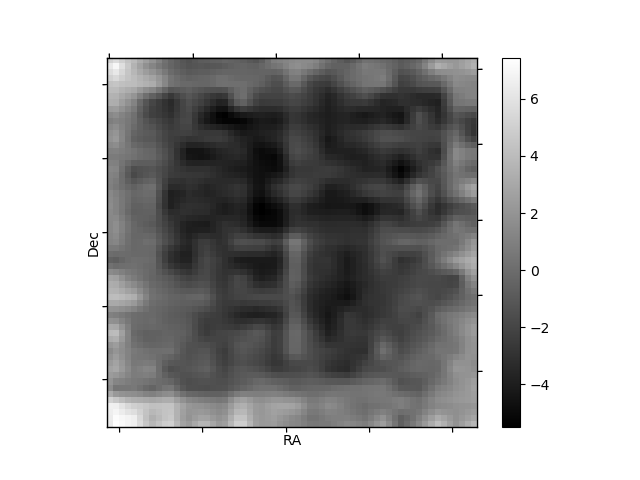
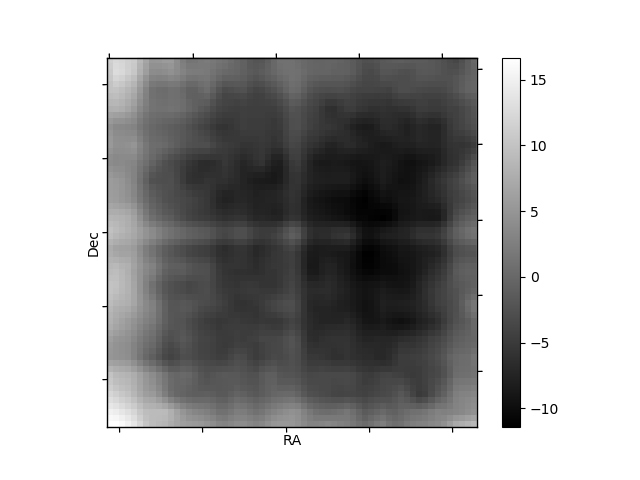
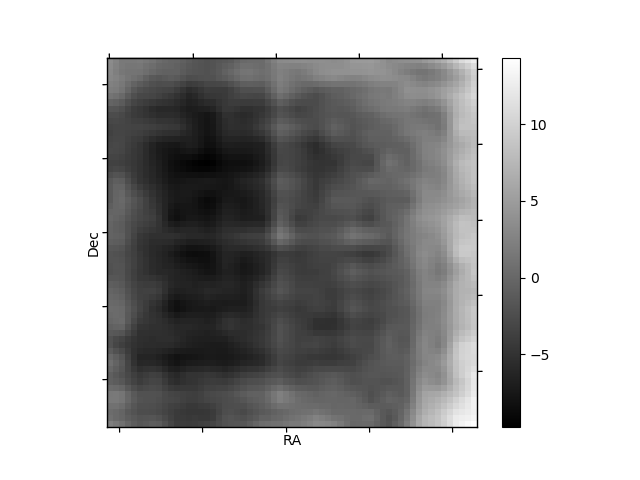
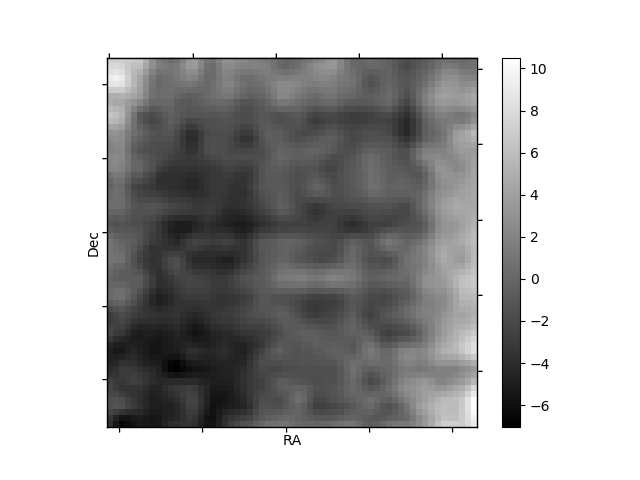
Histogram calculated using DETX and DETY for each event in the final _common_clean file
| Quadrant A | 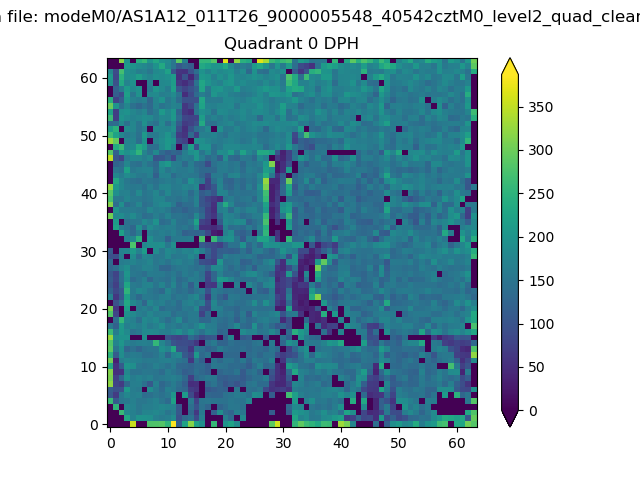 |
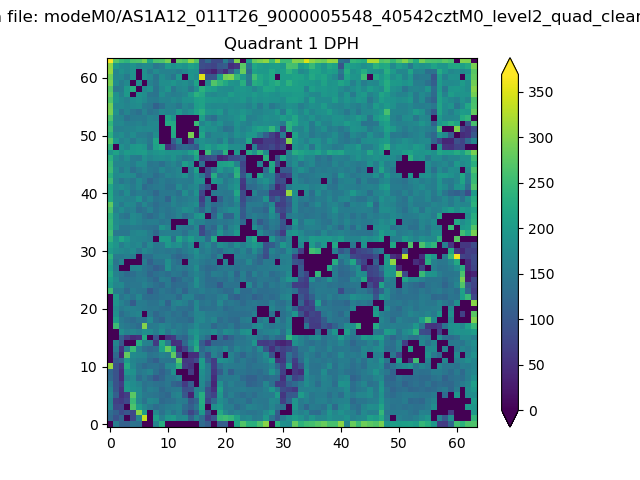 |
Quadrant B |
|---|---|---|---|
| Quadrant D | 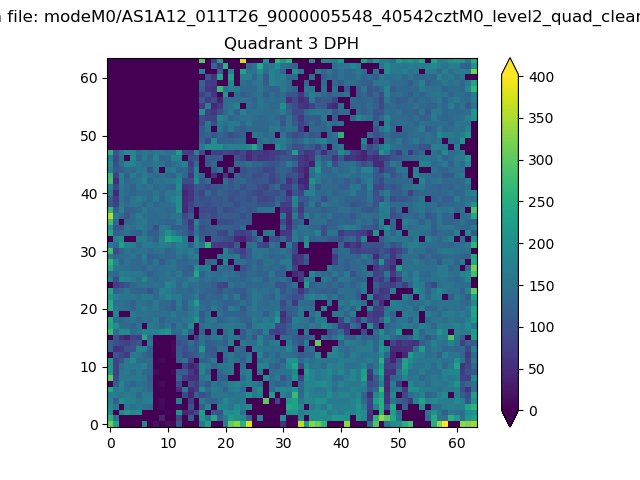 |
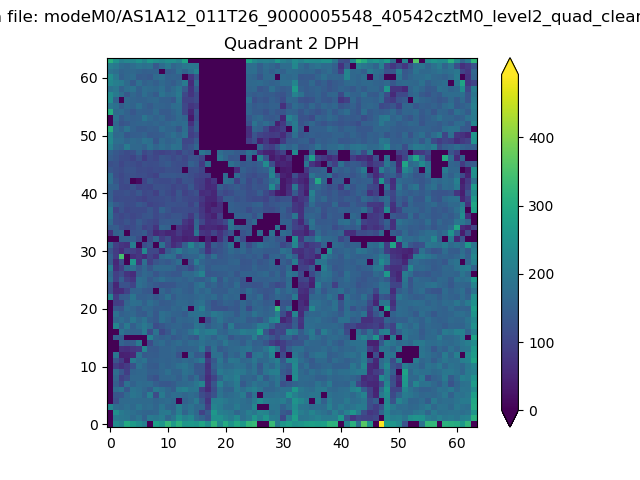 |
Quadrant C |
| Plot type | Count rate plots | Images |
|---|---|---|
| Comparison with Poisson distribution Blue bars denote a histogram of data divided into 1 sec bins. Red curve is a Poisson curve with rate = median count rate of data. |
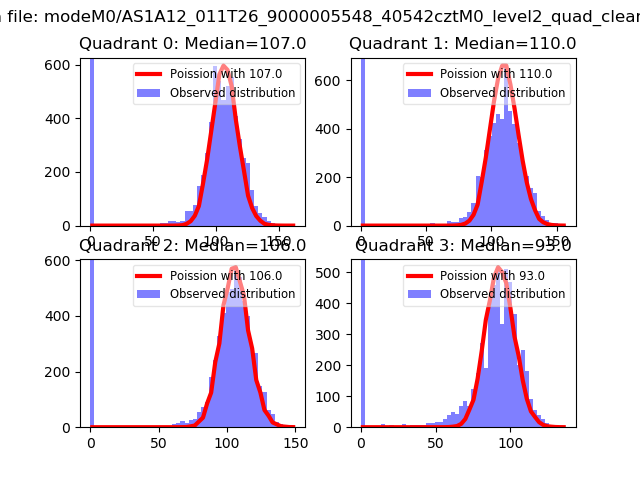 |
 |
| Quadrant-wise count rates Data is divided into 100 sec bins |
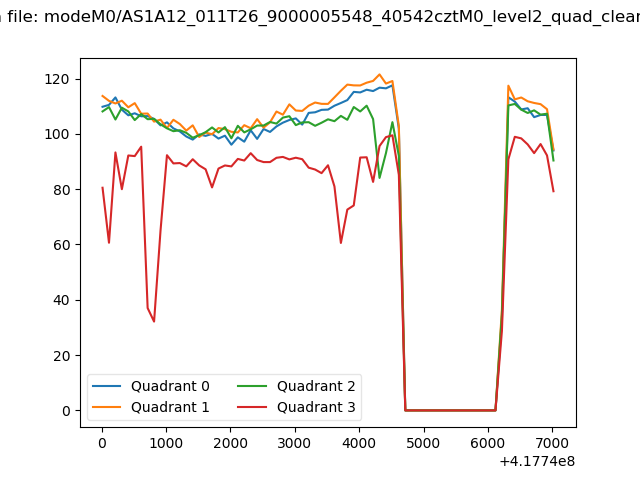 |
|
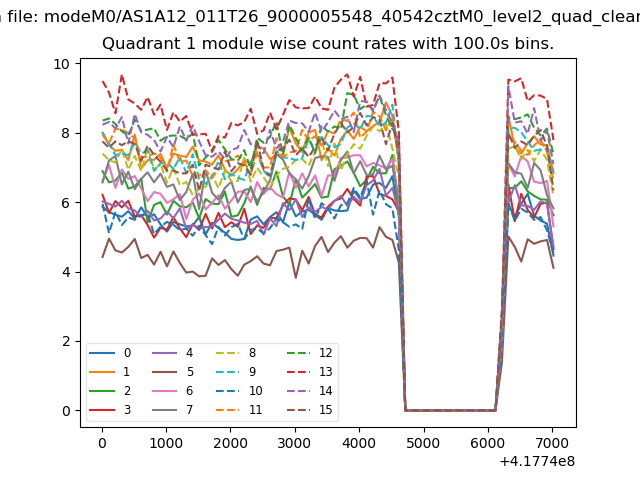
| Module-wise count rates for Quadrant A Data is divided into 100 sec bins |
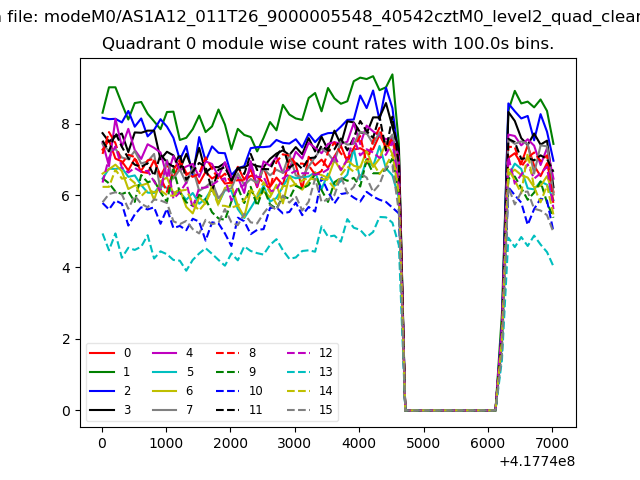 |
 |
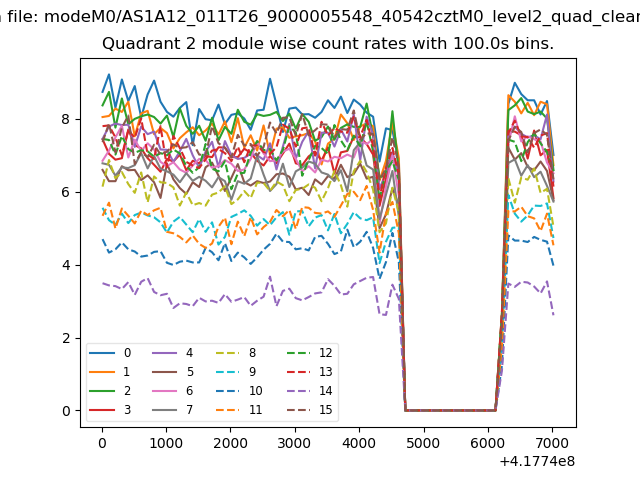
| Module-wise count rates for Quadrant B Data is divided into 100 sec bins |
 |
 |
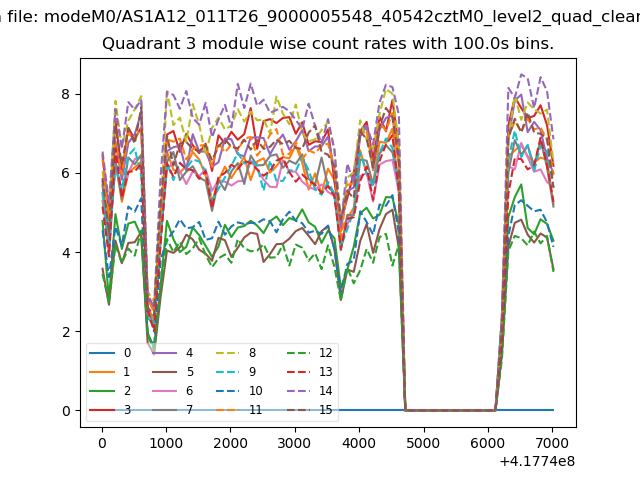
| Module-wise count rates for Quadrant C Data is divided into 100 sec bins |
 |
 |
| Module-wise count rates for Quadrant D Data is divided into 100 sec bins |
 |
 |
| Parameter | Plot |
|---|---|
| CZT HV Monitor | 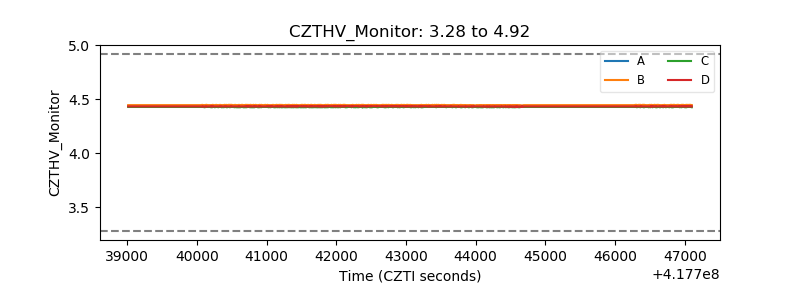 |
| D_VDD | 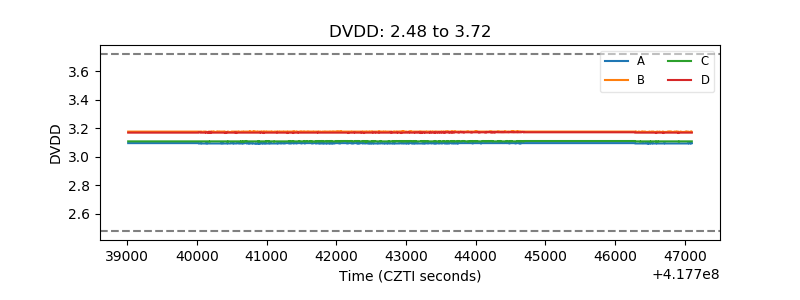 |
| Temperature 1 | 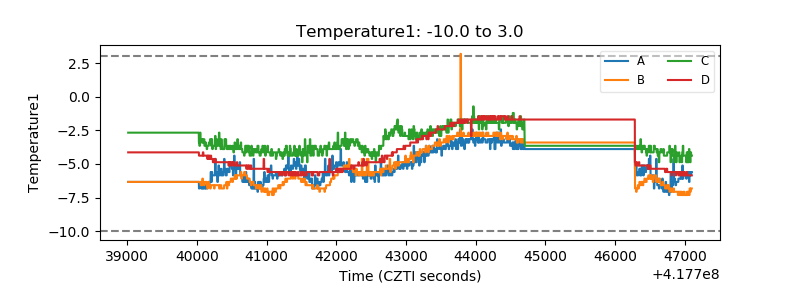 |
| Veto HV Monitor | 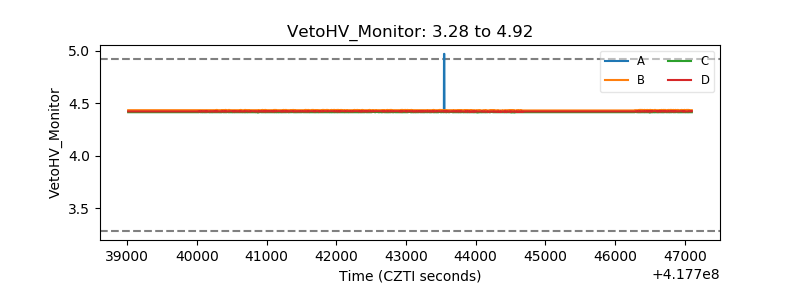 |
| Veto LLD | 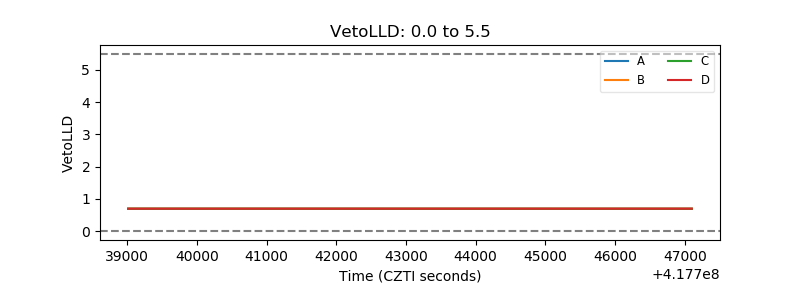 |
| Alpha Counter | 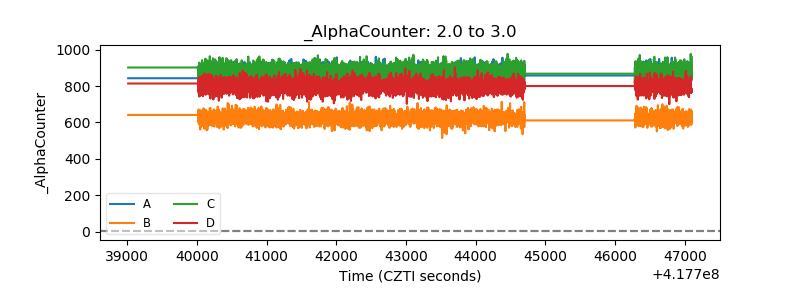 |
| _CPM_Rate | 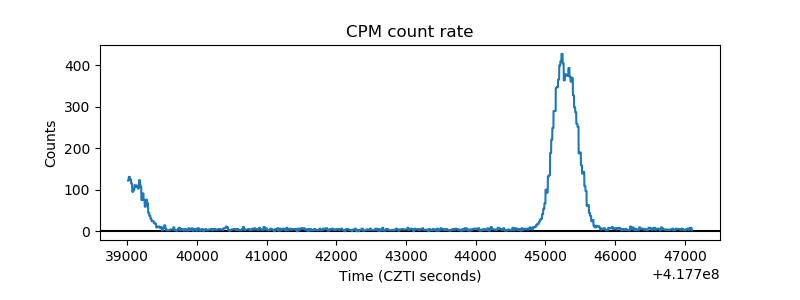 |
| CZT Counter | 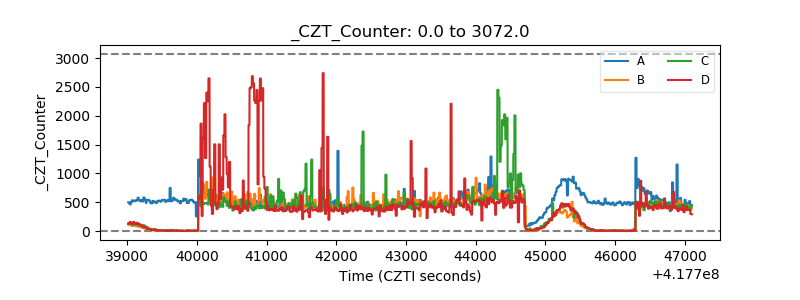 |
| +2.5 Volts monitor | 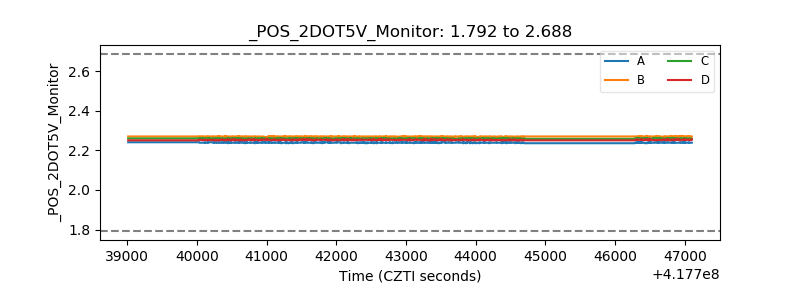 |
| +5 Volts monitor | 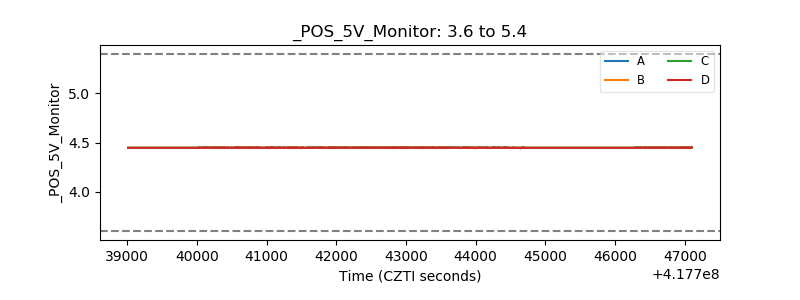 |
| _ROLL_ROT | 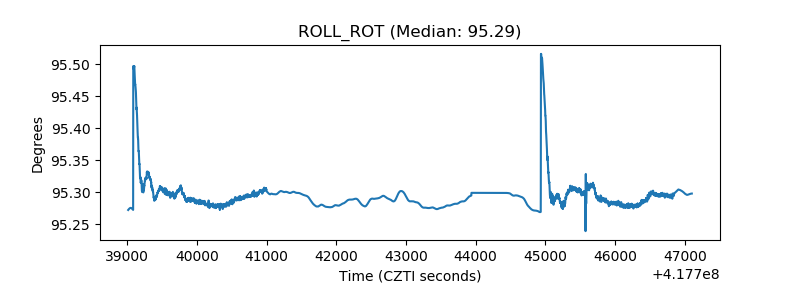 |
| _Roll_DEC | 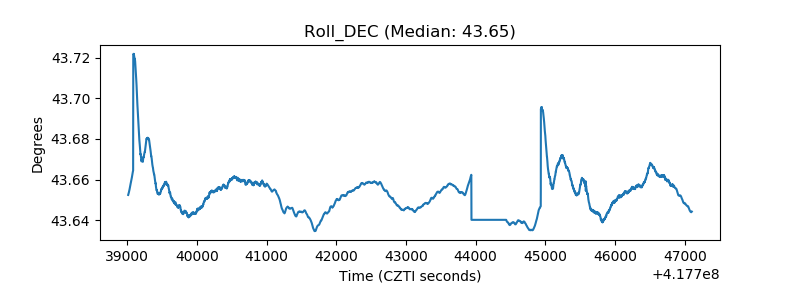 |
| _Roll_RA | 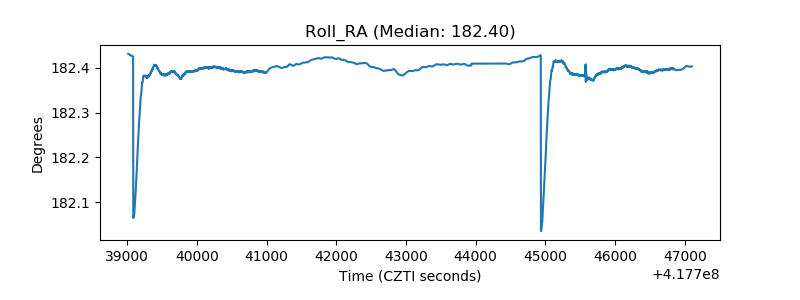 |
| Veto Counter | 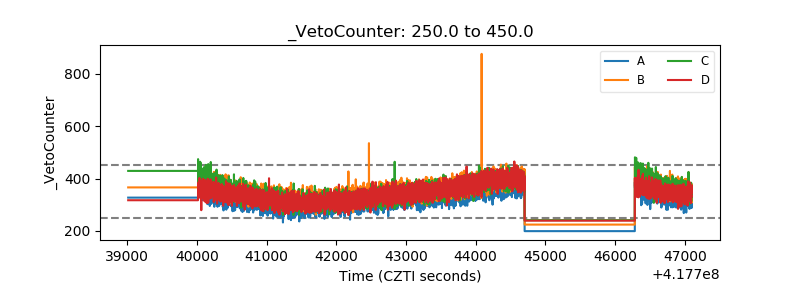 |