| Param | Original file | Final file |
|---|---|---|
| Filename | modeM0/AS1A12_011T26_9000005548_40546cztM0_level2.fits | modeM0/AS1A12_011T26_9000005548_40546cztM0_level2_quad_clean.evt |
| Size (bytes) | 320,175,360 | 87,431,040 |
| Size | 305.3 MB | 83.4 MB |
| Events in quadrant A | 2,926,832 | 606,587 |
| Events in quadrant B | 2,397,143 | 624,711 |
| Events in quadrant C | 2,586,552 | 586,826 |
| Events in quadrant D | 3,541,132 | 470,168 |
| Mode M0 | |||
|---|---|---|---|
| Quadrant | BADHDUFLAG | Total packets | Discarded packets |
| A | 0 | 11750 | 3 |
| B | 0 | 10303 | 2 |
| C | 0 | 10820 | 2 |
| D | 0 | 14172 | 2 |
| Mode SS | |||
|---|---|---|---|
| Quadrant | BADHDUFLAG | Total packets | Discarded packets |
| A | 0 | 104 | 0 |
| B | 0 | 104 | 0 |
| C | 0 | 104 | 0 |
| D | 0 | 104 | 0 |
| Mode M9 | |||
|---|---|---|---|
| Quadrant | BADHDUFLAG | Total packets | Discarded packets |
| A | 0 | 28 | 0 |
| B | 0 | 28 | 0 |
| C | 0 | 28 | 0 |
| D | 0 | 29 | 0 |
| Quadrant | Total seconds | Saturated seconds | Saturation percentage |
|---|---|---|---|
| A | 5127 | 10 | 0.195046% |
| B | 5127 | 7 | 0.136532% |
| C | 5127 | 12 | 0.234055% |
| D | 5127 | 799 | 15.584162% |
Noise dominated data is calculated using 1-second bins in cleaned event files. If a bin has >2000 counts, and if more than 50% of those come from <1% of pixels, then it is considered to be noise-dominated and hence unusable.
| Quadrant | # 1 sec bins | Bins with >0 counts | Bins with >2000 counts | High rate bins dominated by noise | Noise dominated (total time) | Noise dominated (detector-on time) | Marked lightcurve |
|---|---|---|---|---|---|---|---|
| A | 7099 | 5128 | 2 | 2 | 0.03% | 0.04% | 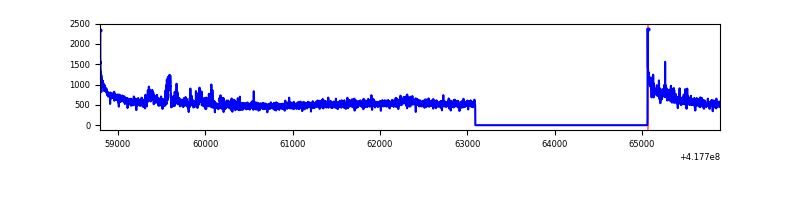 |
| B | 7099 | 5128 | 0 | 0 | 0.00% | 0.00% | 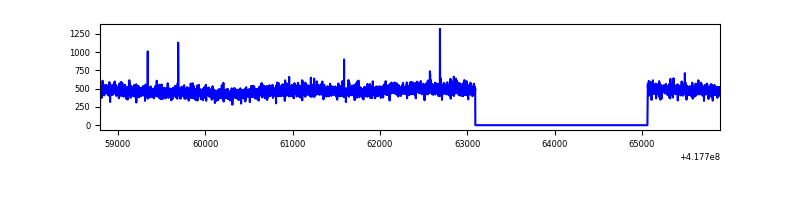 |
| C | 7099 | 5128 | 6 | 6 | 0.08% | 0.12% | 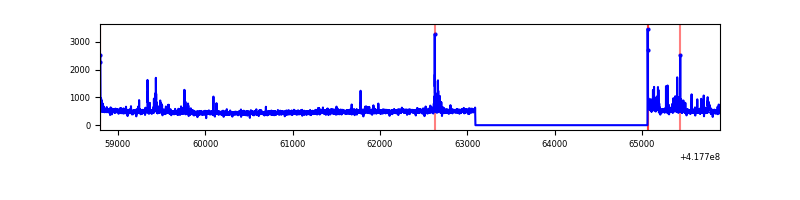 |
| D | 7099 | 5127 | 139 | 139 | 1.96% | 2.71% | 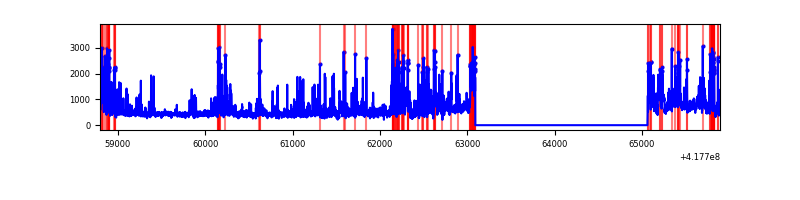 |
Top three noisy pixels from each quadrant. If the there are fewer than three noisy pixels in the level2.evt file, extra rows are filled as -1
| Pixel properties | Quadrant properties | ||||||
|---|---|---|---|---|---|---|---|
| Quadrant | DetID | PixID | Counts | Sigma | Mean | Median | Sigma |
| A | 10 | 83 | 455275 | 3824.29 | 585 | 575 | 118.9 |
| A | 12 | 189 | 155003 | 1298.83 | 585 | 575 | 118.9 |
| A | 6 | 10 | 34575 | 285.96 | 585 | 575 | 118.9 |
| B | 3 | 112 | 86024 | 768.47 | 579 | 564 | 111.2 |
| B | 0 | 230 | 27511 | 242.31 | 579 | 564 | 111.2 |
| B | 12 | 111 | 13971 | 120.56 | 579 | 564 | 111.2 |
| C | 15 | 214 | 227904 | 1736.55 | 563 | 567 | 130.9 |
| C | 14 | 254 | 103155 | 783.63 | 563 | 567 | 130.9 |
| C | 0 | 10 | 26332 | 196.81 | 563 | 567 | 130.9 |
| D | 12 | 227 | 785762 | 6106.9 | 519 | 504 | 128.6 |
| D | 2 | 250 | 296335 | 2300.66 | 519 | 504 | 128.6 |
| D | 12 | 191 | 174626 | 1354.14 | 519 | 504 | 128.6 |
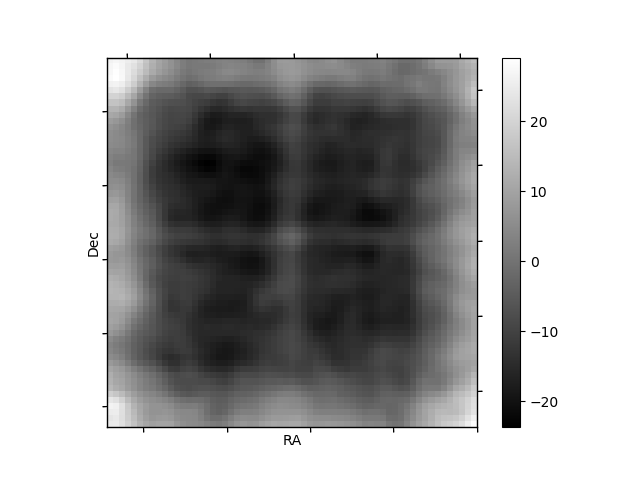
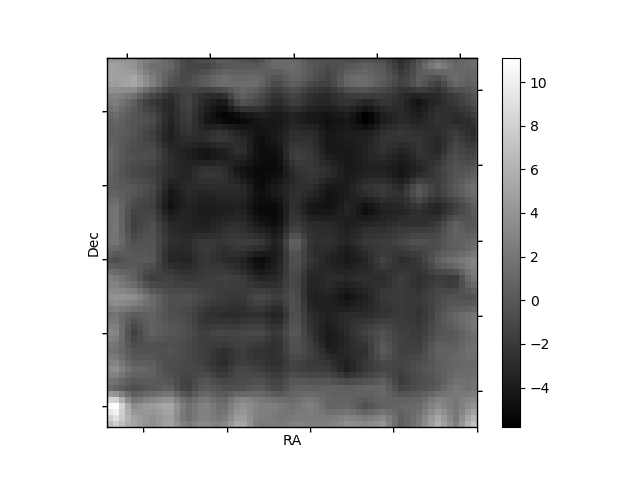
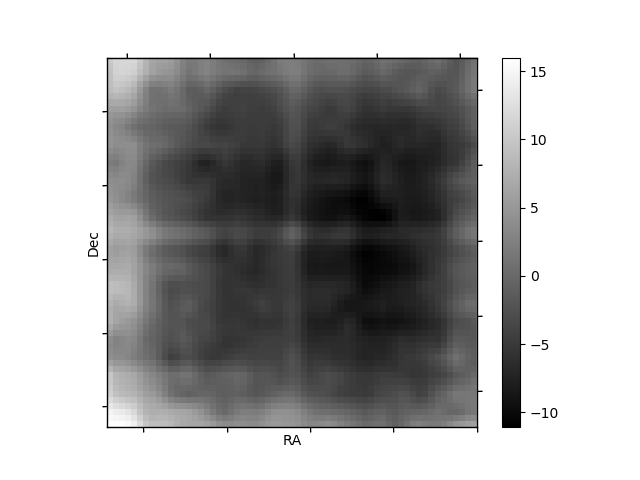
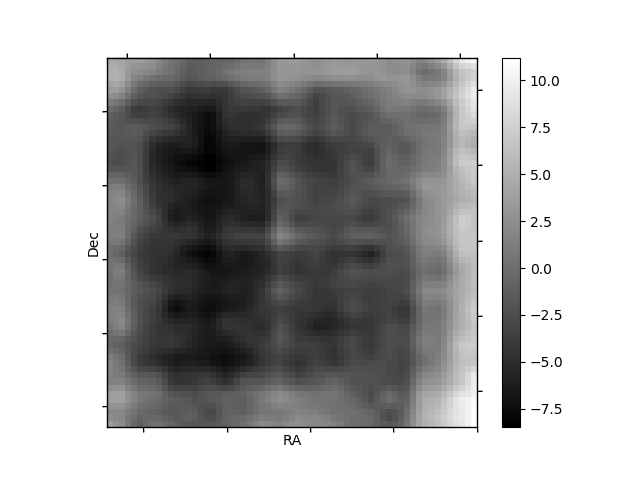
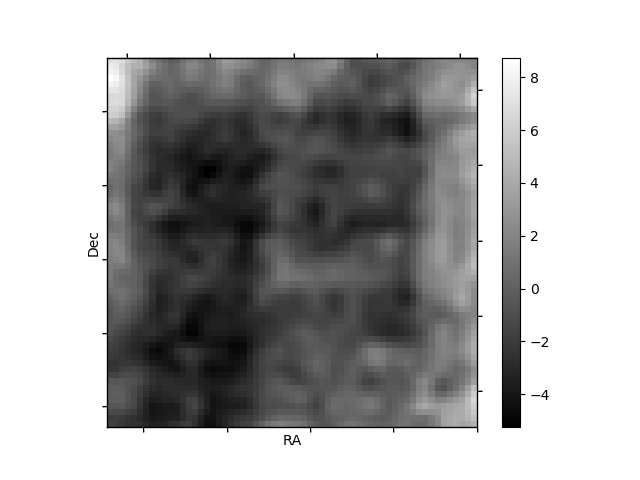
Histogram calculated using DETX and DETY for each event in the final _common_clean file
| Quadrant A | 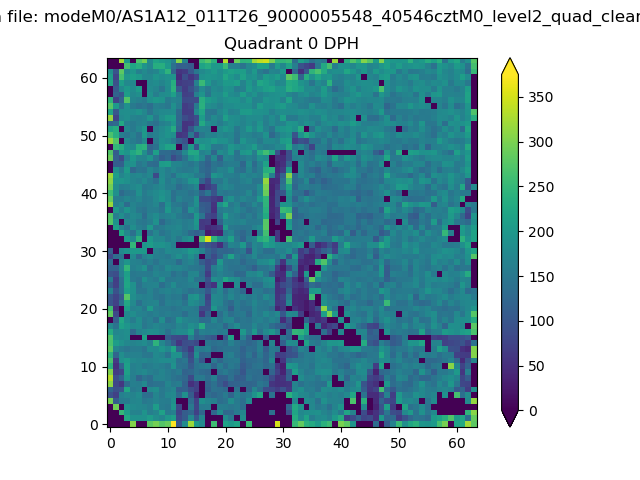 |
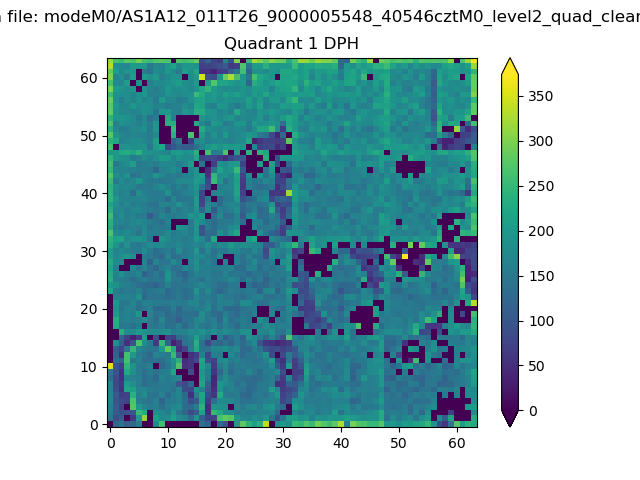 |
Quadrant B |
|---|---|---|---|
| Quadrant D | 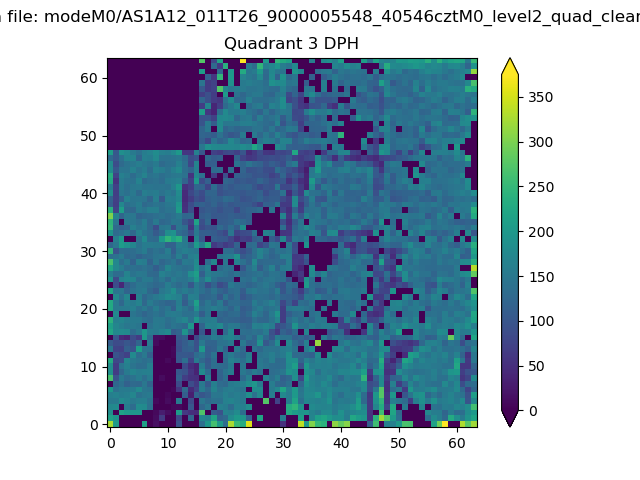 |
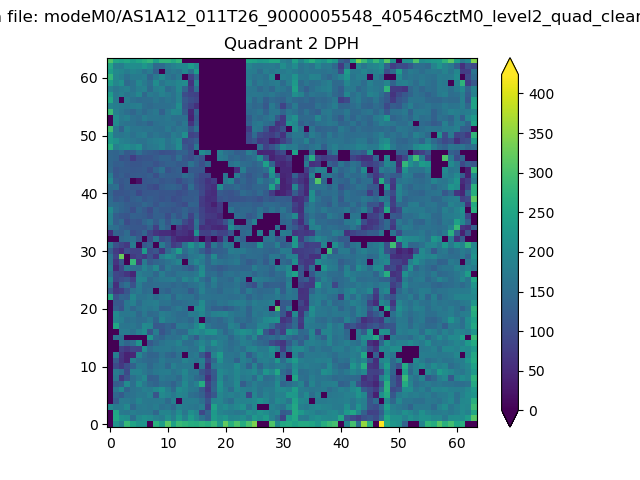 |
Quadrant C |
| Plot type | Count rate plots | Images |
|---|---|---|
| Comparison with Poisson distribution Blue bars denote a histogram of data divided into 1 sec bins. Red curve is a Poisson curve with rate = median count rate of data. |
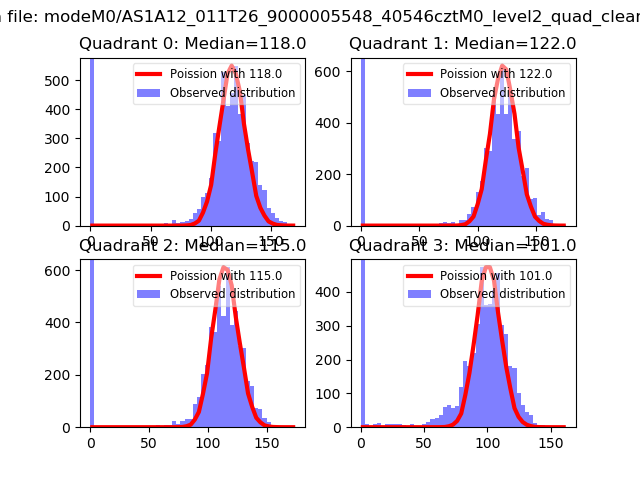 |
 |
| Quadrant-wise count rates Data is divided into 100 sec bins |
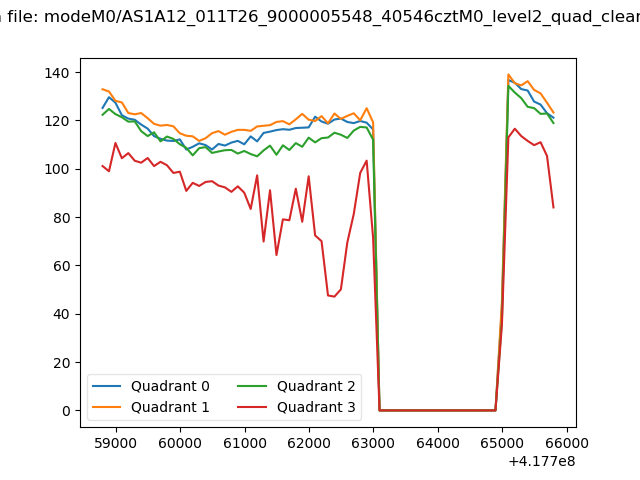 |
|
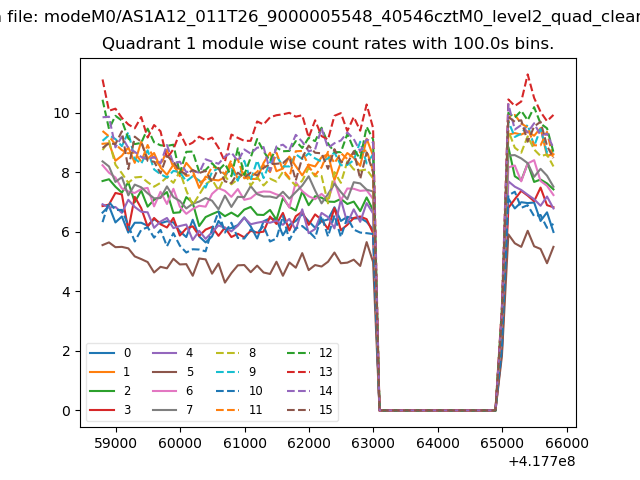
| Module-wise count rates for Quadrant A Data is divided into 100 sec bins |
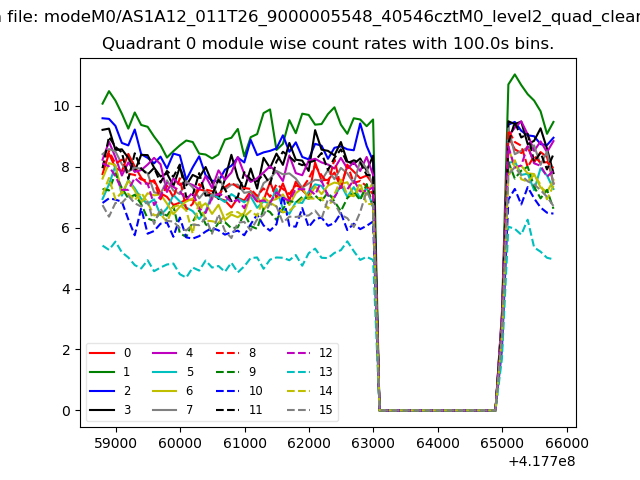 |
 |
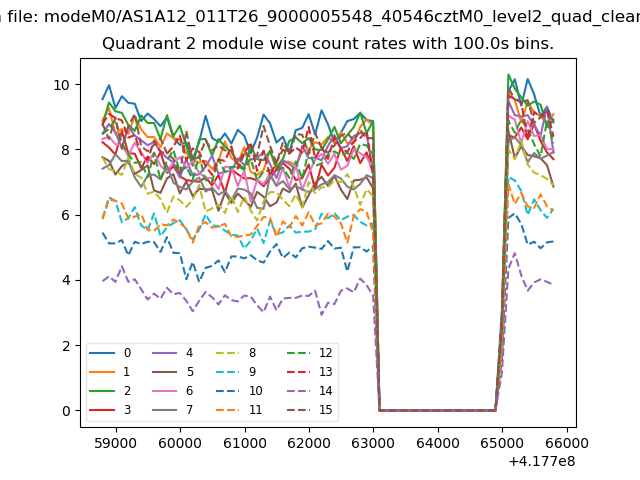
| Module-wise count rates for Quadrant B Data is divided into 100 sec bins |
 |
 |
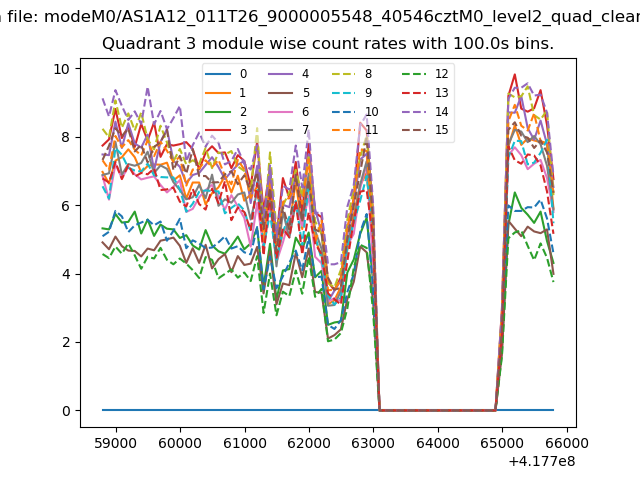
| Module-wise count rates for Quadrant C Data is divided into 100 sec bins |
 |
 |
| Module-wise count rates for Quadrant D Data is divided into 100 sec bins |
 |
 |
| Parameter | Plot |
|---|---|
| CZT HV Monitor | 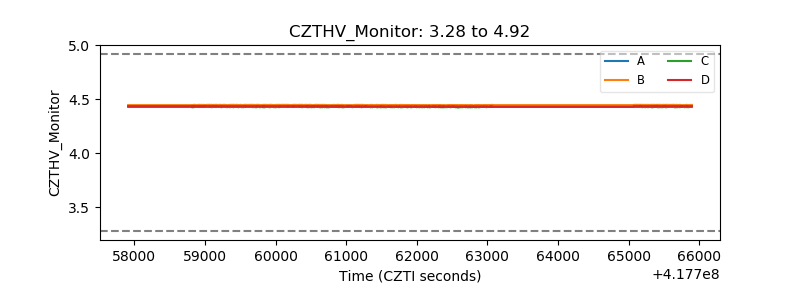 |
| D_VDD | 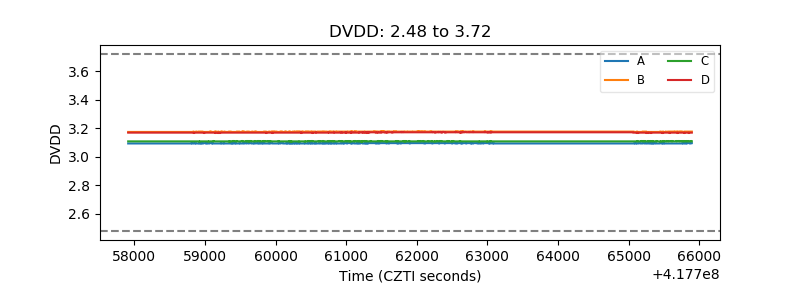 |
| Temperature 1 | 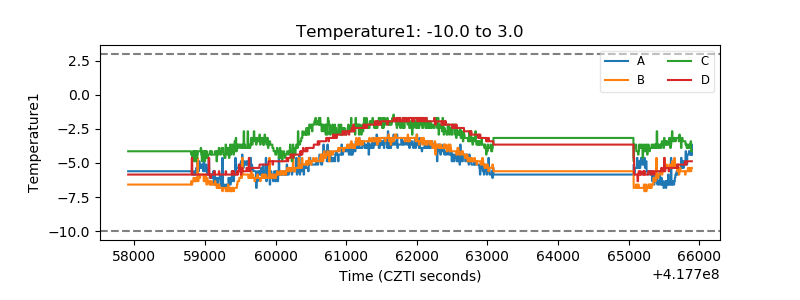 |
| Veto HV Monitor | 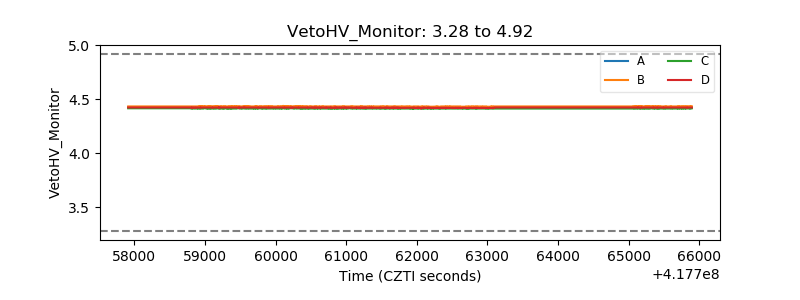 |
| Veto LLD | 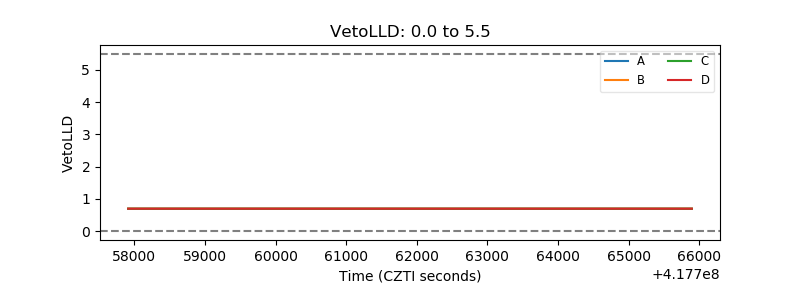 |
| Alpha Counter | 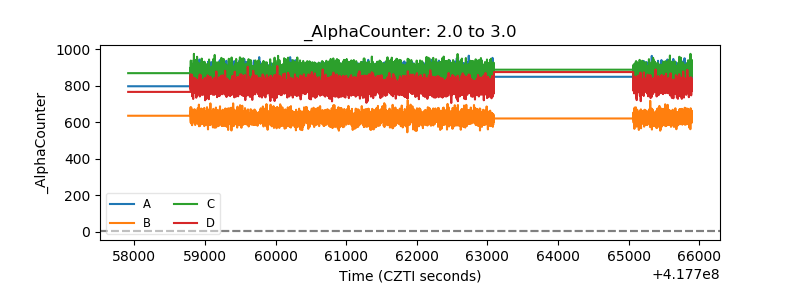 |
| _CPM_Rate |  |
| CZT Counter | 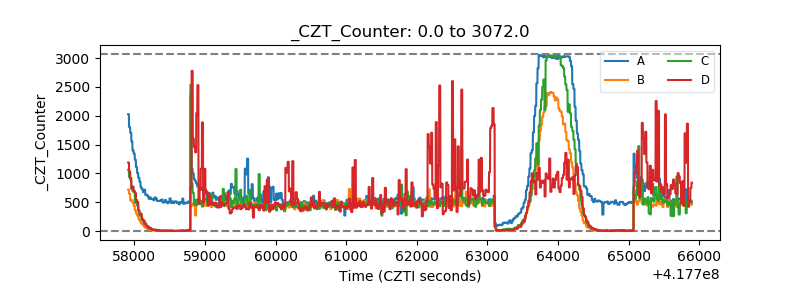 |
| +2.5 Volts monitor | 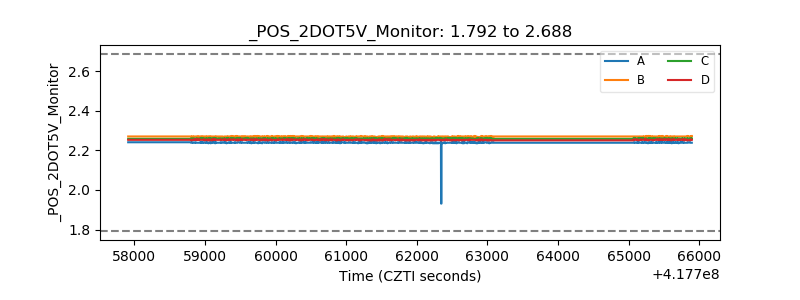 |
| +5 Volts monitor | 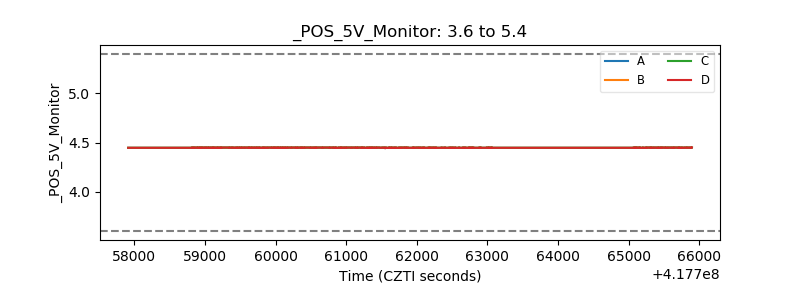 |
| _ROLL_ROT | 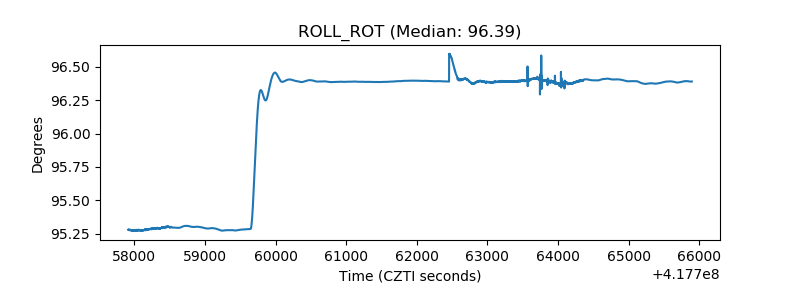 |
| _Roll_DEC | 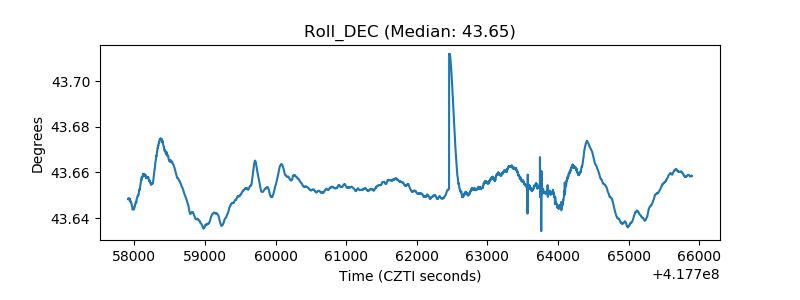 |
| _Roll_RA | 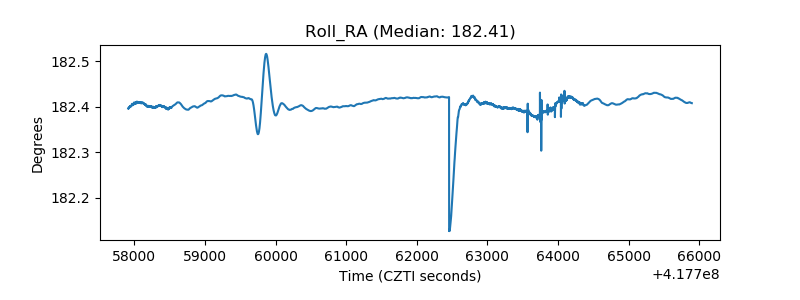 |
| Veto Counter | 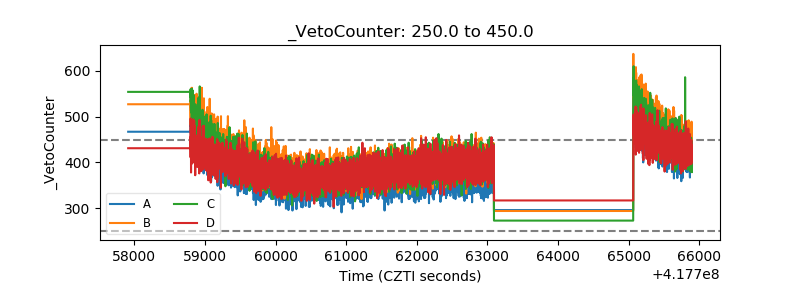 |