| Param | Original file | Final file |
|---|---|---|
| Filename | modeM0/AS1A12_011T26_9000005548_40547cztM0_level2.fits | modeM0/AS1A12_011T26_9000005548_40547cztM0_level2_quad_clean.evt |
| Size (bytes) | 378,993,600 | 84,965,760 |
| Size | 361.4 MB | 81.0 MB |
| Events in quadrant A | 2,797,250 | 613,939 |
| Events in quadrant B | 2,369,300 | 632,972 |
| Events in quadrant C | 2,545,927 | 589,423 |
| Events in quadrant D | 5,927,043 | 386,480 |
| Mode M0 | |||
|---|---|---|---|
| Quadrant | BADHDUFLAG | Total packets | Discarded packets |
| A | 0 | 11129 | 3 |
| B | 0 | 10063 | 2 |
| C | 0 | 10471 | 2 |
| D | 0 | 21176 | 2 |
| Mode SS | |||
|---|---|---|---|
| Quadrant | BADHDUFLAG | Total packets | Discarded packets |
| A | 0 | 102 | 0 |
| B | 0 | 102 | 0 |
| C | 0 | 102 | 0 |
| D | 0 | 102 | 0 |
| Mode M9 | |||
|---|---|---|---|
| Quadrant | BADHDUFLAG | Total packets | Discarded packets |
| A | 0 | 26 | 0 |
| B | 0 | 26 | 0 |
| C | 0 | 26 | 0 |
| D | 0 | 27 | 0 |
| Quadrant | Total seconds | Saturated seconds | Saturation percentage |
|---|---|---|---|
| A | 4992 | 8 | 0.160256% |
| B | 4992 | 7 | 0.140224% |
| C | 4992 | 13 | 0.260417% |
| D | 4992 | 1729 | 34.635417% |
Noise dominated data is calculated using 1-second bins in cleaned event files. If a bin has >2000 counts, and if more than 50% of those come from <1% of pixels, then it is considered to be noise-dominated and hence unusable.
| Quadrant | # 1 sec bins | Bins with >0 counts | Bins with >2000 counts | High rate bins dominated by noise | Noise dominated (total time) | Noise dominated (detector-on time) | Marked lightcurve |
|---|---|---|---|---|---|---|---|
| A | 7055 | 4993 | 2 | 2 | 0.03% | 0.04% | 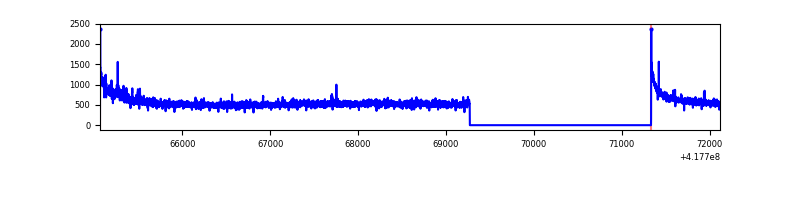 |
| B | 7055 | 4993 | 0 | 0 | 0.00% | 0.00% | 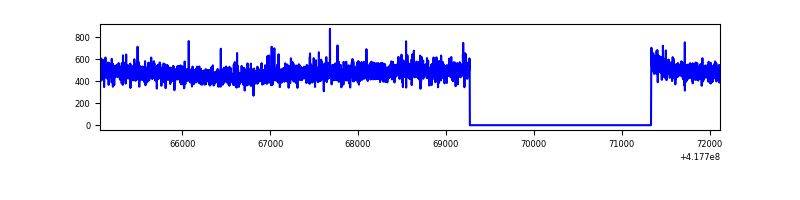 |
| C | 7055 | 4993 | 8 | 8 | 0.11% | 0.16% | 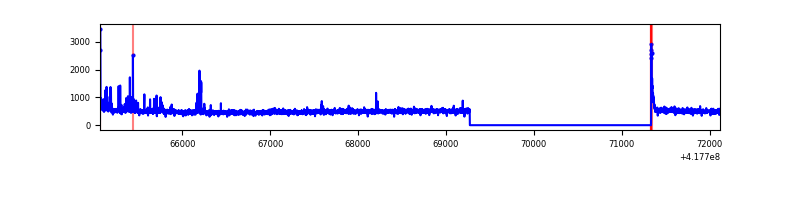 |
| D | 7055 | 4993 | 490 | 490 | 6.95% | 9.81% | 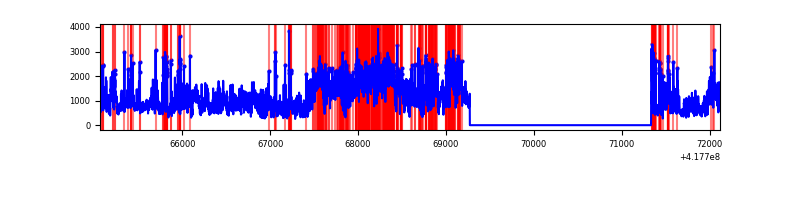 |
Top three noisy pixels from each quadrant. If the there are fewer than three noisy pixels in the level2.evt file, extra rows are filled as -1
| Pixel properties | Quadrant properties | ||||||
|---|---|---|---|---|---|---|---|
| Quadrant | DetID | PixID | Counts | Sigma | Mean | Median | Sigma |
| A | 10 | 83 | 460312 | 3860.88 | 588 | 578 | 119.1 |
| A | 12 | 189 | 52184 | 433.39 | 588 | 578 | 119.1 |
| A | 6 | 10 | 9283 | 73.11 | 588 | 578 | 119.1 |
| B | 3 | 112 | 45604 | 402.33 | 583 | 569 | 111.9 |
| B | 0 | 230 | 30817 | 270.23 | 583 | 569 | 111.9 |
| B | 12 | 111 | 13726 | 117.54 | 583 | 569 | 111.9 |
| C | 15 | 214 | 222524 | 1689.4 | 562 | 565 | 131.4 |
| C | 14 | 254 | 68787 | 519.26 | 562 | 565 | 131.4 |
| C | 0 | 10 | 45146 | 339.32 | 562 | 565 | 131.4 |
| D | 12 | 227 | 2229616 | 18279.24 | 492 | 479 | 121.9 |
| D | 5 | 32 | 1218917 | 9991.36 | 492 | 479 | 121.9 |
| D | 2 | 250 | 193740 | 1584.77 | 492 | 479 | 121.9 |
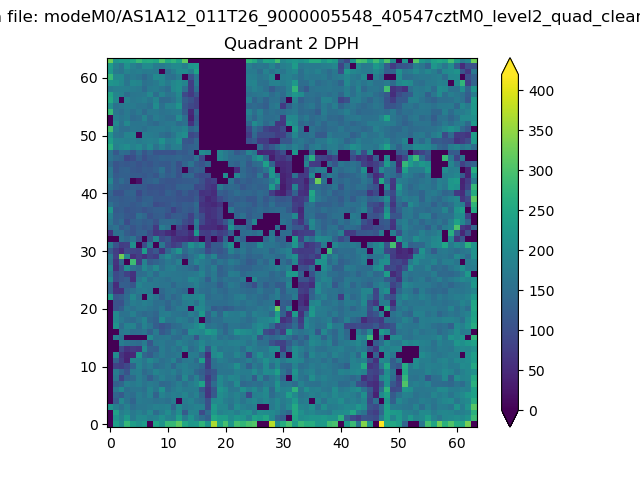
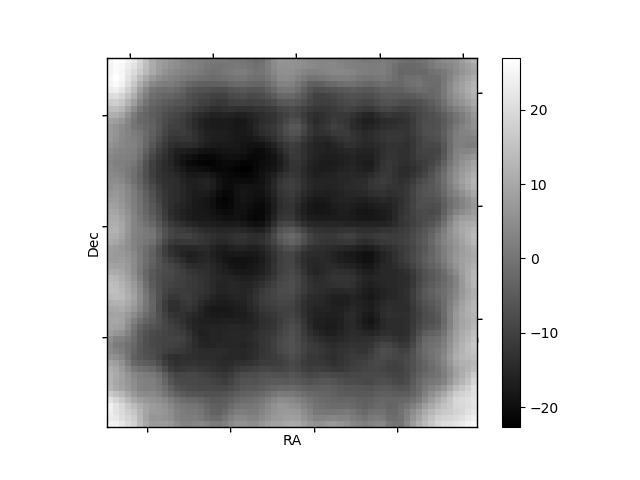
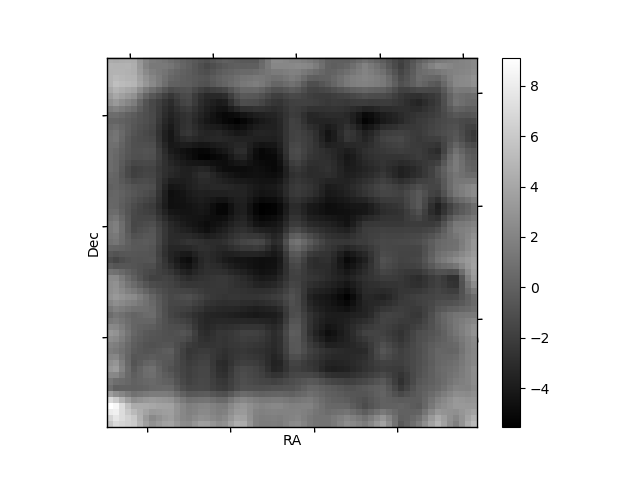
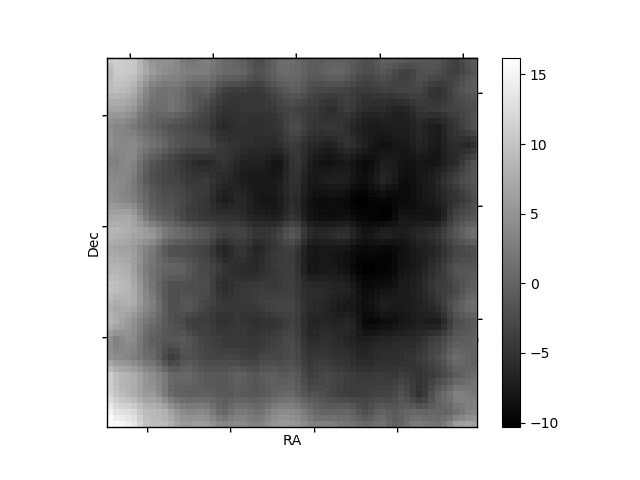
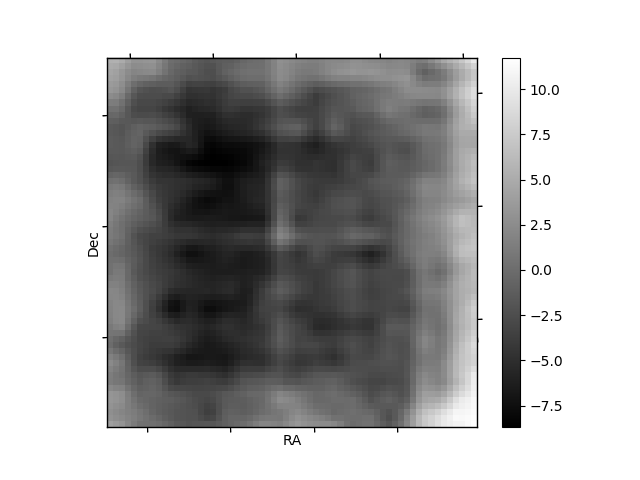
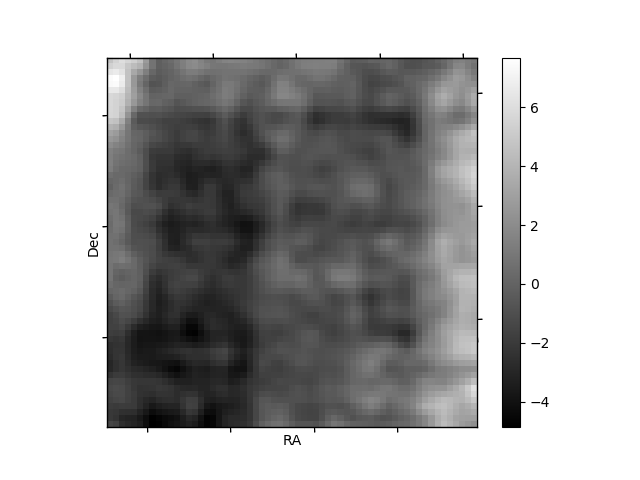
Histogram calculated using DETX and DETY for each event in the final _common_clean file
| Quadrant A | 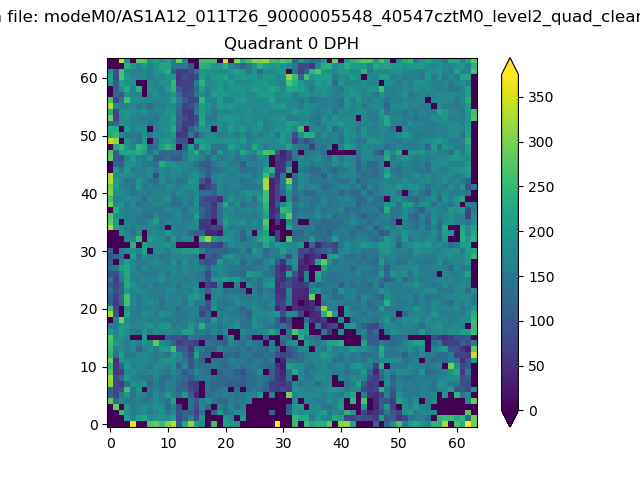 |
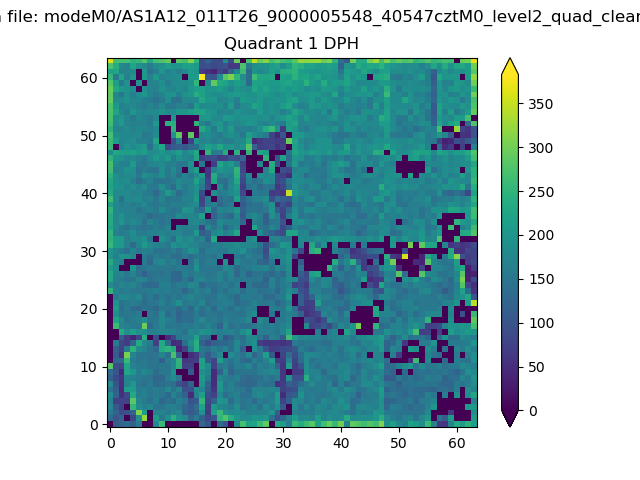 |
Quadrant B |
|---|---|---|---|
| Quadrant D | 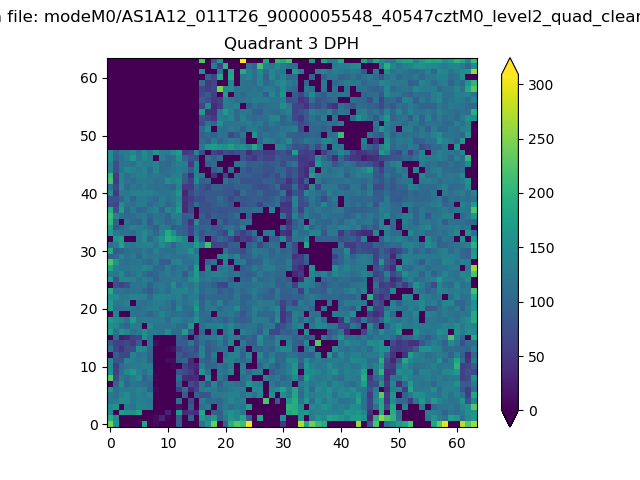 |
 |
Quadrant C |
| Plot type | Count rate plots | Images |
|---|---|---|
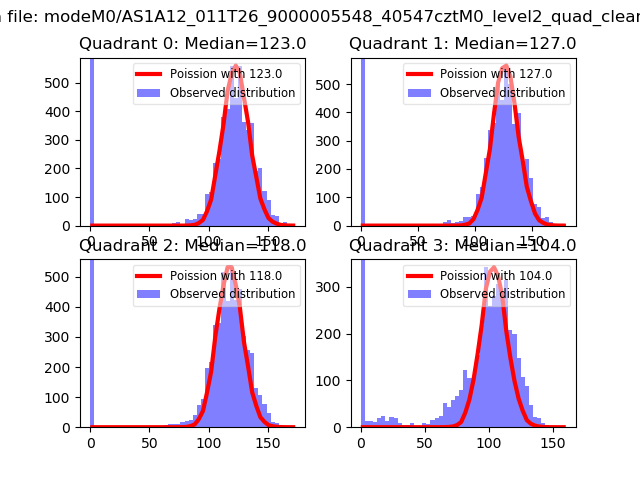
| Comparison with Poisson distribution Blue bars denote a histogram of data divided into 1 sec bins. Red curve is a Poisson curve with rate = median count rate of data. |
 |
 |
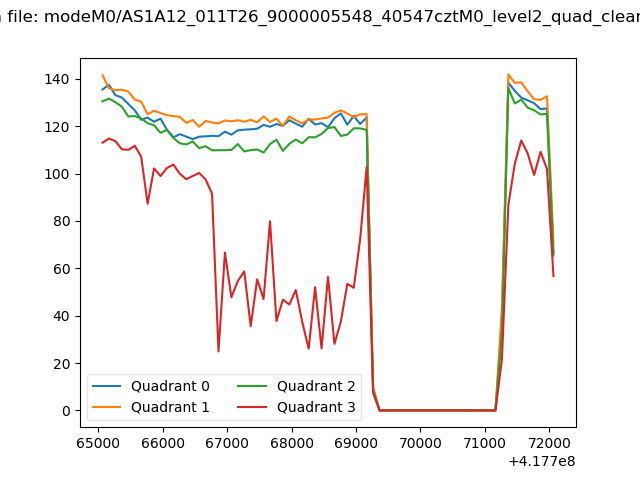
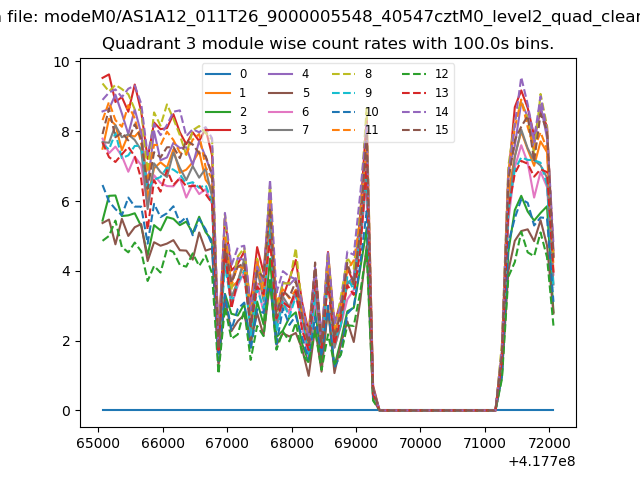
| Quadrant-wise count rates Data is divided into 100 sec bins |
 |
|
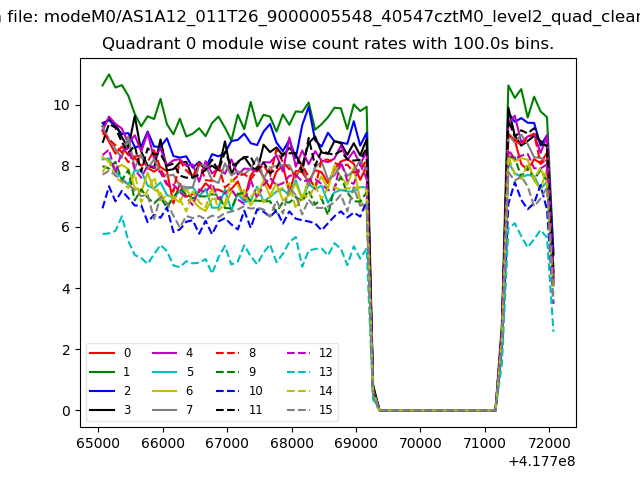
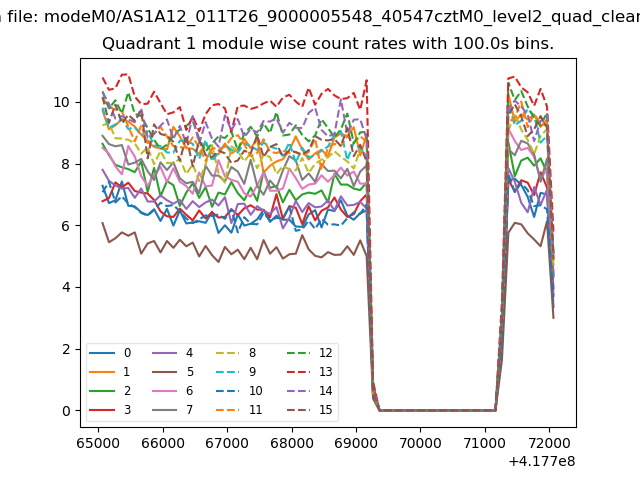
| Module-wise count rates for Quadrant A Data is divided into 100 sec bins |
 |
 |
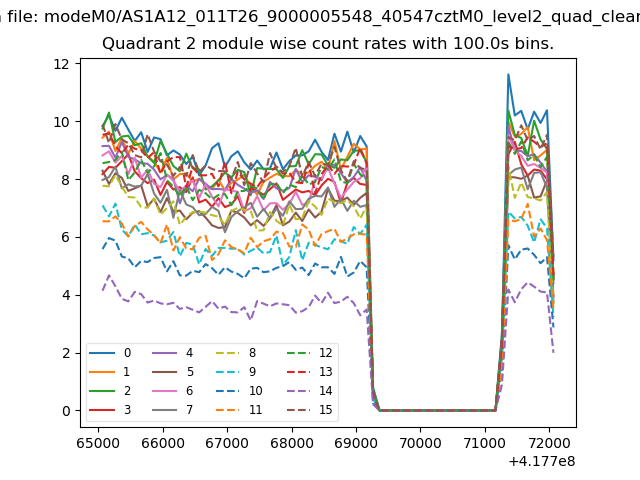
| Module-wise count rates for Quadrant B Data is divided into 100 sec bins |
 |
 |
| Module-wise count rates for Quadrant C Data is divided into 100 sec bins |
 |
 |
| Module-wise count rates for Quadrant D Data is divided into 100 sec bins |
 |
 |
| Parameter | Plot |
|---|---|
| CZT HV Monitor | 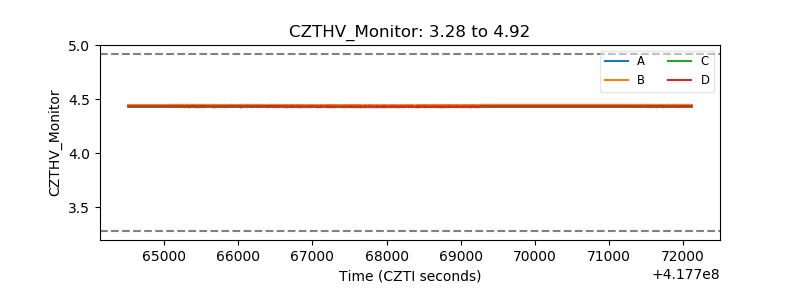 |
| D_VDD | 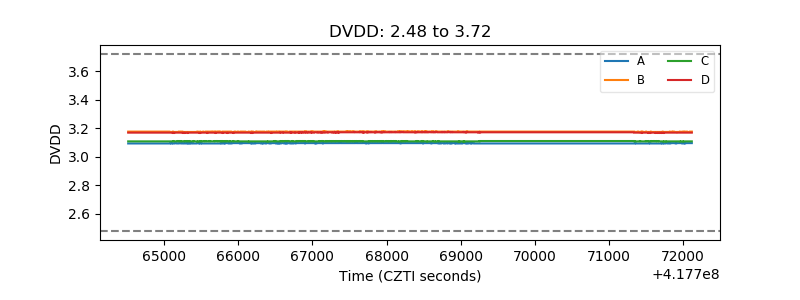 |
| Temperature 1 | 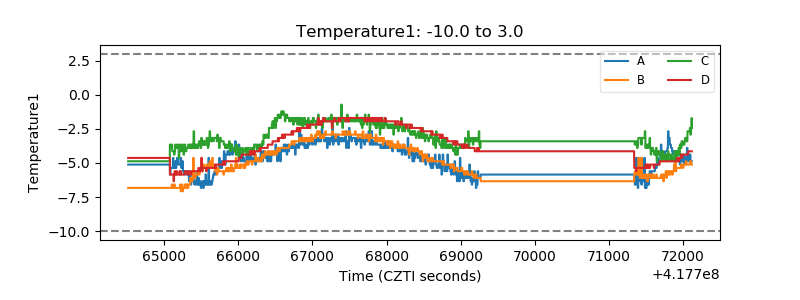 |
| Veto HV Monitor | 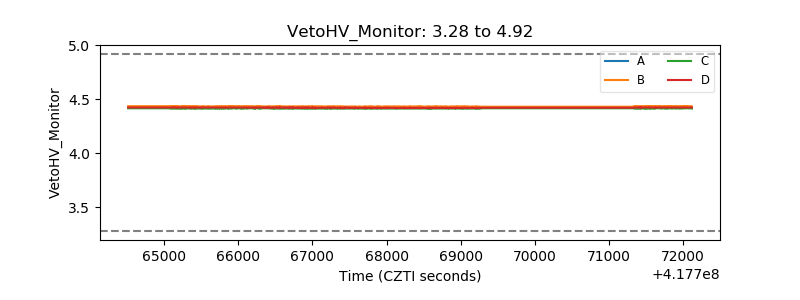 |
| Veto LLD | 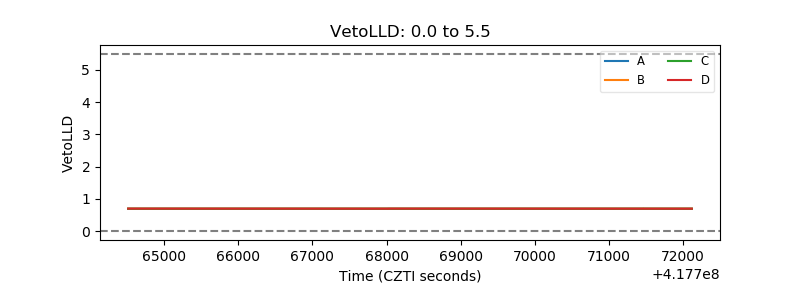 |
| Alpha Counter | 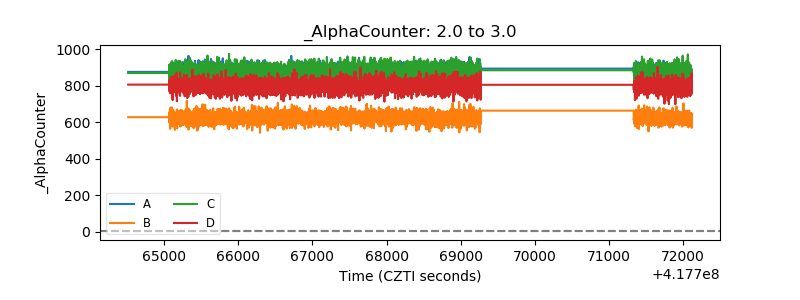 |
| _CPM_Rate | 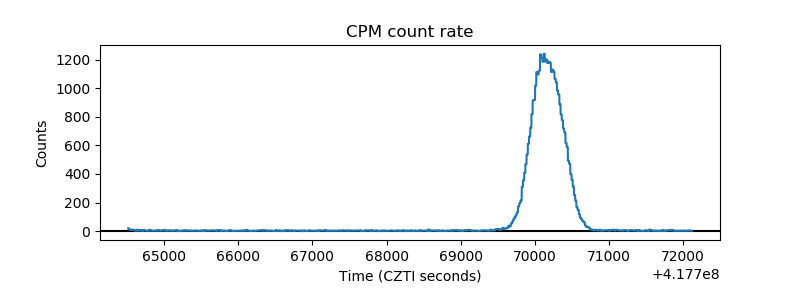 |
| CZT Counter | 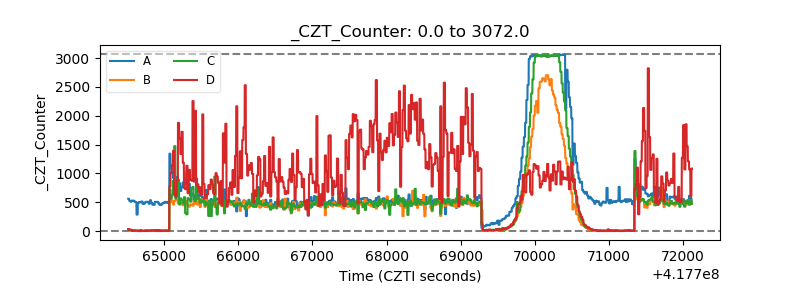 |
| +2.5 Volts monitor | 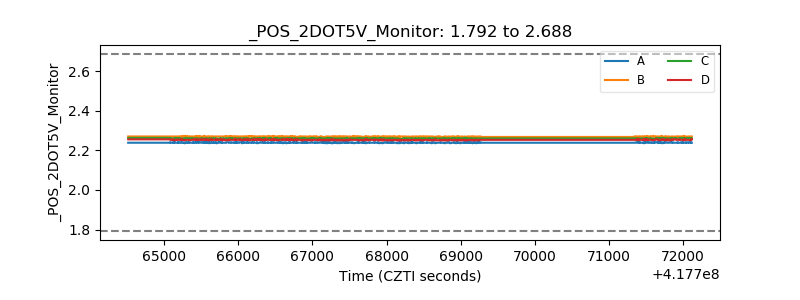 |
| +5 Volts monitor | 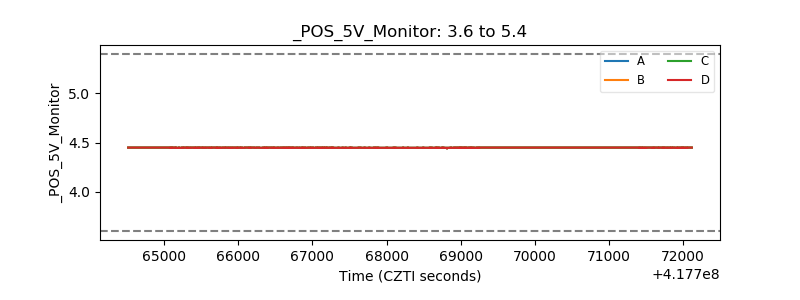 |
| _ROLL_ROT | 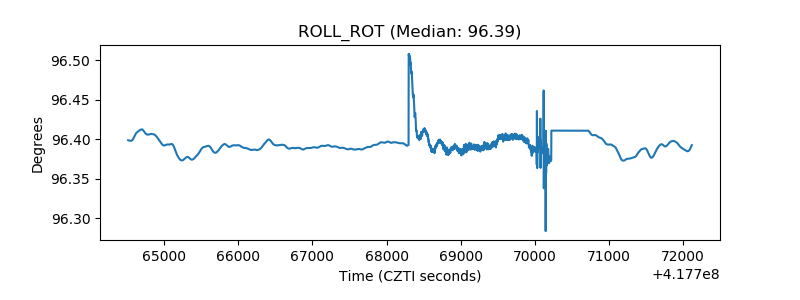 |
| _Roll_DEC | 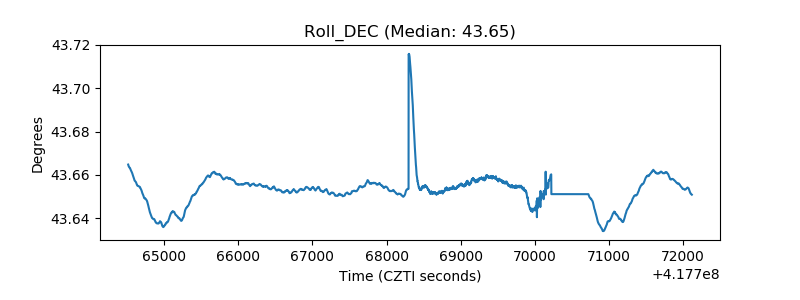 |
| _Roll_RA | 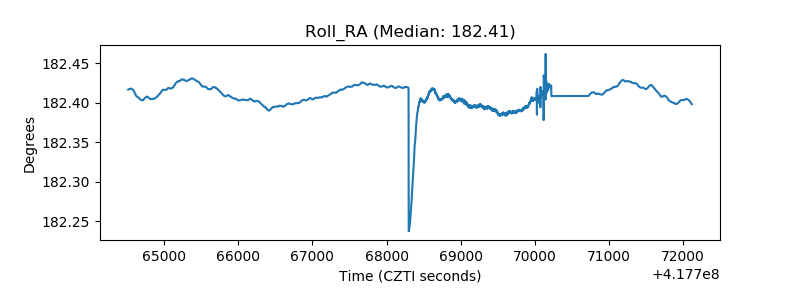 |
| Veto Counter | 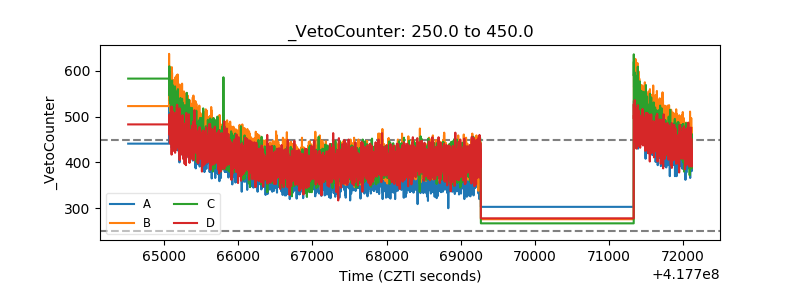 |