| Param | Original file | Final file |
|---|---|---|
| Filename | modeM0/AS1A12_011T26_9000005548_40548cztM0_level2.fits | modeM0/AS1A12_011T26_9000005548_40548cztM0_level2_quad_clean.evt |
| Size (bytes) | 408,968,640 | 85,628,160 |
| Size | 390.0 MB | 81.7 MB |
| Events in quadrant A | 2,877,724 | 639,365 |
| Events in quadrant B | 3,188,950 | 605,728 |
| Events in quadrant C | 2,593,994 | 612,452 |
| Events in quadrant D | 6,073,579 | 372,262 |
| Mode M0 | |||
|---|---|---|---|
| Quadrant | BADHDUFLAG | Total packets | Discarded packets |
| A | 0 | 11505 | 3 |
| B | 0 | 12681 | 2 |
| C | 0 | 10708 | 2 |
| D | 0 | 21689 | 2 |
| Mode SS | |||
|---|---|---|---|
| Quadrant | BADHDUFLAG | Total packets | Discarded packets |
| A | 0 | 106 | 0 |
| B | 0 | 106 | 0 |
| C | 0 | 106 | 0 |
| D | 0 | 106 | 0 |
| Mode M9 | |||
|---|---|---|---|
| Quadrant | BADHDUFLAG | Total packets | Discarded packets |
| A | 0 | 26 | 0 |
| B | 0 | 26 | 0 |
| C | 0 | 26 | 0 |
| D | 0 | 27 | 0 |
| Quadrant | Total seconds | Saturated seconds | Saturation percentage |
|---|---|---|---|
| A | 5181 | 8 | 0.154410% |
| B | 5181 | 405 | 7.817024% |
| C | 5181 | 13 | 0.250917% |
| D | 5181 | 2073 | 40.011581% |
Noise dominated data is calculated using 1-second bins in cleaned event files. If a bin has >2000 counts, and if more than 50% of those come from <1% of pixels, then it is considered to be noise-dominated and hence unusable.
| Quadrant | # 1 sec bins | Bins with >0 counts | Bins with >2000 counts | High rate bins dominated by noise | Noise dominated (total time) | Noise dominated (detector-on time) | Marked lightcurve |
|---|---|---|---|---|---|---|---|
| A | 7304 | 5182 | 2 | 2 | 0.03% | 0.04% | 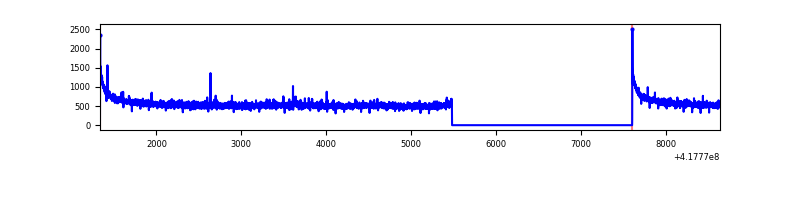 |
| B | 7304 | 5182 | 338 | 338 | 4.63% | 6.52% | 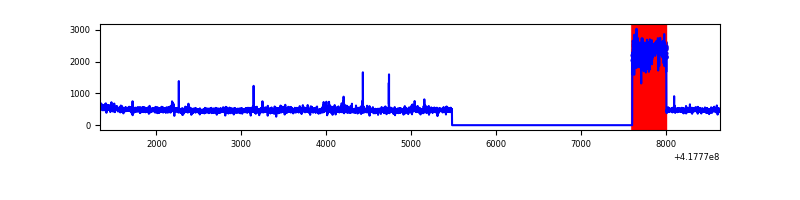 |
| C | 7304 | 5182 | 12 | 12 | 0.16% | 0.23% | 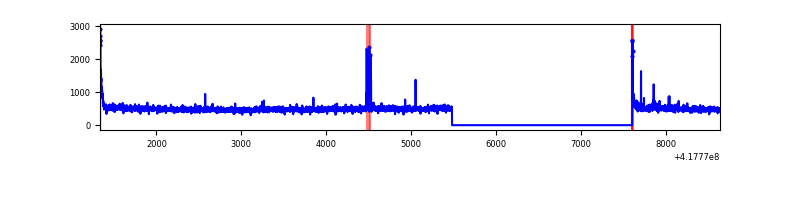 |
| D | 7304 | 5181 | 614 | 614 | 8.41% | 11.85% | 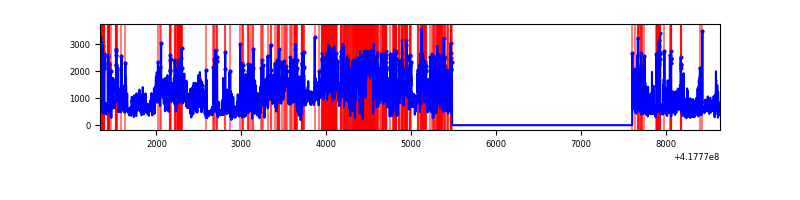 |
Top three noisy pixels from each quadrant. If the there are fewer than three noisy pixels in the level2.evt file, extra rows are filled as -1
| Pixel properties | Quadrant properties | ||||||
|---|---|---|---|---|---|---|---|
| Quadrant | DetID | PixID | Counts | Sigma | Mean | Median | Sigma |
| A | 10 | 83 | 475949 | 3870.86 | 610 | 601 | 122.8 |
| A | 12 | 189 | 26126 | 207.86 | 610 | 601 | 122.8 |
| A | 3 | 137 | 6441 | 47.56 | 610 | 601 | 122.8 |
| B | 7 | 202 | 781551 | 7043.12 | 586 | 571 | 110.9 |
| B | 3 | 112 | 46465 | 413.89 | 586 | 571 | 110.9 |
| B | 4 | 171 | 26331 | 232.31 | 586 | 571 | 110.9 |
| C | 15 | 214 | 227334 | 1679.55 | 583 | 590 | 135.0 |
| C | 0 | 10 | 47771 | 349.48 | 583 | 590 | 135.0 |
| C | 14 | 254 | 30256 | 219.74 | 583 | 590 | 135.0 |
| D | 12 | 227 | 1818068 | 15261.88 | 486 | 473 | 119.1 |
| D | 2 | 250 | 1280089 | 10744.61 | 486 | 473 | 119.1 |
| D | 5 | 32 | 753519 | 6323.14 | 486 | 473 | 119.1 |
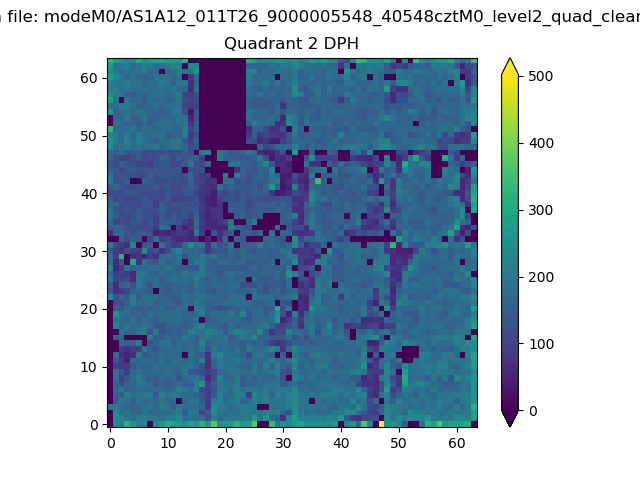
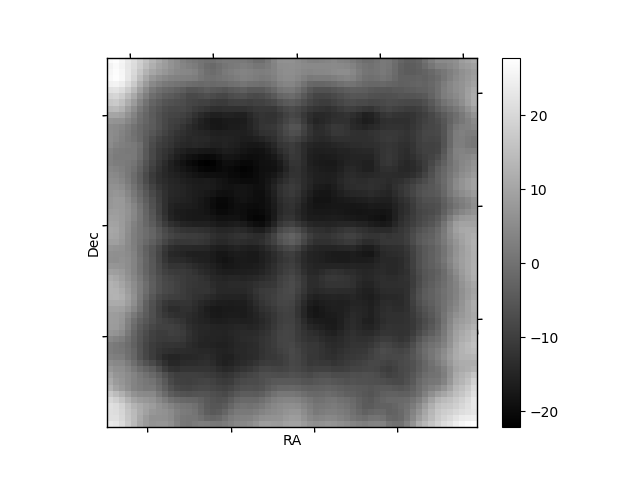
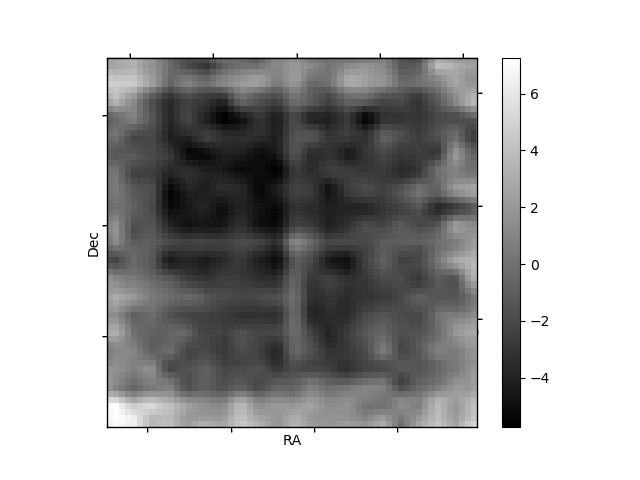
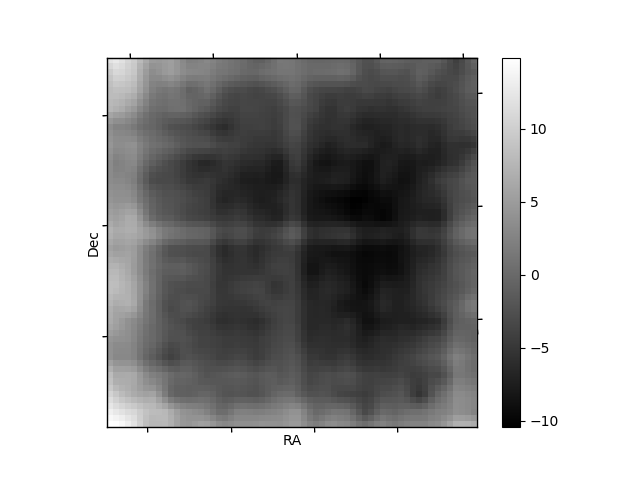
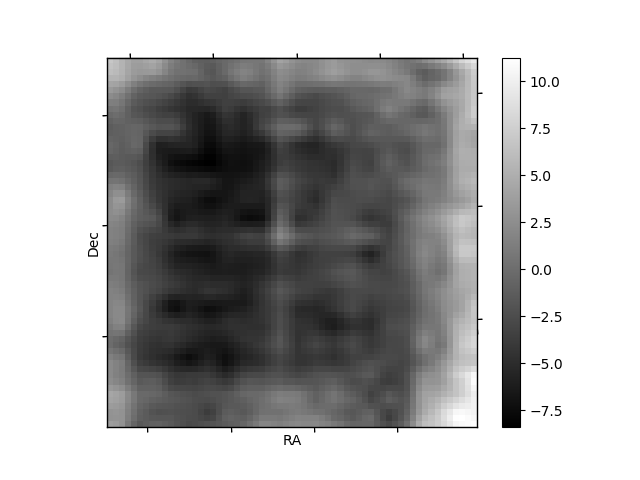
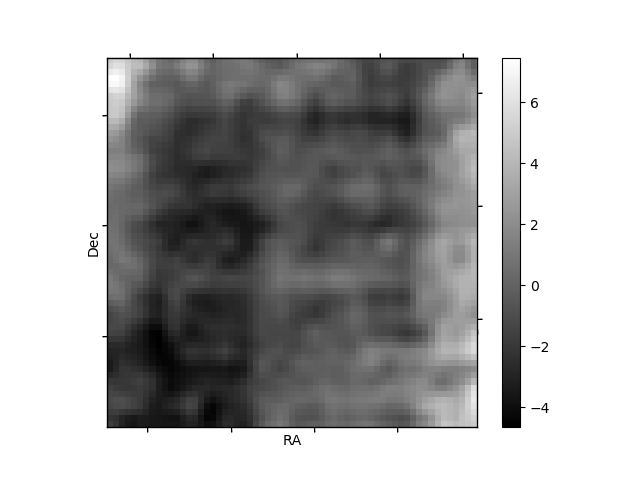
Histogram calculated using DETX and DETY for each event in the final _common_clean file
| Quadrant A | 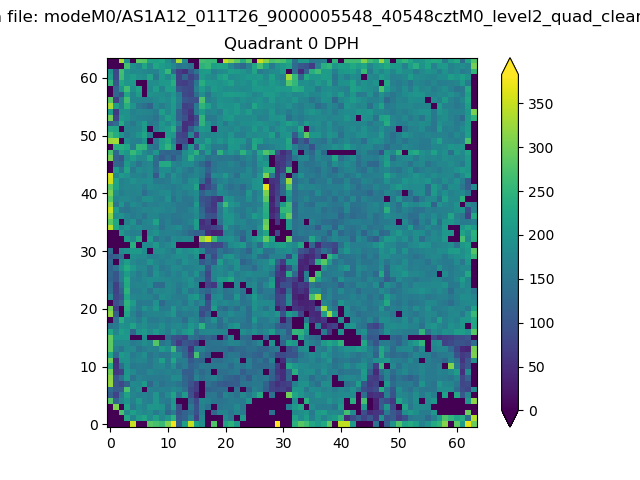 |
 |
Quadrant B |
|---|---|---|---|
| Quadrant D | 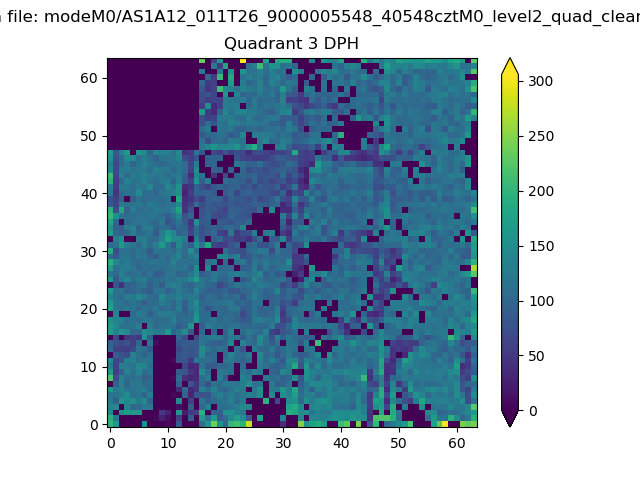 |
 |
Quadrant C |
| Plot type | Count rate plots | Images |
|---|---|---|
| Comparison with Poisson distribution Blue bars denote a histogram of data divided into 1 sec bins. Red curve is a Poisson curve with rate = median count rate of data. |
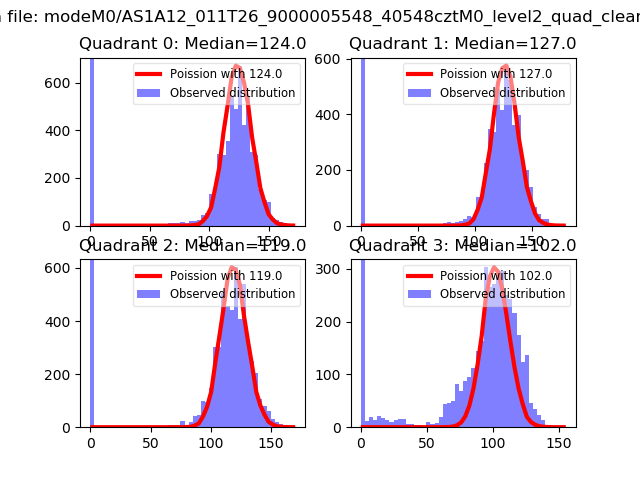 |
 |
| Quadrant-wise count rates Data is divided into 100 sec bins |
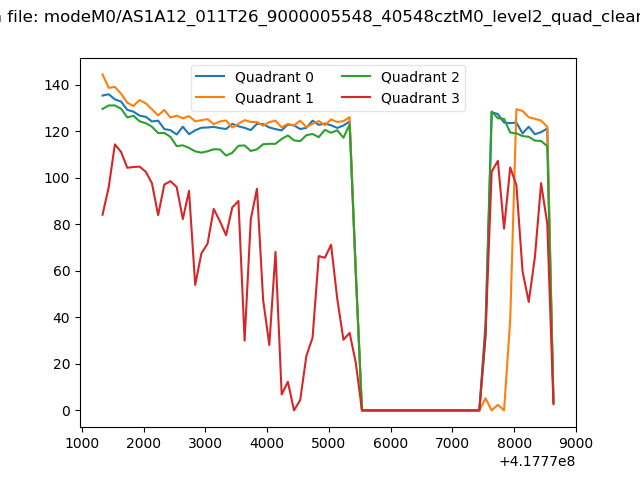 |
|
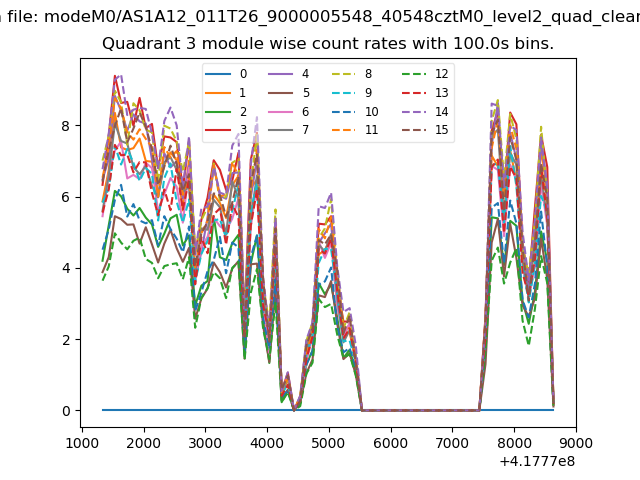
| Module-wise count rates for Quadrant A Data is divided into 100 sec bins |
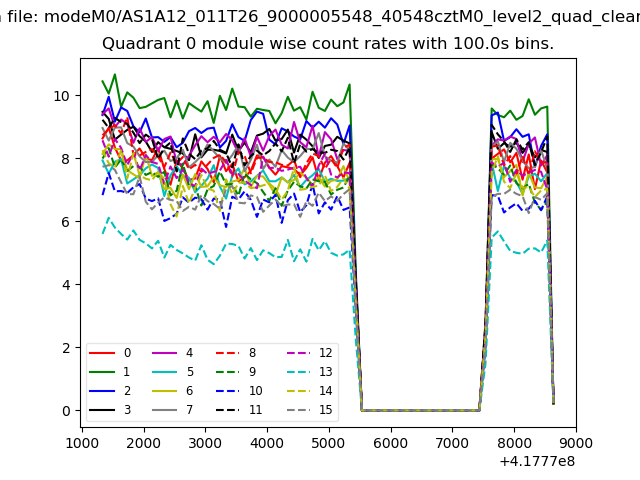 |
 |
| Module-wise count rates for Quadrant B Data is divided into 100 sec bins |
 |
 |
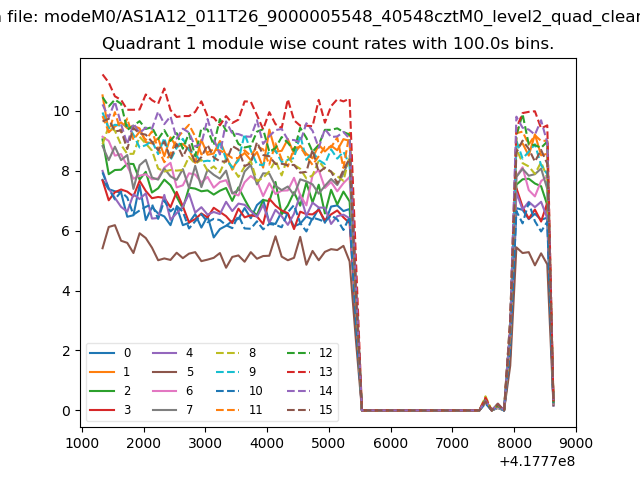
| Module-wise count rates for Quadrant C Data is divided into 100 sec bins |
 |
 |
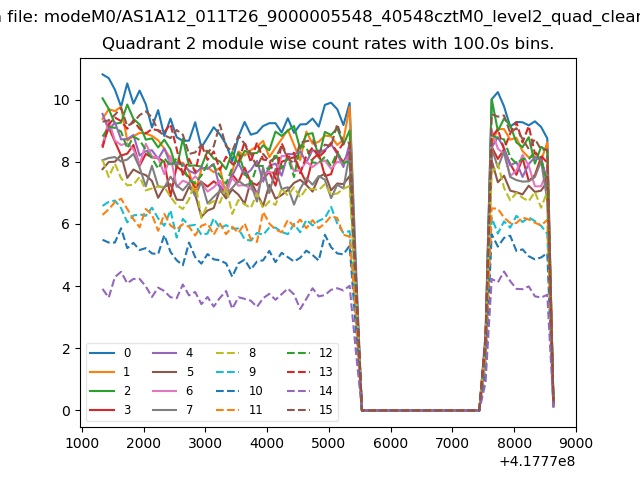
| Module-wise count rates for Quadrant D Data is divided into 100 sec bins |
 |
 |
| Parameter | Plot |
|---|---|
| CZT HV Monitor | 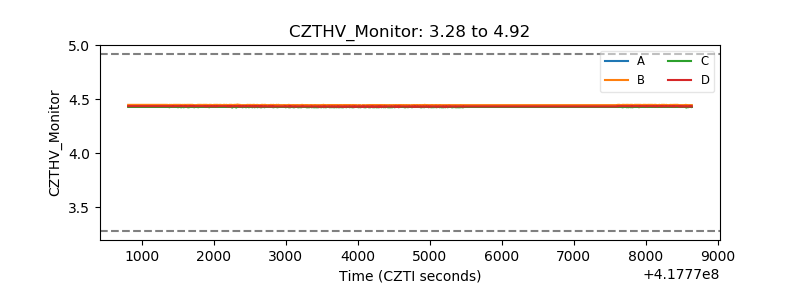 |
| D_VDD | 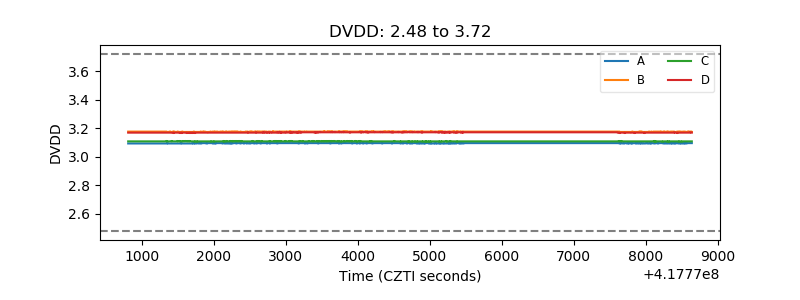 |
| Temperature 1 | 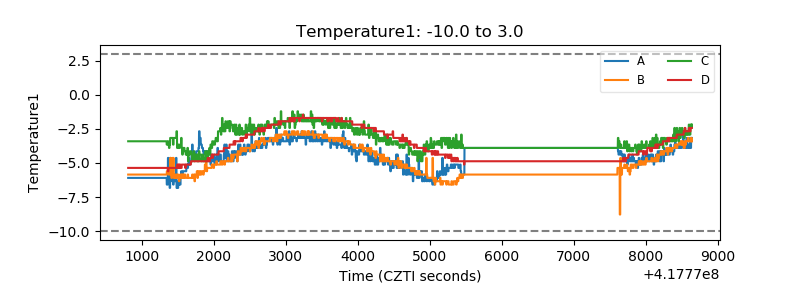 |
| Veto HV Monitor |  |
| Veto LLD | 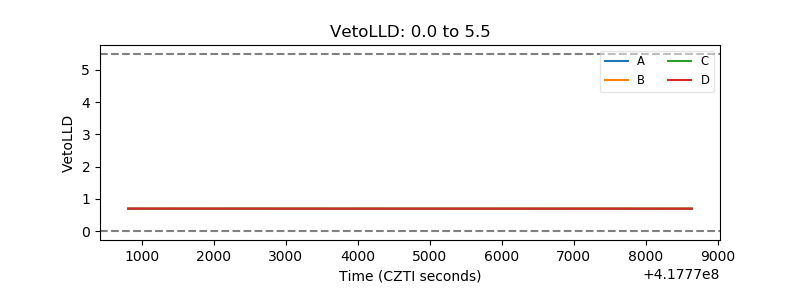 |
| Alpha Counter | 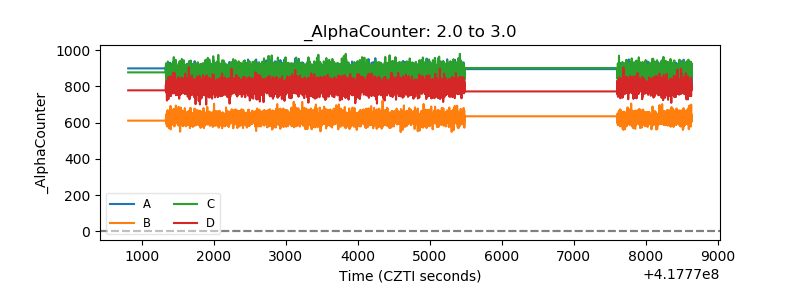 |
| _CPM_Rate | 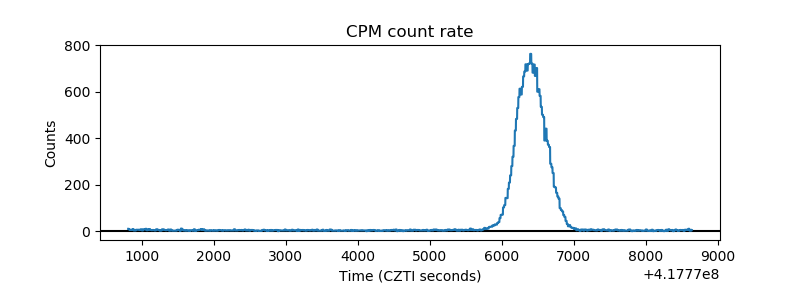 |
| CZT Counter | 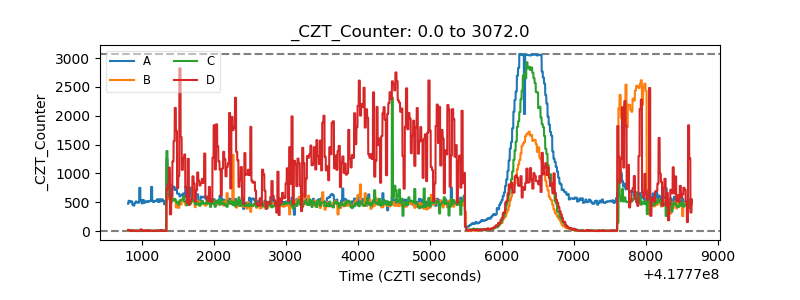 |
| +2.5 Volts monitor | 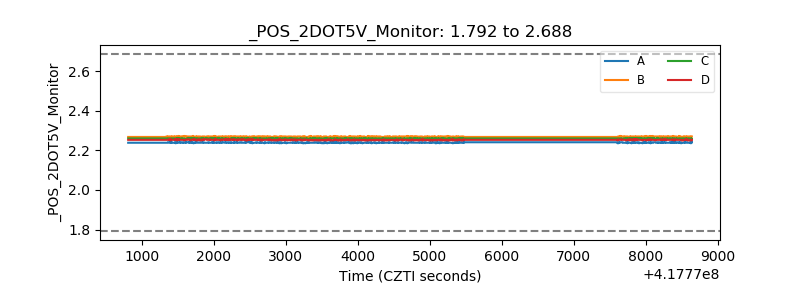 |
| +5 Volts monitor | 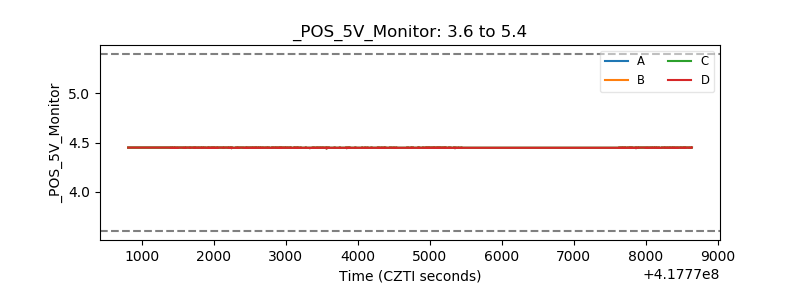 |
| _ROLL_ROT | 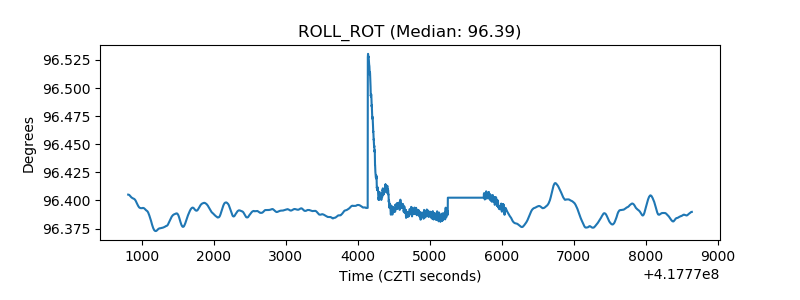 |
| _Roll_DEC | 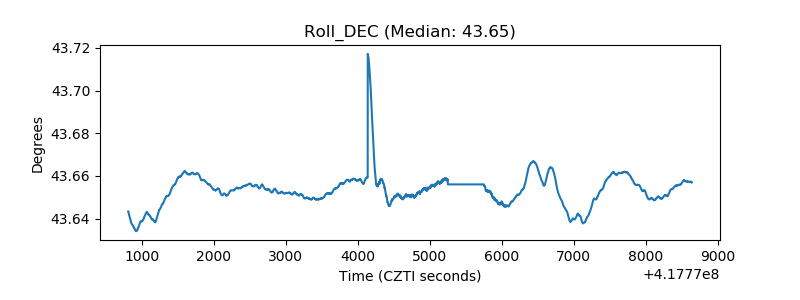 |
| _Roll_RA | 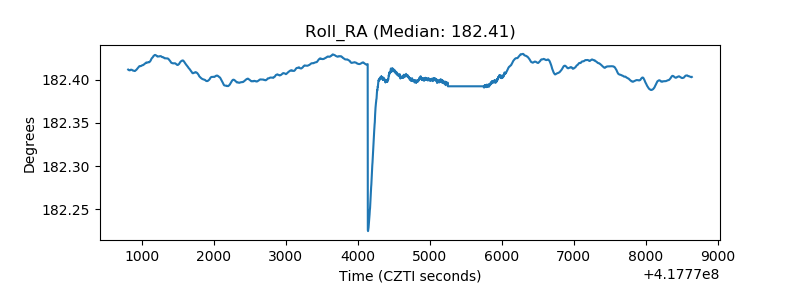 |
| Veto Counter | 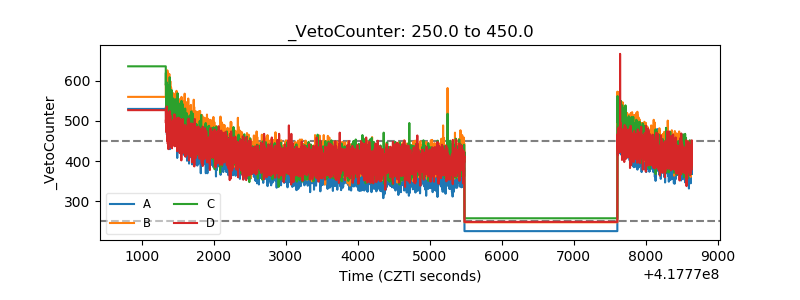 |