| Param | Original file | Final file |
|---|---|---|
| Filename | modeM0/AS1A12_011T26_9000005548_40549cztM0_level2.fits | modeM0/AS1A12_011T26_9000005548_40549cztM0_level2_quad_clean.evt |
| Size (bytes) | 359,130,240 | 84,456,000 |
| Size | 342.5 MB | 80.5 MB |
| Events in quadrant A | 2,836,343 | 615,860 |
| Events in quadrant B | 3,151,056 | 578,302 |
| Events in quadrant C | 2,522,616 | 584,787 |
| Events in quadrant D | 4,379,542 | 415,393 |
| Mode M0 | |||
|---|---|---|---|
| Quadrant | BADHDUFLAG | Total packets | Discarded packets |
| A | 0 | 11452 | 30 |
| B | 0 | 12680 | 50 |
| C | 0 | 10632 | 51 |
| D | 0 | 16708 | 62 |
| Mode SS | |||
|---|---|---|---|
| Quadrant | BADHDUFLAG | Total packets | Discarded packets |
| A | 0 | 108 | 0 |
| B | 0 | 108 | 0 |
| C | 0 | 108 | 0 |
| D | 0 | 108 | 0 |
| Mode M9 | |||
|---|---|---|---|
| Quadrant | BADHDUFLAG | Total packets | Discarded packets |
| A | 0 | 38 | 0 |
| B | 0 | 38 | 0 |
| C | 0 | 38 | 0 |
| D | 0 | 39 | 0 |
| Quadrant | Total seconds | Saturated seconds | Saturation percentage |
|---|---|---|---|
| A | 5180 | 15 | 0.289575% |
| B | 5164 | 403 | 7.804028% |
| C | 5168 | 16 | 0.309598% |
| D | 5181 | 1475 | 28.469407% |
Noise dominated data is calculated using 1-second bins in cleaned event files. If a bin has >2000 counts, and if more than 50% of those come from <1% of pixels, then it is considered to be noise-dominated and hence unusable.
| Quadrant | # 1 sec bins | Bins with >0 counts | Bins with >2000 counts | High rate bins dominated by noise | Noise dominated (total time) | Noise dominated (detector-on time) | Marked lightcurve |
|---|---|---|---|---|---|---|---|
| A | 7321 | 5195 | 2 | 2 | 0.03% | 0.04% | 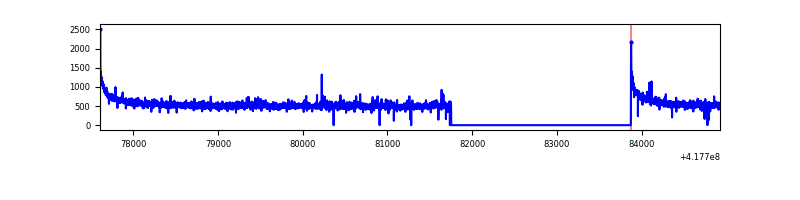 |
| B | 7321 | 5187 | 338 | 338 | 4.62% | 6.52% | 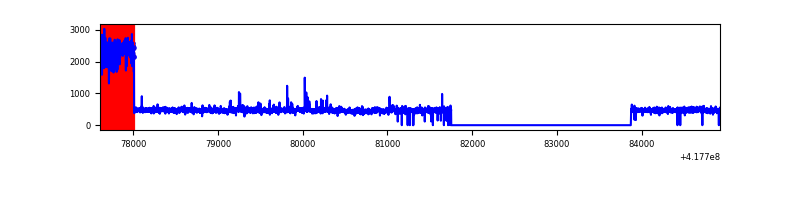 |
| C | 7321 | 5188 | 9 | 9 | 0.12% | 0.17% | 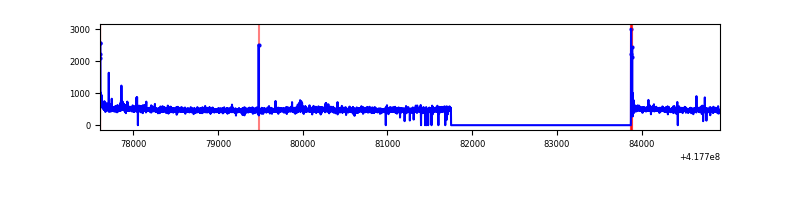 |
| D | 7321 | 5192 | 247 | 247 | 3.37% | 4.76% | 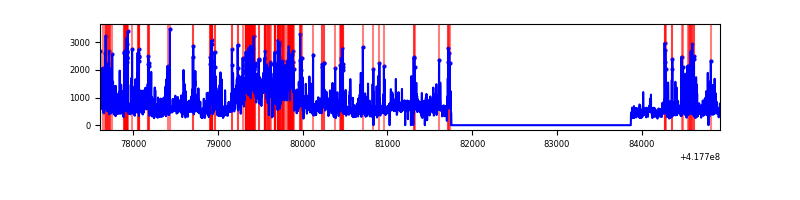 |
Top three noisy pixels from each quadrant. If the there are fewer than three noisy pixels in the level2.evt file, extra rows are filled as -1
| Pixel properties | Quadrant properties | ||||||
|---|---|---|---|---|---|---|---|
| Quadrant | DetID | PixID | Counts | Sigma | Mean | Median | Sigma |
| A | 10 | 83 | 474176 | 3958.54 | 593 | 582 | 119.6 |
| A | 2 | 79 | 39112 | 322.05 | 593 | 582 | 119.6 |
| A | 3 | 1 | 17381 | 140.41 | 593 | 582 | 119.6 |
| B | 7 | 202 | 781477 | 7199.69 | 568 | 554 | 108.5 |
| B | 3 | 112 | 77036 | 705.12 | 568 | 554 | 108.5 |
| B | 4 | 171 | 33526 | 303.98 | 568 | 554 | 108.5 |
| C | 15 | 214 | 228663 | 1727.72 | 571 | 574 | 132.0 |
| C | 0 | 10 | 26232 | 194.35 | 571 | 574 | 132.0 |
| C | 14 | 254 | 25233 | 186.79 | 571 | 574 | 132.0 |
| D | 12 | 227 | 909055 | 7365.95 | 502 | 490 | 123.3 |
| D | 2 | 250 | 686005 | 5557.63 | 502 | 490 | 123.3 |
| D | 5 | 32 | 508902 | 4121.82 | 502 | 490 | 123.3 |
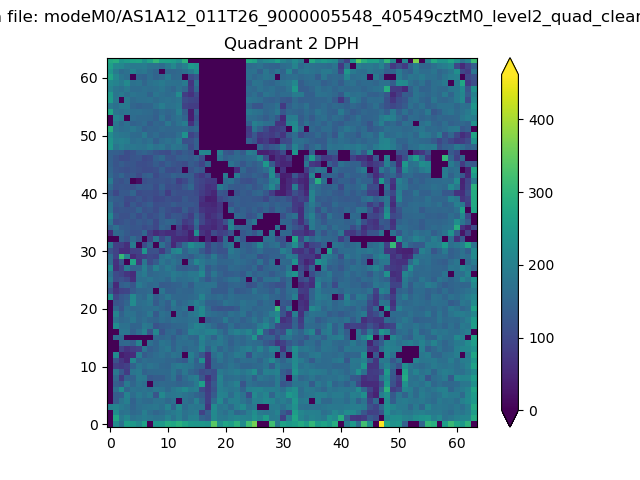
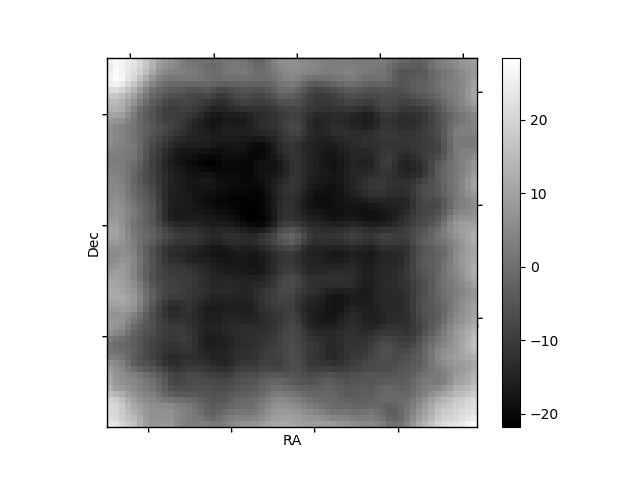
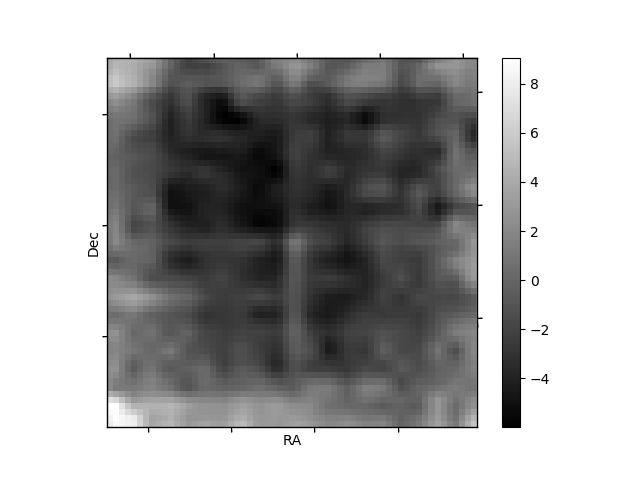
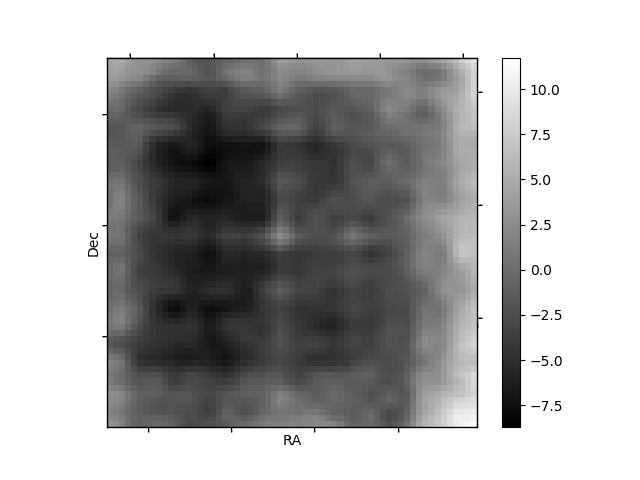
Histogram calculated using DETX and DETY for each event in the final _common_clean file
| Quadrant A | 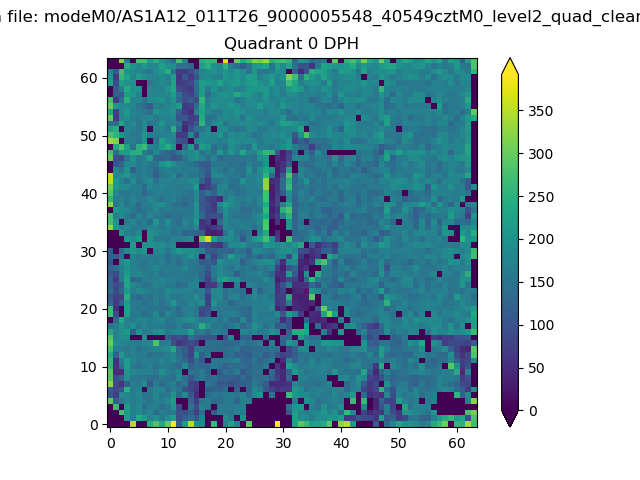 |
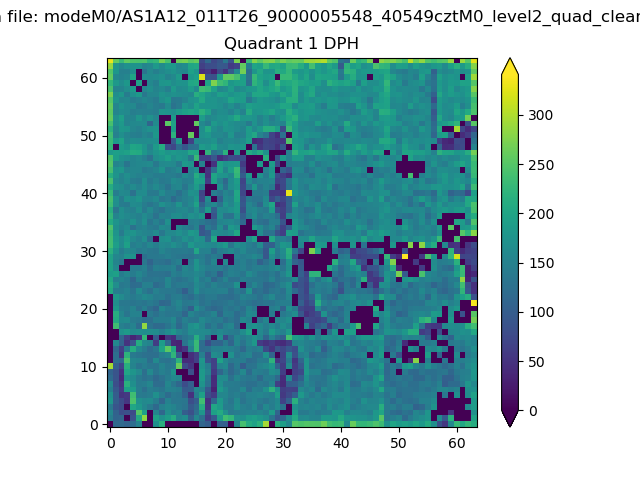 |
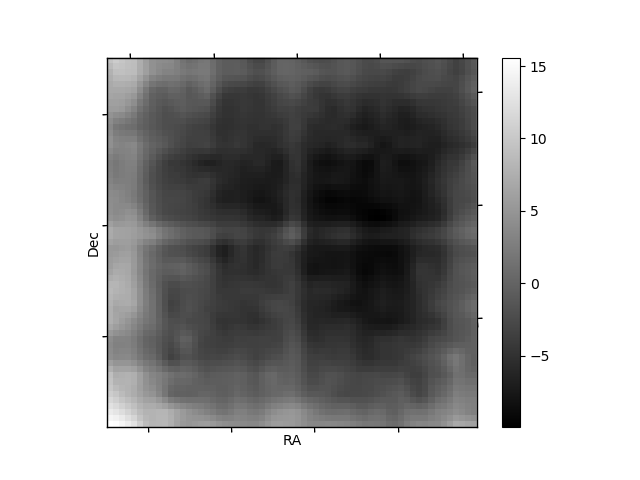
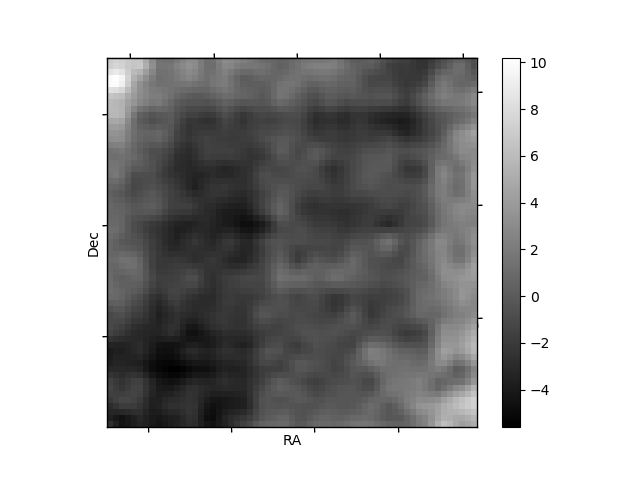
Quadrant B |
|---|---|---|---|
| Quadrant D | 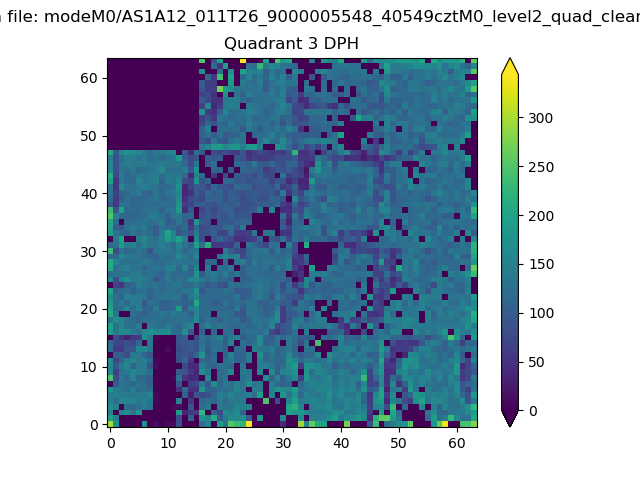 |
 |
Quadrant C |
| Plot type | Count rate plots | Images |
|---|---|---|
| Comparison with Poisson distribution Blue bars denote a histogram of data divided into 1 sec bins. Red curve is a Poisson curve with rate = median count rate of data. |
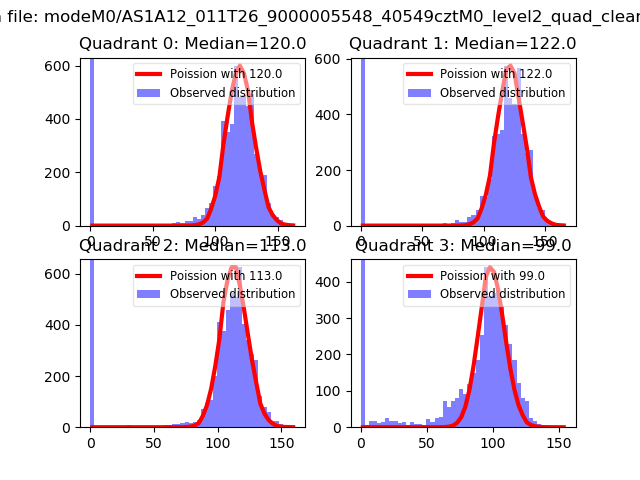 |
 |
| Quadrant-wise count rates Data is divided into 100 sec bins |
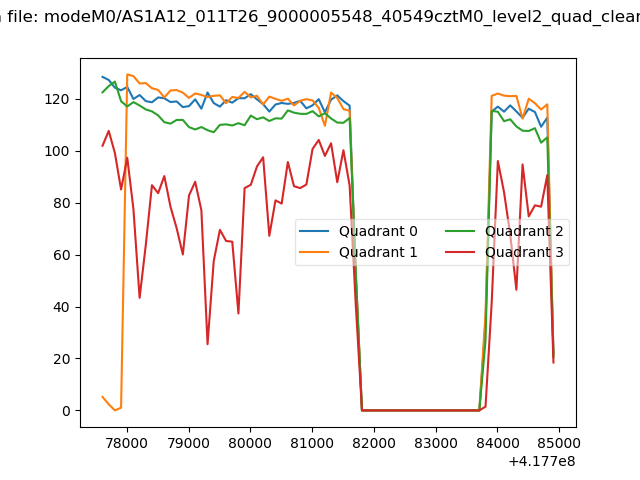 |
|
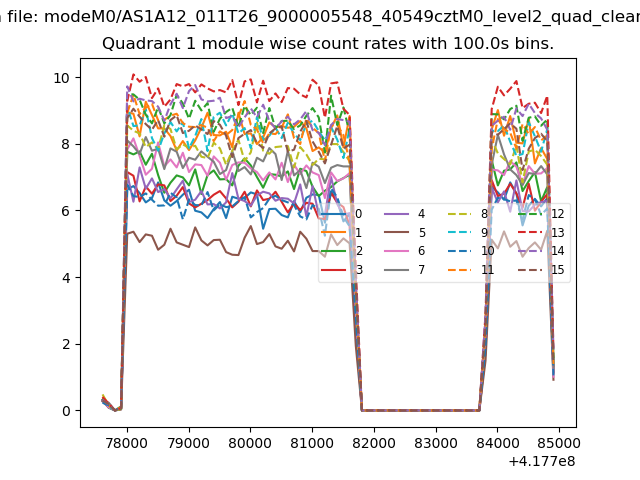
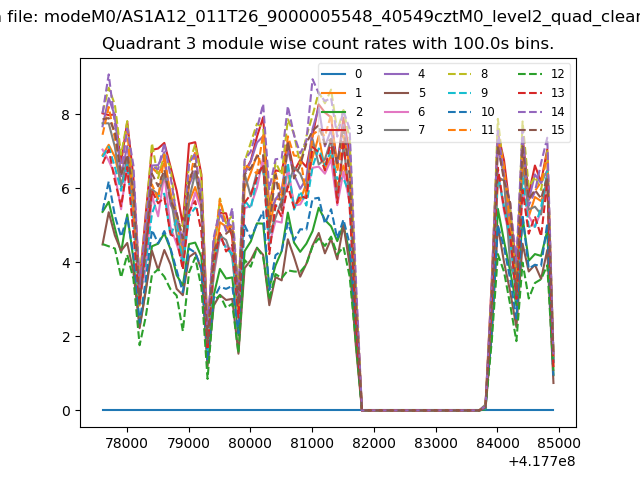
| Module-wise count rates for Quadrant A Data is divided into 100 sec bins |
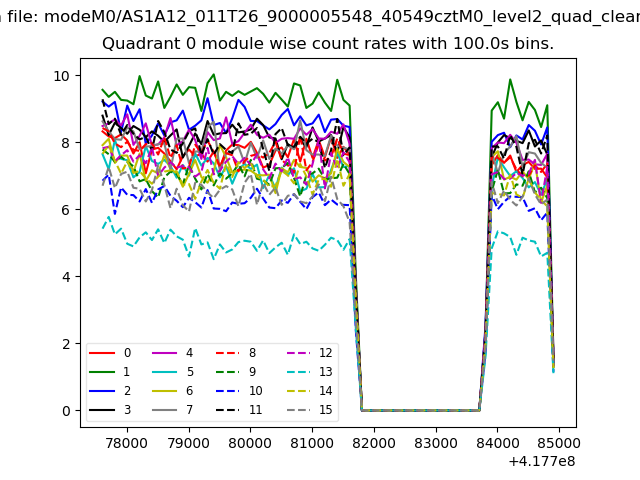 |
 |
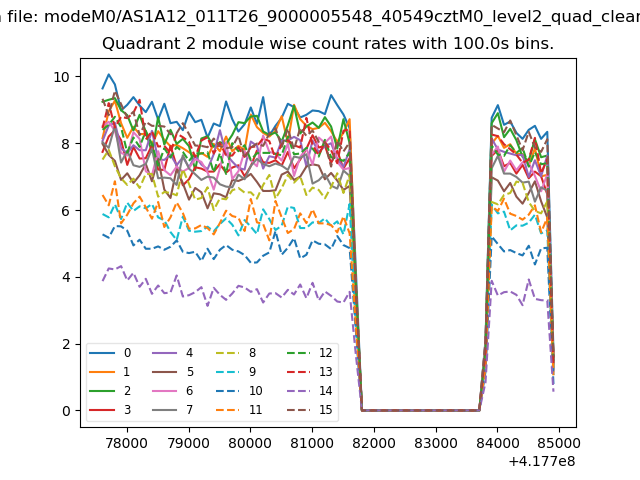
| Module-wise count rates for Quadrant B Data is divided into 100 sec bins |
 |
 |
| Module-wise count rates for Quadrant C Data is divided into 100 sec bins |
 |
 |
| Module-wise count rates for Quadrant D Data is divided into 100 sec bins |
 |
 |
| Parameter | Plot |
|---|---|
| CZT HV Monitor | 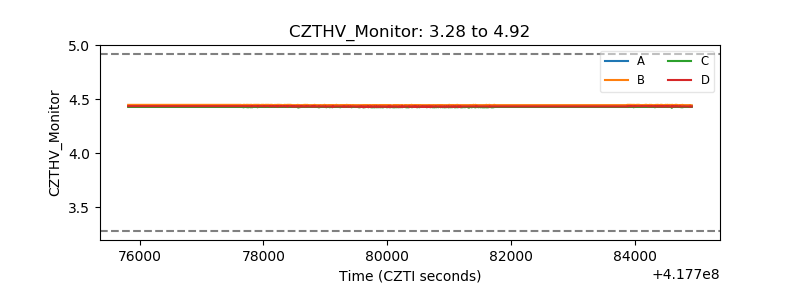 |
| D_VDD | 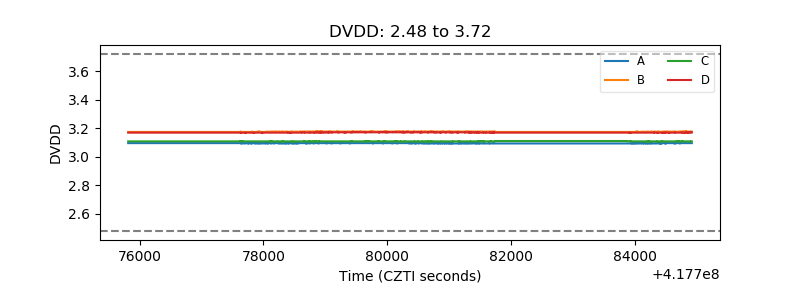 |
| Temperature 1 | 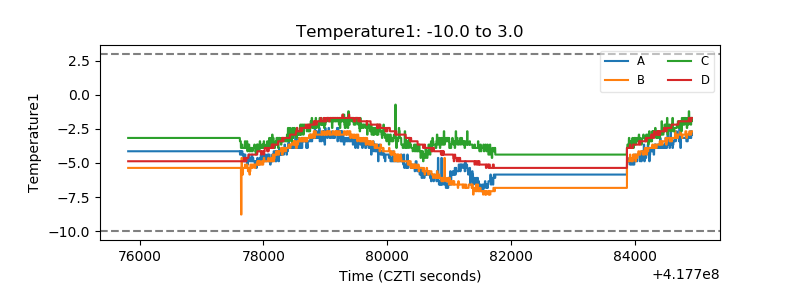 |
| Veto HV Monitor | 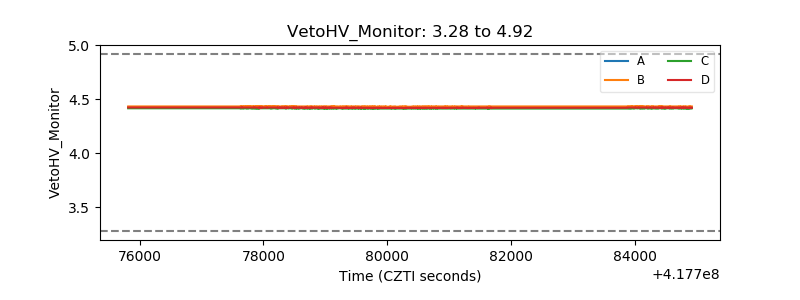 |
| Veto LLD | 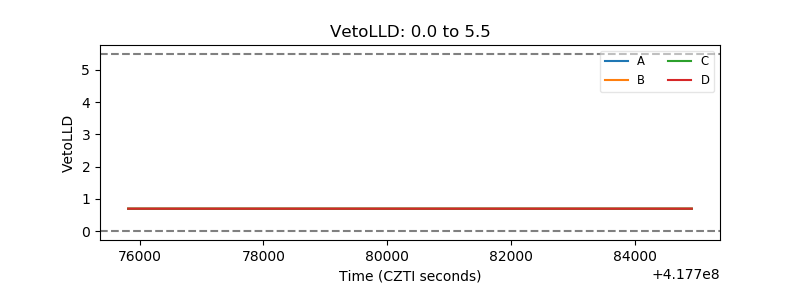 |
| Alpha Counter | 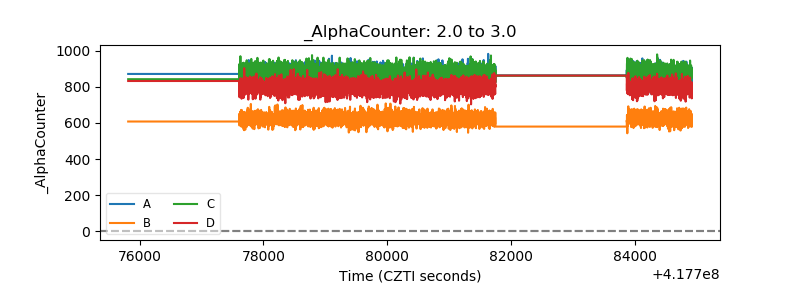 |
| _CPM_Rate |  |
| CZT Counter | 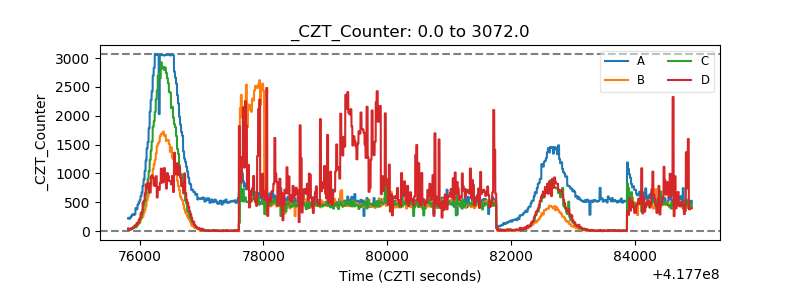 |
| +2.5 Volts monitor | 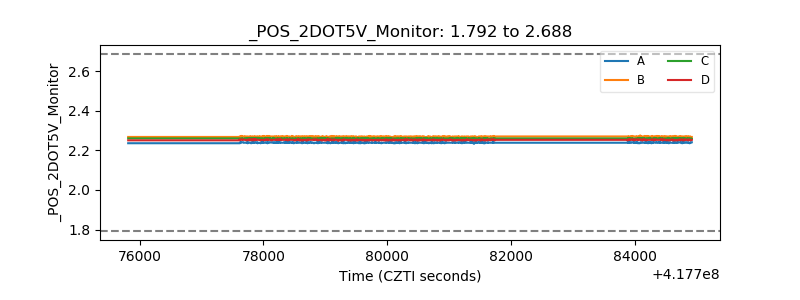 |
| +5 Volts monitor | 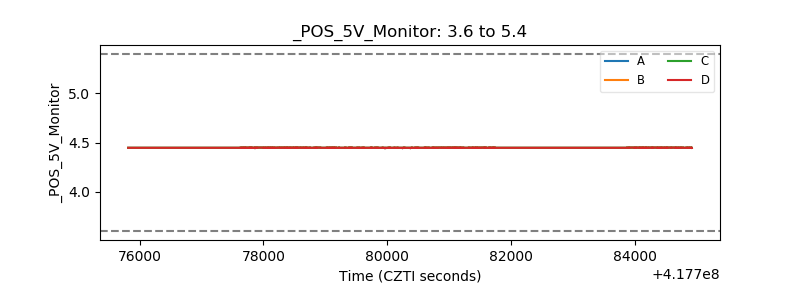 |
| _ROLL_ROT | 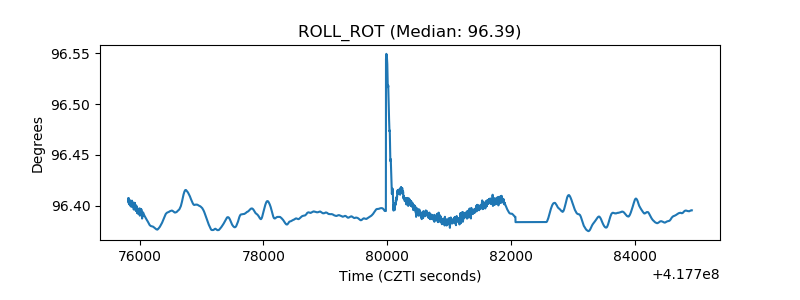 |
| _Roll_DEC | 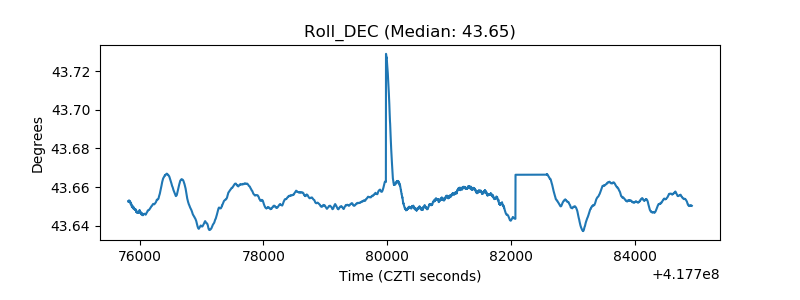 |
| _Roll_RA | 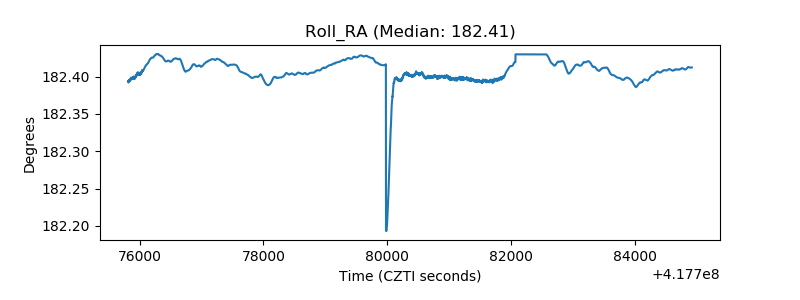 |
| Veto Counter | 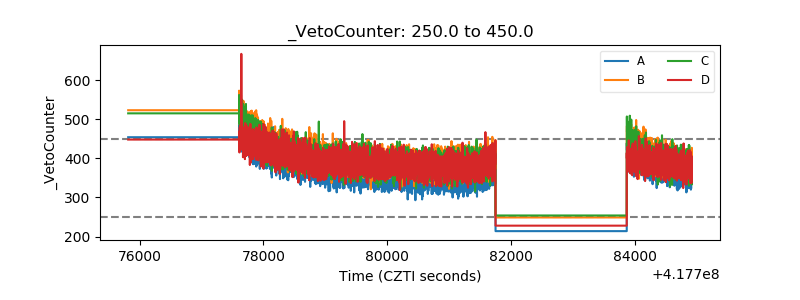 |