| Param | Original file | Final file |
|---|---|---|
| Filename | modeM0/AS1A12_011T26_9000005548_40550cztM0_level2.fits | modeM0/AS1A12_011T26_9000005548_40550cztM0_level2_quad_clean.evt |
| Size (bytes) | 320,529,600 | 84,343,680 |
| Size | 305.7 MB | 80.4 MB |
| Events in quadrant A | 2,821,540 | 600,896 |
| Events in quadrant B | 2,459,989 | 614,178 |
| Events in quadrant C | 2,529,819 | 573,408 |
| Events in quadrant D | 3,639,449 | 394,520 |
| Mode M0 | |||
|---|---|---|---|
| Quadrant | BADHDUFLAG | Total packets | Discarded packets |
| A | 0 | 11519 | 3 |
| B | 0 | 10732 | 2 |
| C | 0 | 10814 | 2 |
| D | 0 | 14455 | 2 |
| Mode SS | |||
|---|---|---|---|
| Quadrant | BADHDUFLAG | Total packets | Discarded packets |
| A | 0 | 108 | 0 |
| B | 0 | 108 | 0 |
| C | 0 | 108 | 0 |
| D | 0 | 108 | 0 |
| Mode M9 | |||
|---|---|---|---|
| Quadrant | BADHDUFLAG | Total packets | Discarded packets |
| A | 0 | 32 | 0 |
| B | 0 | 32 | 0 |
| C | 0 | 32 | 0 |
| D | 0 | 33 | 0 |
| Quadrant | Total seconds | Saturated seconds | Saturation percentage |
|---|---|---|---|
| A | 5292 | 11 | 0.207861% |
| B | 5292 | 7 | 0.132275% |
| C | 5292 | 14 | 0.264550% |
| D | 5292 | 1635 | 30.895692% |
Noise dominated data is calculated using 1-second bins in cleaned event files. If a bin has >2000 counts, and if more than 50% of those come from <1% of pixels, then it is considered to be noise-dominated and hence unusable.
| Quadrant | # 1 sec bins | Bins with >0 counts | Bins with >2000 counts | High rate bins dominated by noise | Noise dominated (total time) | Noise dominated (detector-on time) | Marked lightcurve |
|---|---|---|---|---|---|---|---|
| A | 7265 | 5293 | 2 | 2 | 0.03% | 0.04% | 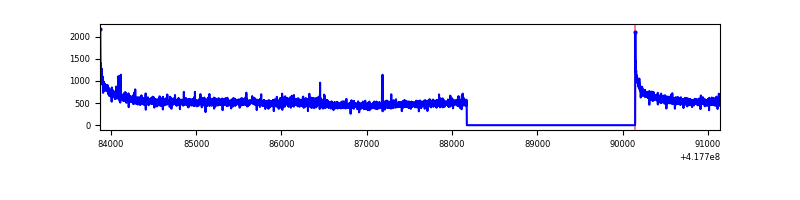 |
| B | 7265 | 5293 | 0 | 0 | 0.00% | 0.00% | 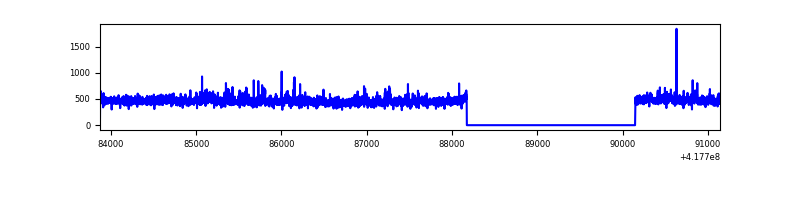 |
| C | 7265 | 5293 | 8 | 8 | 0.11% | 0.15% | 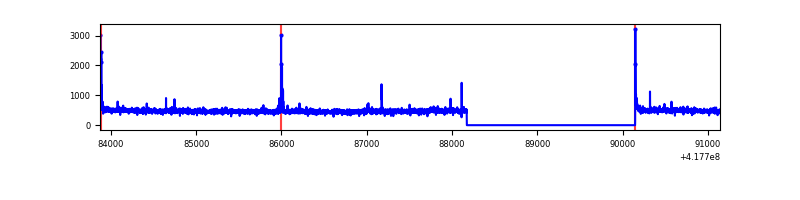 |
| D | 7264 | 5292 | 149 | 149 | 2.05% | 2.82% | 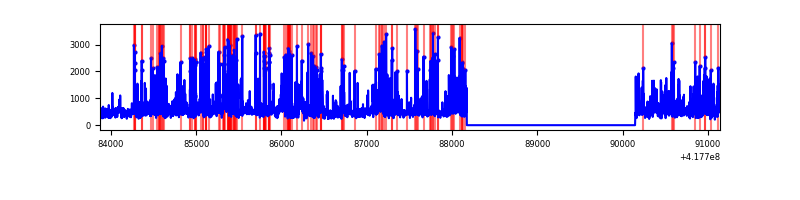 |
Top three noisy pixels from each quadrant. If the there are fewer than three noisy pixels in the level2.evt file, extra rows are filled as -1
| Pixel properties | Quadrant properties | ||||||
|---|---|---|---|---|---|---|---|
| Quadrant | DetID | PixID | Counts | Sigma | Mean | Median | Sigma |
| A | 10 | 83 | 474811 | 3963.08 | 585 | 574 | 119.7 |
| A | 6 | 10 | 50017 | 413.18 | 585 | 574 | 119.7 |
| A | 3 | 1 | 18363 | 148.66 | 585 | 574 | 119.7 |
| B | 3 | 112 | 121584 | 1082.63 | 580 | 563 | 111.8 |
| B | 0 | 230 | 19088 | 165.72 | 580 | 563 | 111.8 |
| B | 4 | 171 | 14706 | 126.52 | 580 | 563 | 111.8 |
| C | 15 | 214 | 233703 | 1754.43 | 569 | 571 | 132.9 |
| C | 14 | 254 | 33194 | 245.5 | 569 | 571 | 132.9 |
| C | 0 | 10 | 25006 | 183.88 | 569 | 571 | 132.9 |
| D | 12 | 227 | 888840 | 7412.5 | 483 | 469 | 119.8 |
| D | 2 | 250 | 421403 | 3512.24 | 483 | 469 | 119.8 |
| D | 12 | 191 | 280597 | 2337.37 | 483 | 469 | 119.8 |
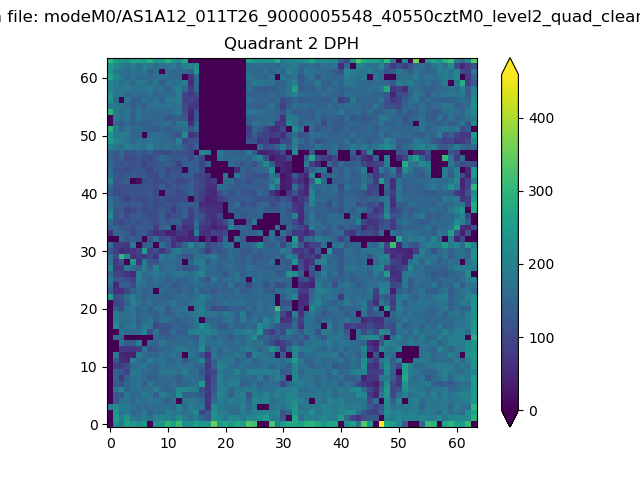
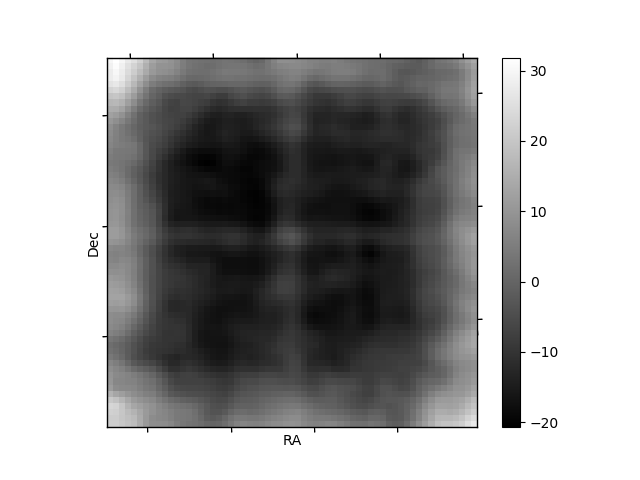
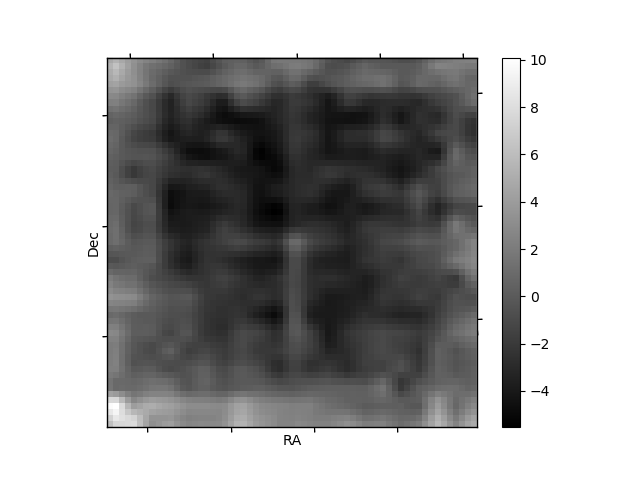
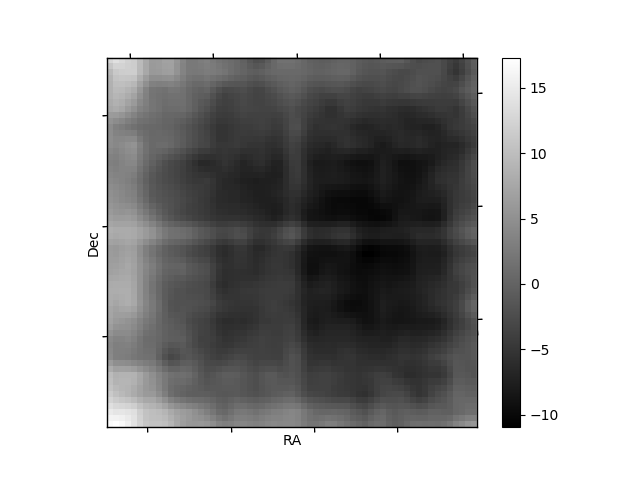
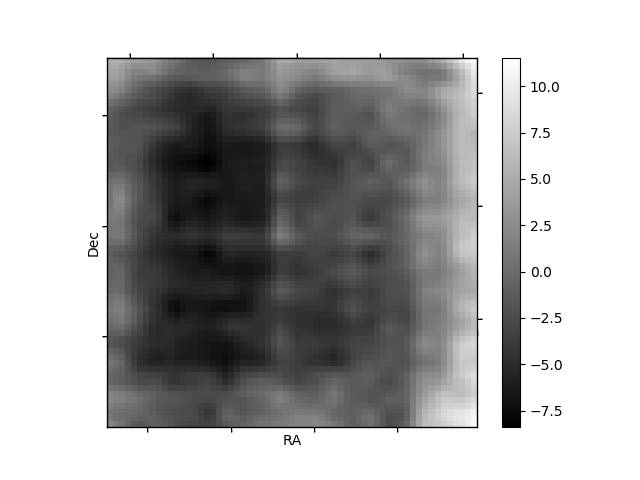
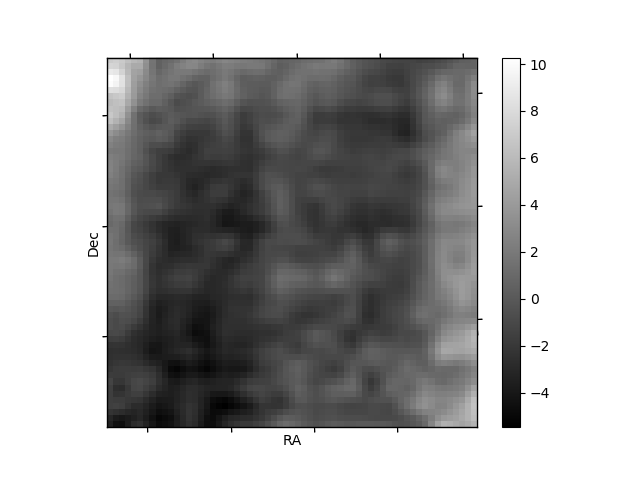
Histogram calculated using DETX and DETY for each event in the final _common_clean file
| Quadrant A | 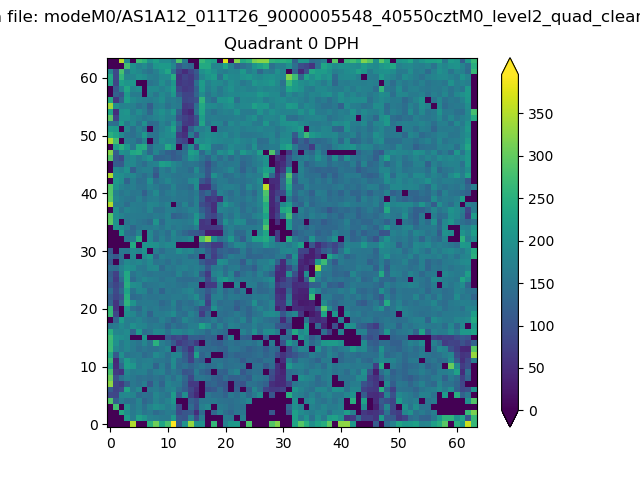 |
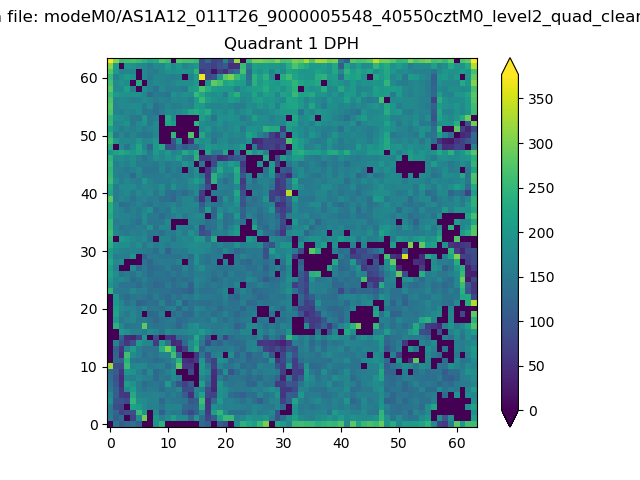 |
Quadrant B |
|---|---|---|---|
| Quadrant D | 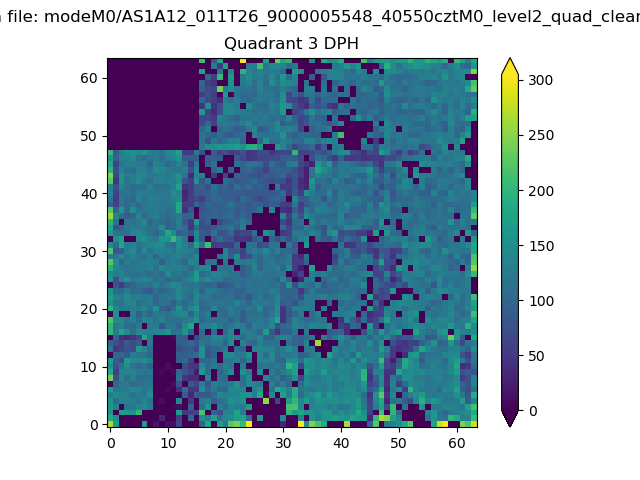 |
 |
Quadrant C |
| Plot type | Count rate plots | Images |
|---|---|---|
| Comparison with Poisson distribution Blue bars denote a histogram of data divided into 1 sec bins. Red curve is a Poisson curve with rate = median count rate of data. |
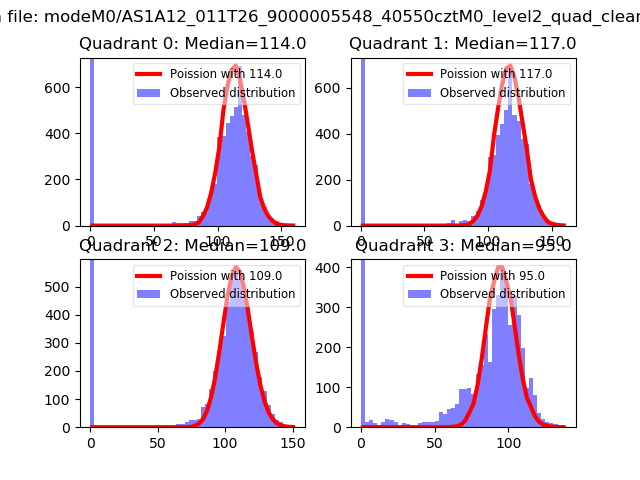 |
 |
| Quadrant-wise count rates Data is divided into 100 sec bins |
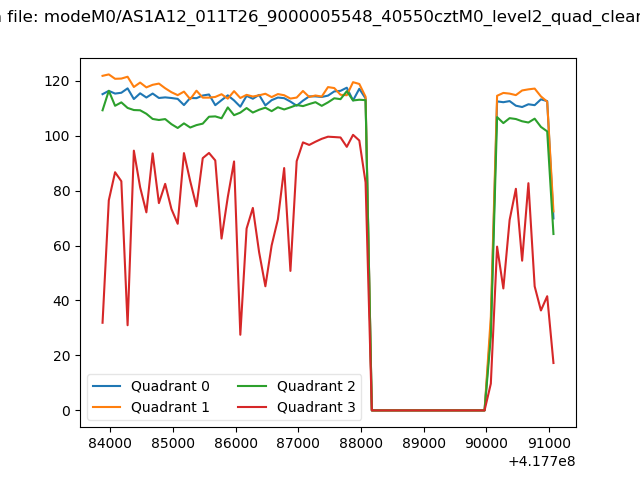 |
|
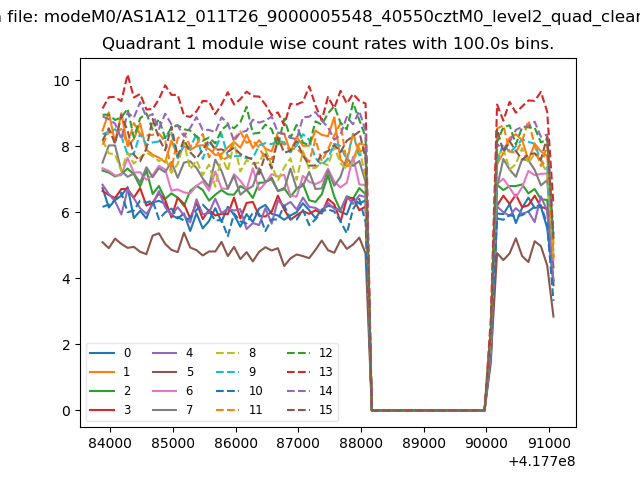
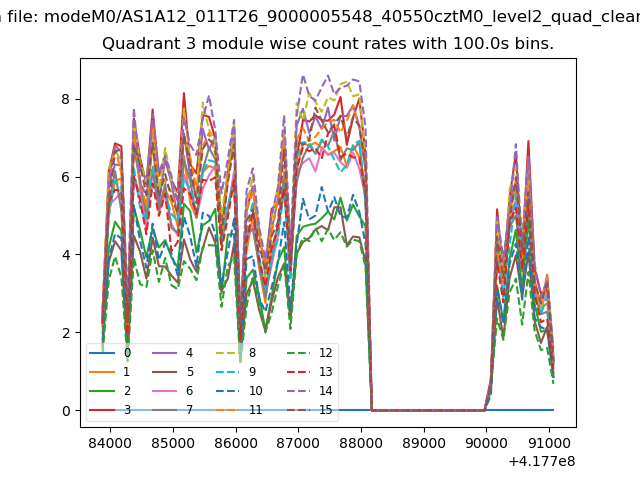
| Module-wise count rates for Quadrant A Data is divided into 100 sec bins |
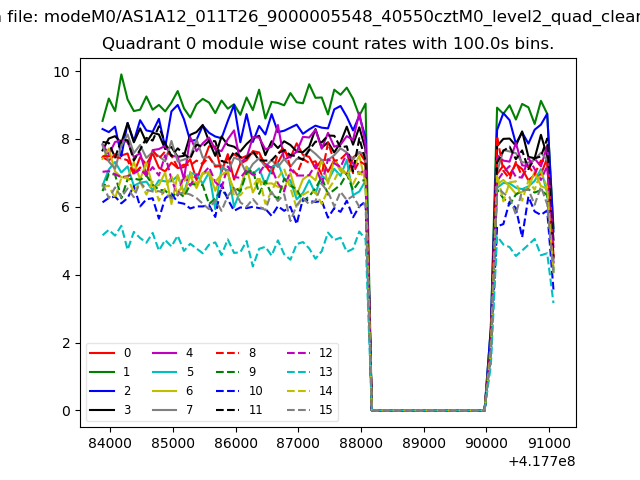 |
 |
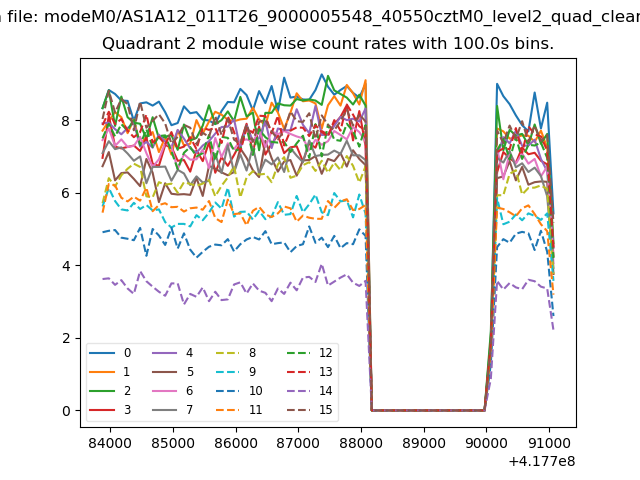
| Module-wise count rates for Quadrant B Data is divided into 100 sec bins |
 |
 |
| Module-wise count rates for Quadrant C Data is divided into 100 sec bins |
 |
 |
| Module-wise count rates for Quadrant D Data is divided into 100 sec bins |
 |
 |
| Parameter | Plot |
|---|---|
| CZT HV Monitor | 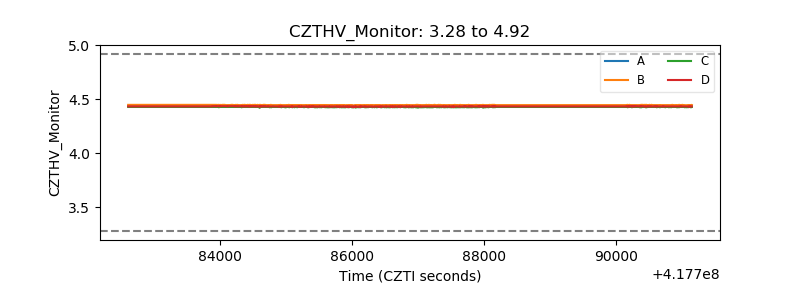 |
| D_VDD | 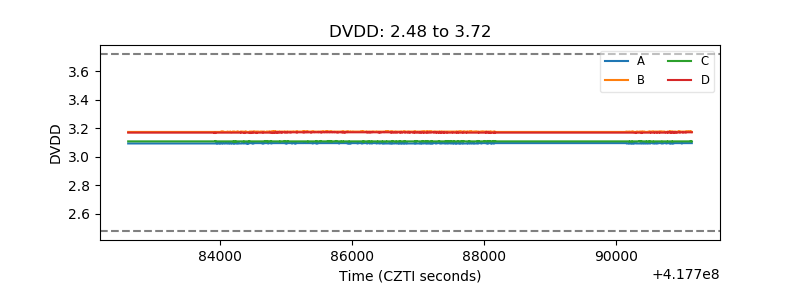 |
| Temperature 1 | 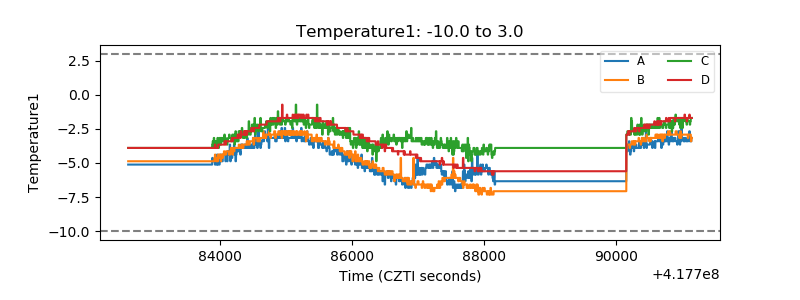 |
| Veto HV Monitor | 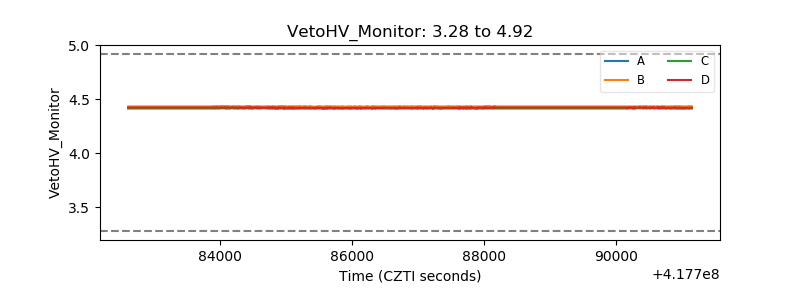 |
| Veto LLD | 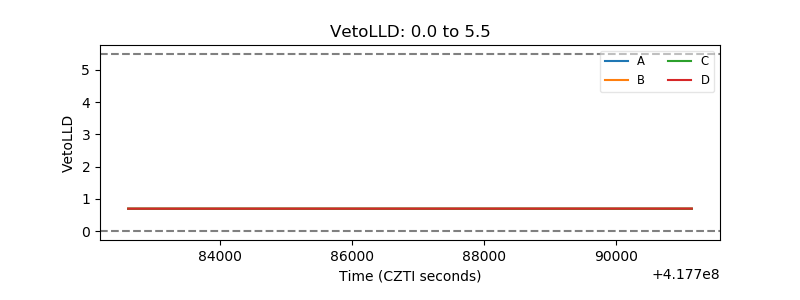 |
| Alpha Counter | 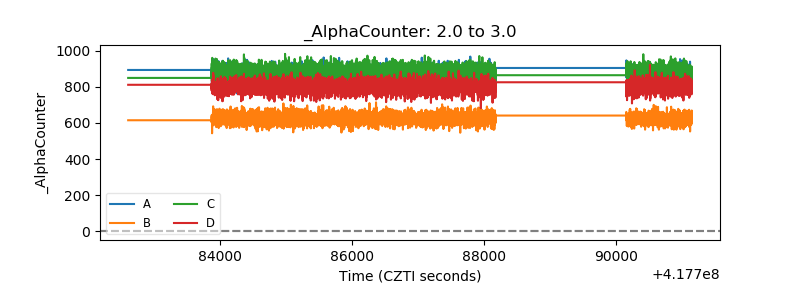 |
| _CPM_Rate | 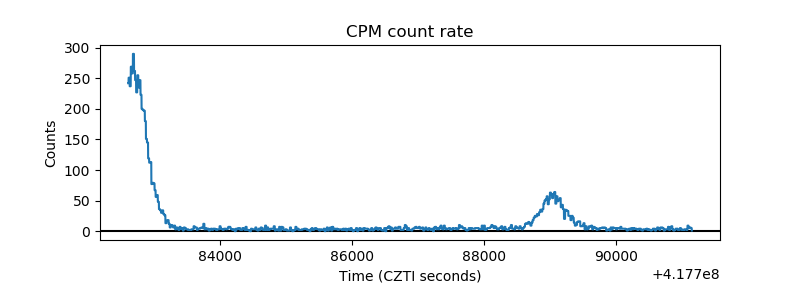 |
| CZT Counter | 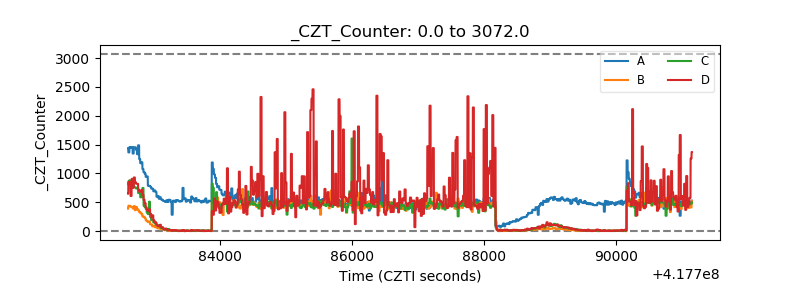 |
| +2.5 Volts monitor |  |
| +5 Volts monitor | 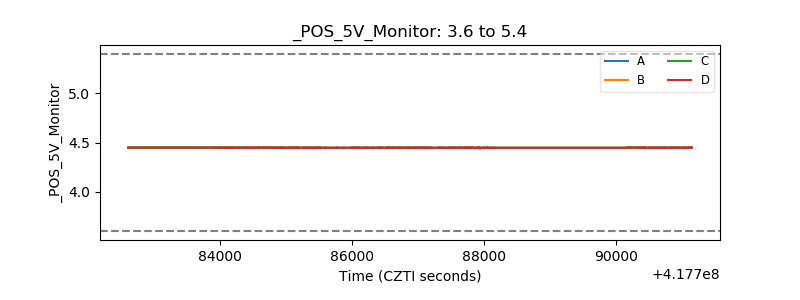 |
| _ROLL_ROT | 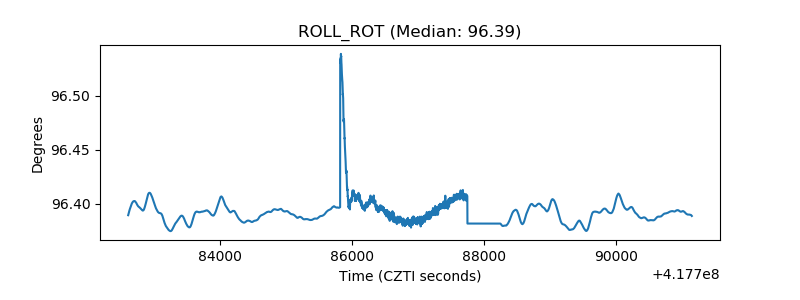 |
| _Roll_DEC | 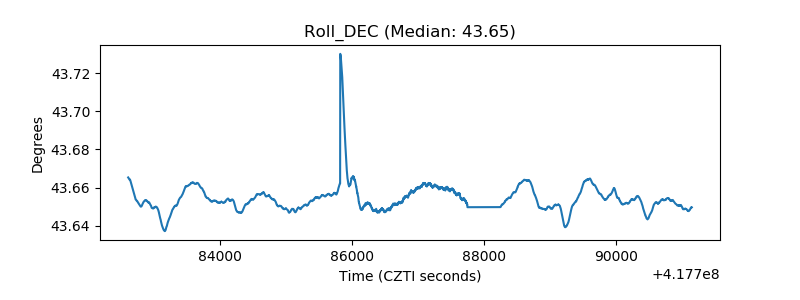 |
| _Roll_RA | 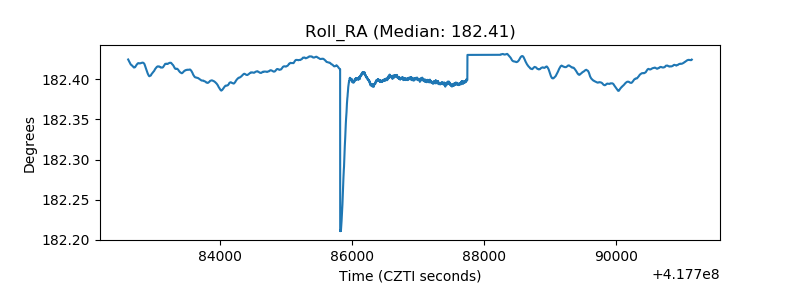 |
| Veto Counter | 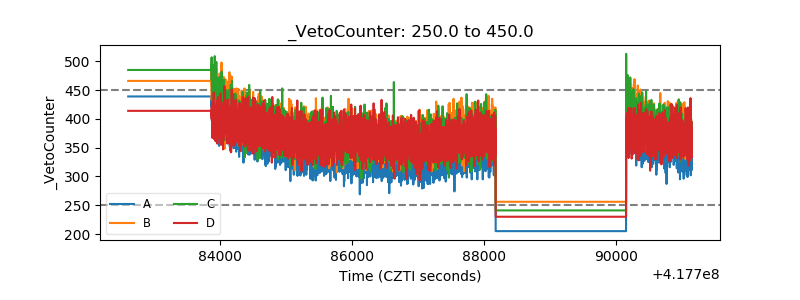 |