| Param | Original file | Final file |
|---|---|---|
| Filename | modeM0/AS1A12_011T26_9000005548_40551cztM0_level2.fits | modeM0/AS1A12_011T26_9000005548_40551cztM0_level2_quad_clean.evt |
| Size (bytes) | 113,549,760 | 28,920,960 |
| Size | 108.3 MB | 27.6 MB |
| Events in quadrant A | 1,011,747 | 209,078 |
| Events in quadrant B | 881,617 | 213,649 |
| Events in quadrant C | 919,731 | 195,441 |
| Events in quadrant D | 1,240,010 | 120,324 |
| Mode M0 | |||
|---|---|---|---|
| Quadrant | BADHDUFLAG | Total packets | Discarded packets |
| A | 0 | 4174 | 1 |
| B | 0 | 3825 | 1 |
| C | 0 | 3879 | 1 |
| D | 0 | 5002 | 1 |
| Mode SS | |||
|---|---|---|---|
| Quadrant | BADHDUFLAG | Total packets | Discarded packets |
| A | 0 | 38 | 0 |
| B | 0 | 38 | 0 |
| C | 0 | 38 | 0 |
| D | 0 | 38 | 0 |
| Mode M9 | |||
|---|---|---|---|
| Quadrant | BADHDUFLAG | Total packets | Discarded packets |
| A | 0 | 18 | 0 |
| B | 0 | 18 | 0 |
| C | 0 | 18 | 0 |
| D | 0 | 19 | 0 |
| Quadrant | Total seconds | Saturated seconds | Saturation percentage |
|---|---|---|---|
| A | 1882 | 3 | 0.159405% |
| B | 1882 | 3 | 0.159405% |
| C | 1882 | 5 | 0.265675% |
| D | 1882 | 750 | 39.851222% |
Noise dominated data is calculated using 1-second bins in cleaned event files. If a bin has >2000 counts, and if more than 50% of those come from <1% of pixels, then it is considered to be noise-dominated and hence unusable.
| Quadrant | # 1 sec bins | Bins with >0 counts | Bins with >2000 counts | High rate bins dominated by noise | Noise dominated (total time) | Noise dominated (detector-on time) | Marked lightcurve |
|---|---|---|---|---|---|---|---|
| A | 1882 | 1882 | 1 | 1 | 0.05% | 0.05% | 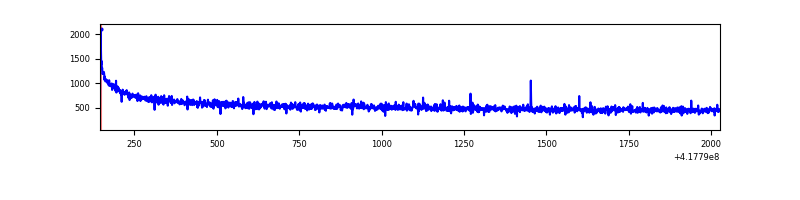 |
| B | 1882 | 1882 | 0 | 0 | 0.00% | 0.00% | 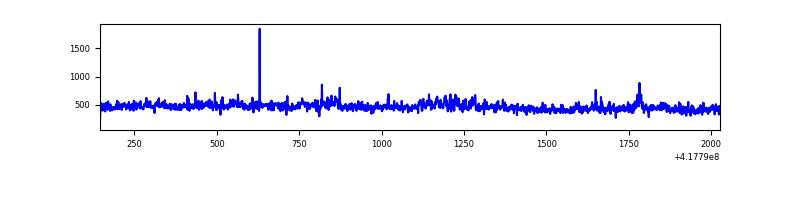 |
| C | 1882 | 1882 | 2 | 2 | 0.11% | 0.11% | 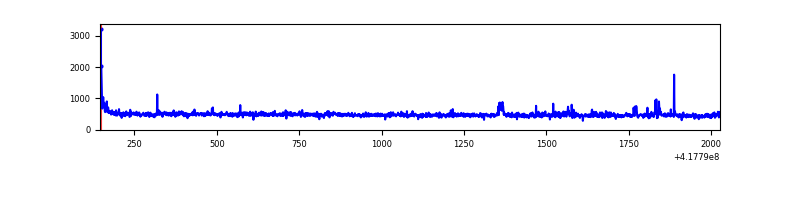 |
| D | 1882 | 1882 | 22 | 22 | 1.17% | 1.17% | 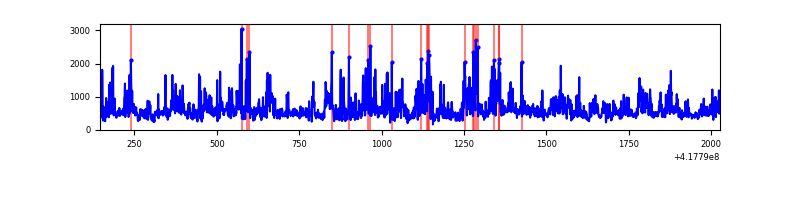 |
Top three noisy pixels from each quadrant. If the there are fewer than three noisy pixels in the level2.evt file, extra rows are filled as -1
| Pixel properties | Quadrant properties | ||||||
|---|---|---|---|---|---|---|---|
| Quadrant | DetID | PixID | Counts | Sigma | Mean | Median | Sigma |
| A | 10 | 83 | 198695 | 4442.44 | 208 | 204 | 44.7 |
| A | 12 | 189 | 4849 | 103.96 | 208 | 204 | 44.7 |
| A | 13 | 254 | 2331 | 47.6 | 208 | 204 | 44.7 |
| B | 3 | 112 | 58482 | 1393.95 | 205 | 199 | 41.8 |
| B | 0 | 230 | 7107 | 165.22 | 205 | 199 | 41.8 |
| B | 12 | 111 | 4967 | 114.04 | 205 | 199 | 41.8 |
| C | 15 | 214 | 84126 | 1718.59 | 201 | 201 | 48.8 |
| C | 9 | 187 | 20734 | 420.47 | 201 | 201 | 48.8 |
| C | 14 | 254 | 17639 | 357.09 | 201 | 201 | 48.8 |
| D | 12 | 227 | 339686 | 7932.34 | 165 | 160 | 42.8 |
| D | 12 | 191 | 124027 | 2893.9 | 165 | 160 | 42.8 |
| D | 2 | 250 | 47516 | 1106.38 | 165 | 160 | 42.8 |
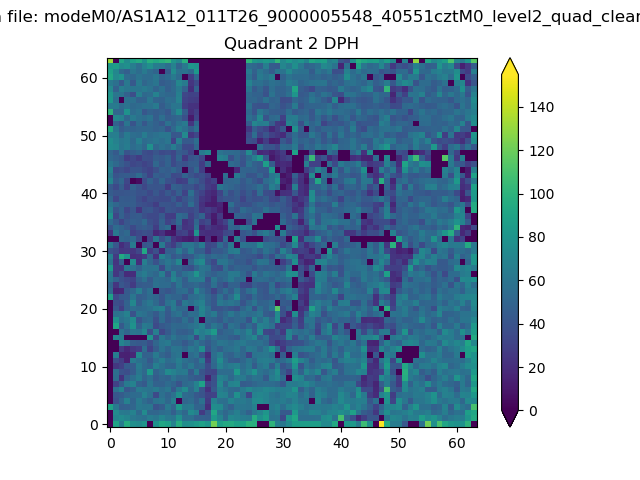
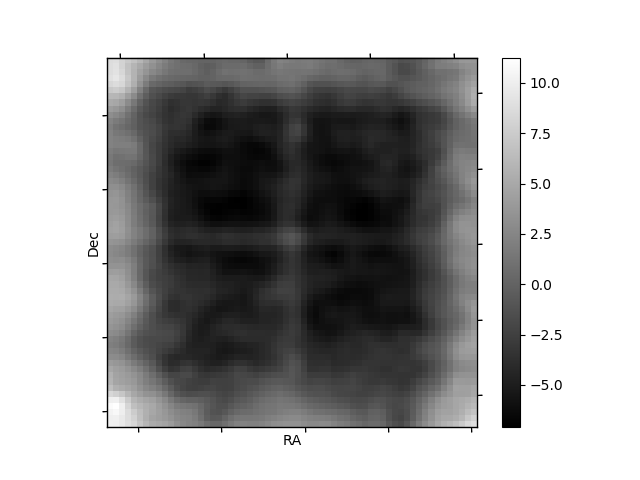
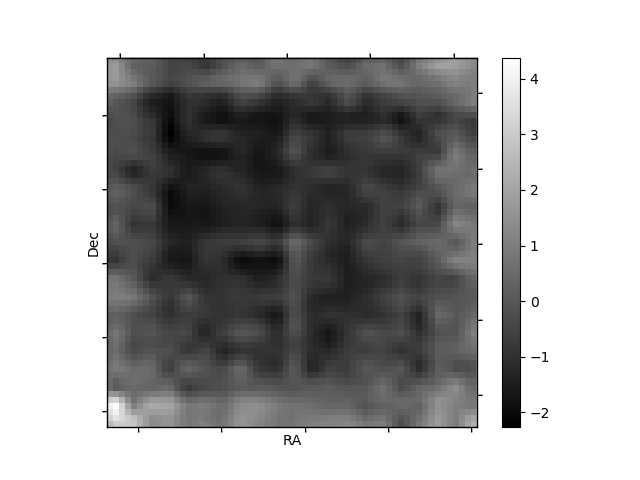
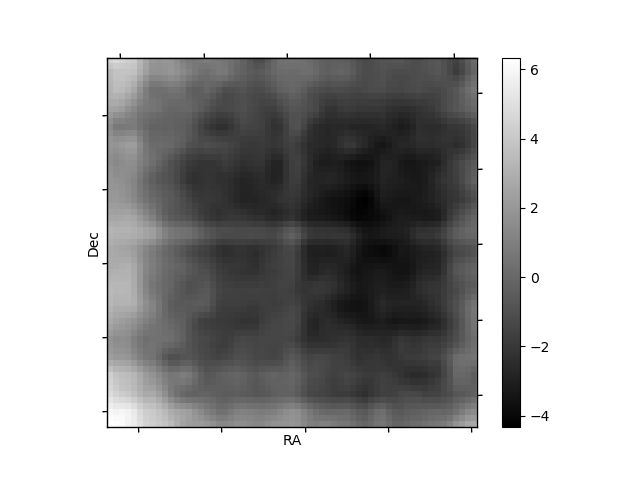
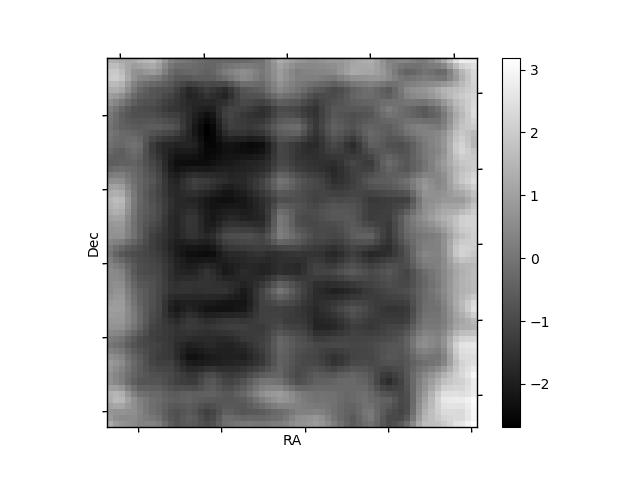
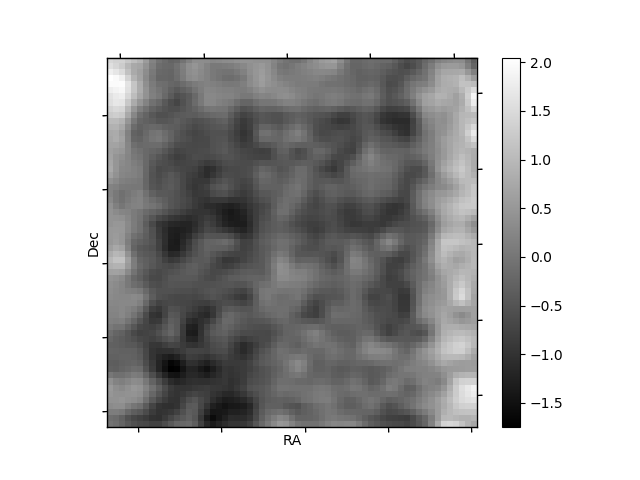
Histogram calculated using DETX and DETY for each event in the final _common_clean file
| Quadrant A | 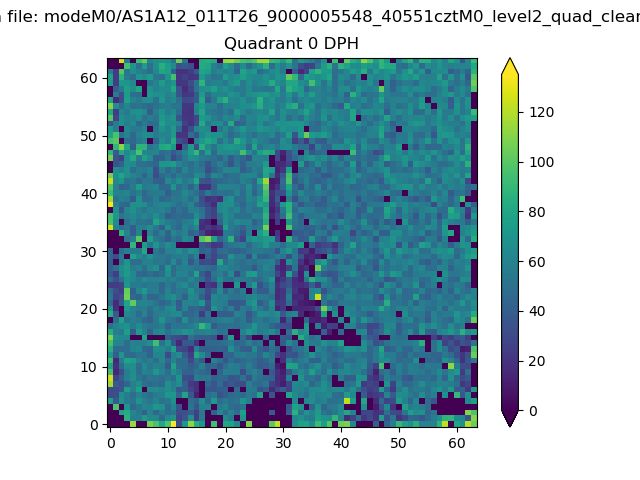 |
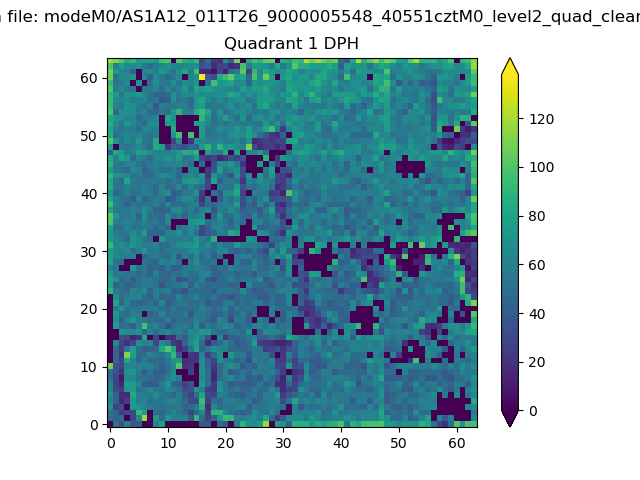 |
Quadrant B |
|---|---|---|---|
| Quadrant D | 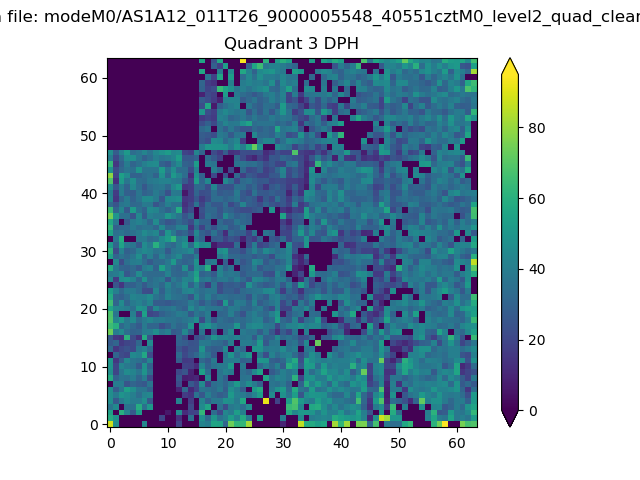 |
 |
Quadrant C |
| Plot type | Count rate plots | Images |
|---|---|---|
| Comparison with Poisson distribution Blue bars denote a histogram of data divided into 1 sec bins. Red curve is a Poisson curve with rate = median count rate of data. |
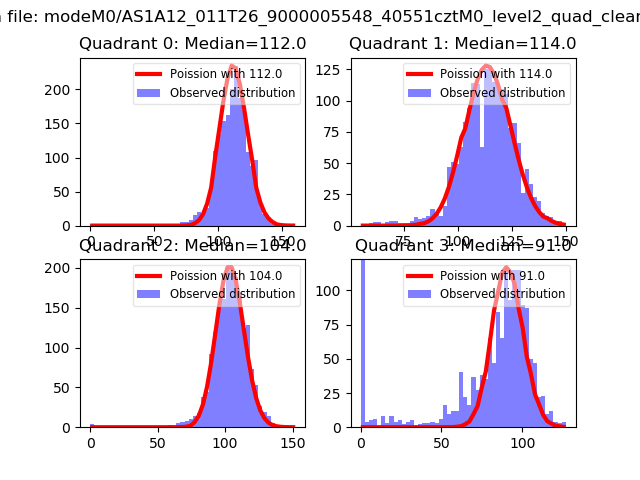 |
 |
| Quadrant-wise count rates Data is divided into 100 sec bins |
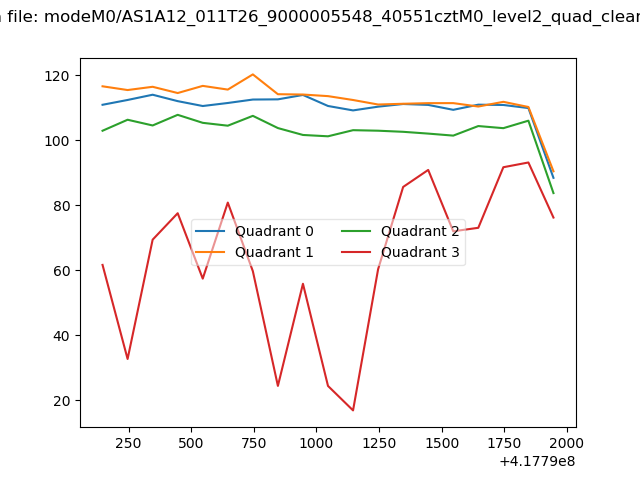 |
|
| Module-wise count rates for Quadrant A Data is divided into 100 sec bins |
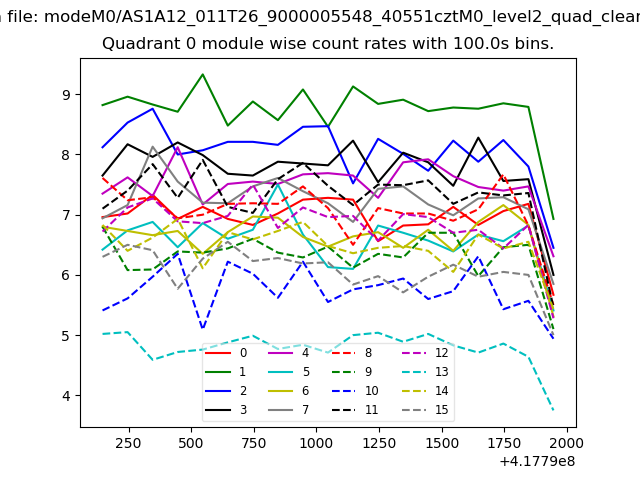 |
 |
| Module-wise count rates for Quadrant B Data is divided into 100 sec bins |
 |
 |
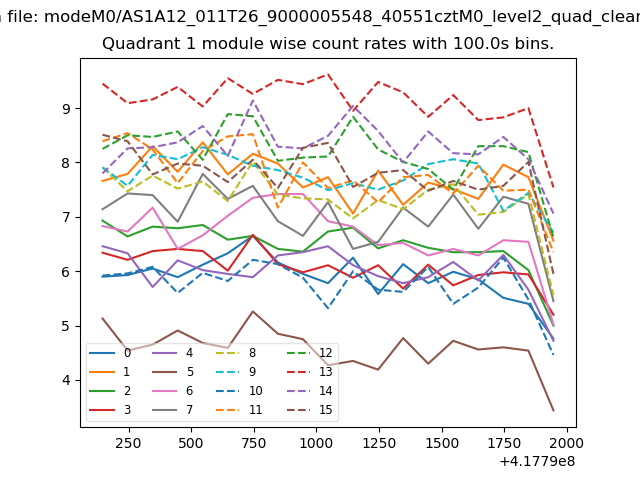
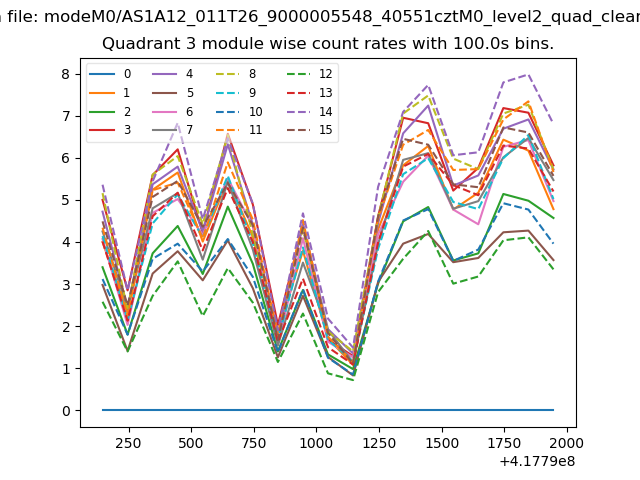
| Module-wise count rates for Quadrant C Data is divided into 100 sec bins |
 |
 |
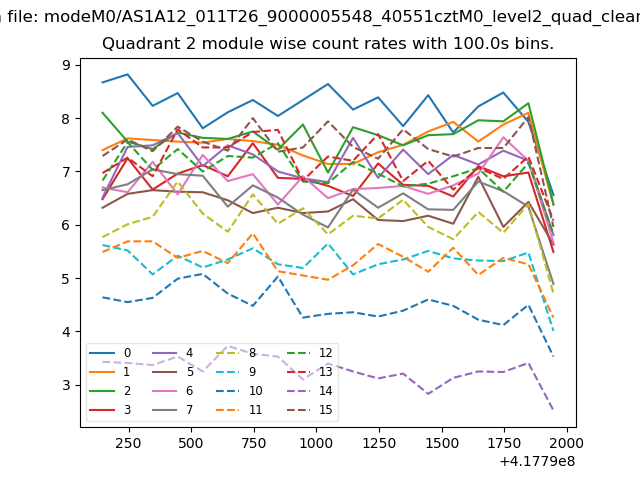
| Module-wise count rates for Quadrant D Data is divided into 100 sec bins |
 |
 |
| Parameter | Plot |
|---|---|
| CZT HV Monitor | 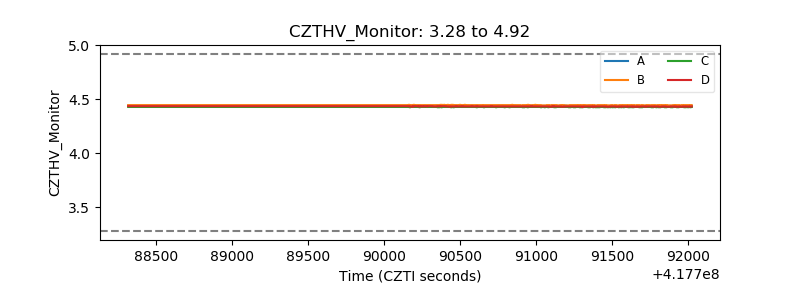 |
| D_VDD | 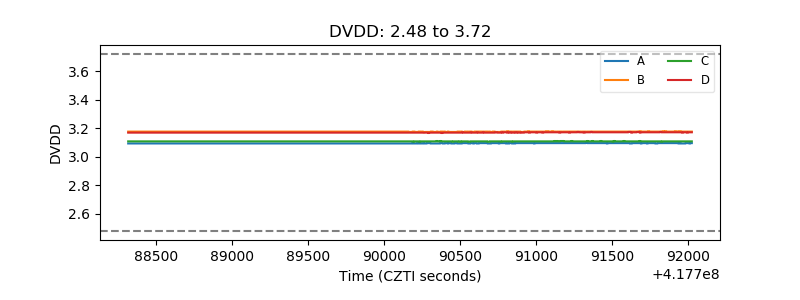 |
| Temperature 1 | 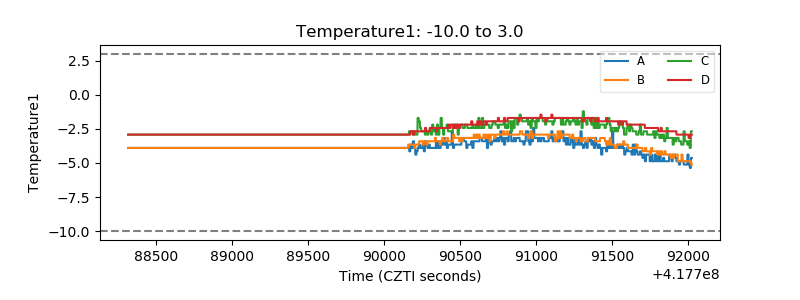 |
| Veto HV Monitor | 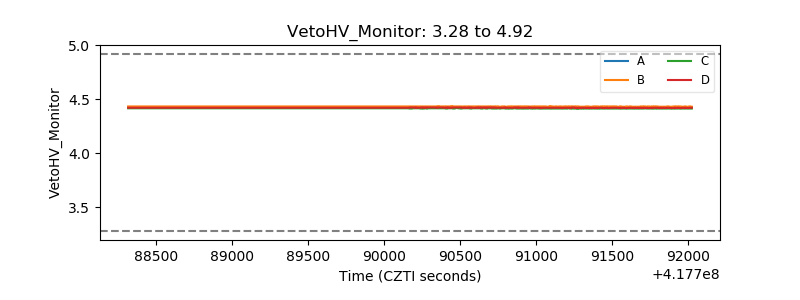 |
| Veto LLD | 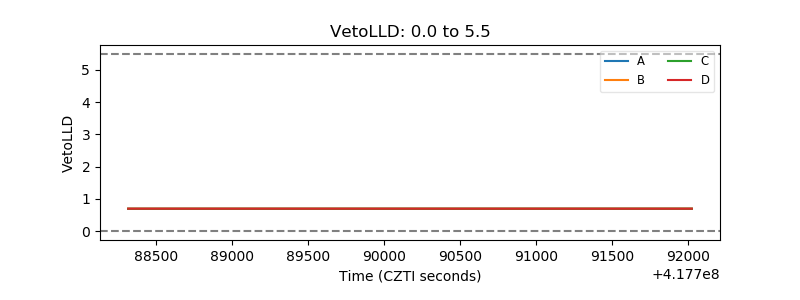 |
| Alpha Counter | 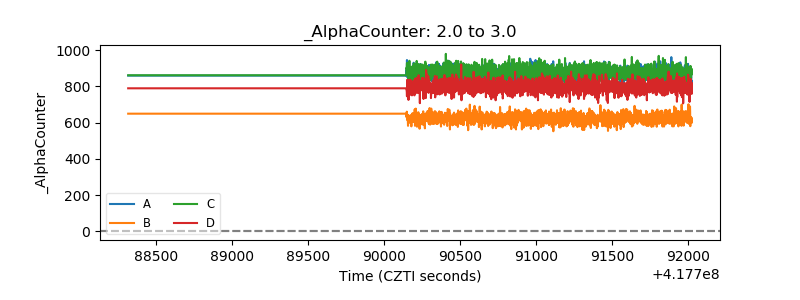 |
| _CPM_Rate | 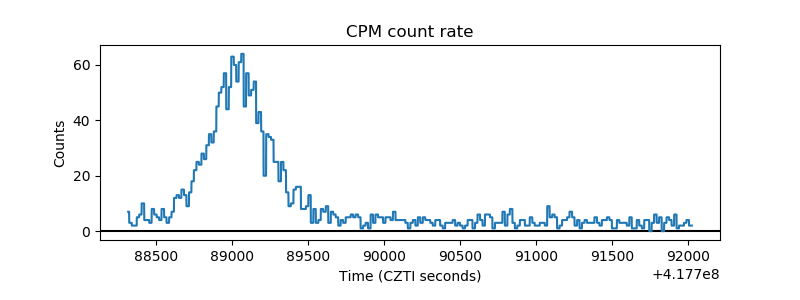 |
| CZT Counter | 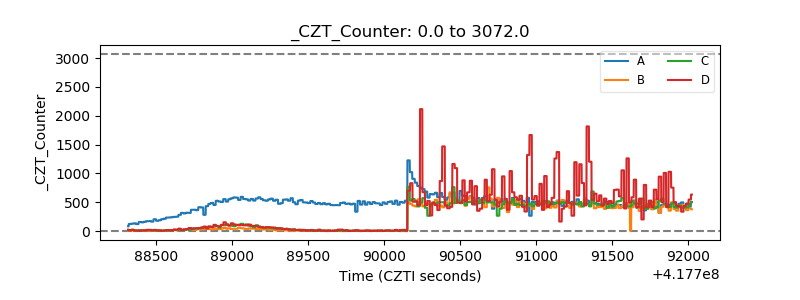 |
| +2.5 Volts monitor |  |
| +5 Volts monitor | 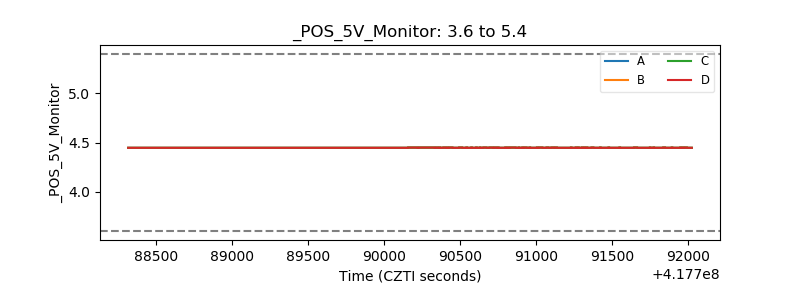 |
| _ROLL_ROT | 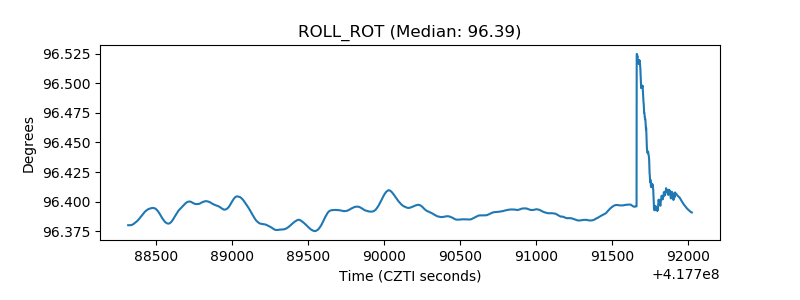 |
| _Roll_DEC | 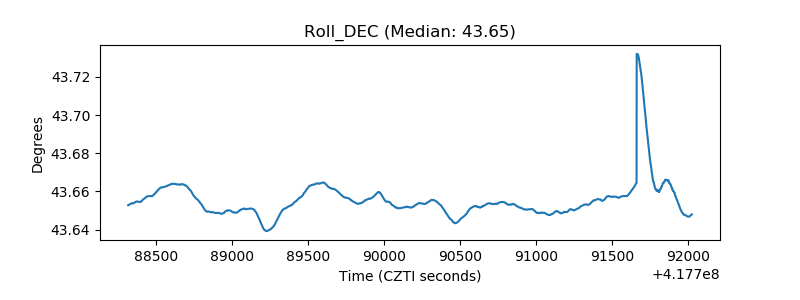 |
| _Roll_RA | 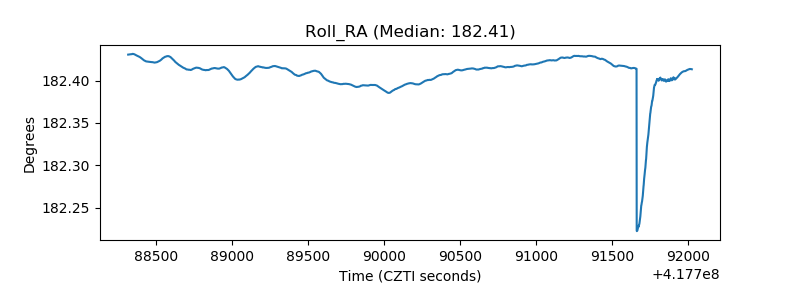 |
| Veto Counter | 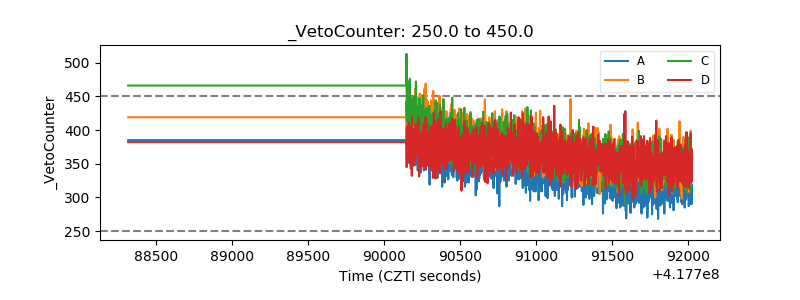 |