| Param | Original file | Final file |
|---|---|---|
| Filename | modeM0/AS1A12_054T02_9000005550_40551cztM0_level2.fits | modeM0/AS1A12_054T02_9000005550_40551cztM0_level2_quad_clean.evt |
| Size (bytes) | 217,008,000 | 50,339,520 |
| Size | 207.0 MB | 48.0 MB |
| Events in quadrant A | 1,628,959 | 353,142 |
| Events in quadrant B | 1,584,425 | 358,246 |
| Events in quadrant C | 1,762,121 | 334,480 |
| Events in quadrant D | 2,808,012 | 252,470 |
| Mode SS | |||
|---|---|---|---|
| Quadrant | BADHDUFLAG | Total packets | Discarded packets |
| A | 0 | 66 | 0 |
| B | 0 | 66 | 0 |
| C | 0 | 66 | 0 |
| D | 0 | 66 | 0 |
| Mode M0 | |||
|---|---|---|---|
| Quadrant | BADHDUFLAG | Total packets | Discarded packets |
| A | 0 | 6821 | 2 |
| B | 0 | 6753 | 1 |
| C | 0 | 7285 | 1 |
| D | 0 | 10594 | 1 |
| Mode M9 | |||
|---|---|---|---|
| Quadrant | BADHDUFLAG | Total packets | Discarded packets |
| A | 0 | 17 | 0 |
| B | 0 | 17 | 0 |
| C | 0 | 17 | 0 |
| D | 0 | 17 | 0 |
| Quadrant | Total seconds | Saturated seconds | Saturation percentage |
|---|---|---|---|
| A | 3178 | 7 | 0.220264% |
| B | 3178 | 1 | 0.031466% |
| C | 3178 | 90 | 2.831970% |
| D | 3178 | 781 | 24.575205% |
Noise dominated data is calculated using 1-second bins in cleaned event files. If a bin has >2000 counts, and if more than 50% of those come from <1% of pixels, then it is considered to be noise-dominated and hence unusable.
| Quadrant | # 1 sec bins | Bins with >0 counts | Bins with >2000 counts | High rate bins dominated by noise | Noise dominated (total time) | Noise dominated (detector-on time) | Marked lightcurve |
|---|---|---|---|---|---|---|---|
| A | 4820 | 3179 | 1 | 1 | 0.02% | 0.03% | 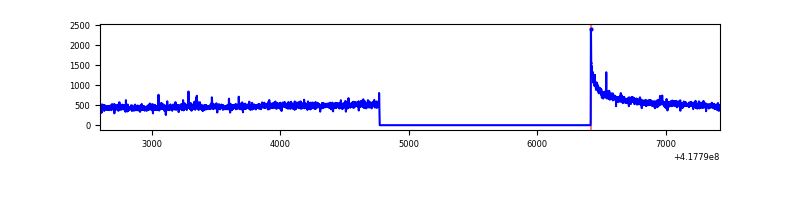 |
| B | 4820 | 3179 | 0 | 0 | 0.00% | 0.00% | 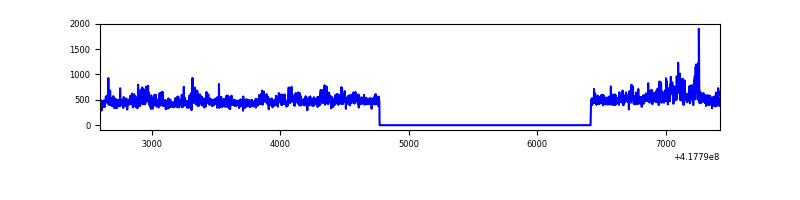 |
| C | 4820 | 3179 | 68 | 68 | 1.41% | 2.14% | 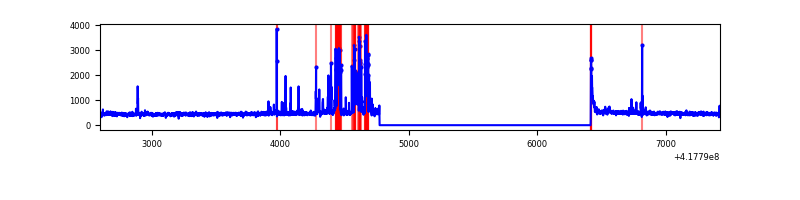 |
| D | 4820 | 3179 | 184 | 184 | 3.82% | 5.79% | 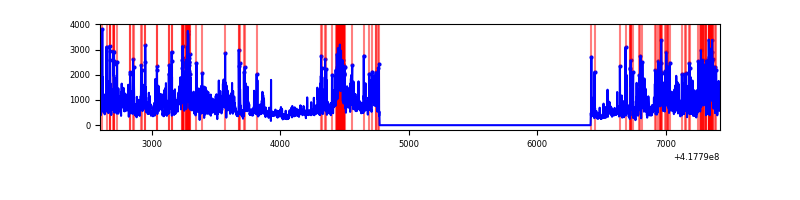 |
Top three noisy pixels from each quadrant. If the there are fewer than three noisy pixels in the level2.evt file, extra rows are filled as -1
| Pixel properties | Quadrant properties | ||||||
|---|---|---|---|---|---|---|---|
| Quadrant | DetID | PixID | Counts | Sigma | Mean | Median | Sigma |
| A | 10 | 83 | 271805 | 3802.48 | 343 | 335 | 71.4 |
| A | 3 | 1 | 14400 | 197.01 | 343 | 335 | 71.4 |
| A | 12 | 189 | 6601 | 87.77 | 343 | 335 | 71.4 |
| B | 3 | 112 | 199724 | 2954.15 | 343 | 332 | 67.5 |
| B | 0 | 230 | 23660 | 345.62 | 343 | 332 | 67.5 |
| B | 4 | 171 | 10683 | 153.36 | 343 | 332 | 67.5 |
| C | 10 | 20 | 187683 | 2381.46 | 333 | 334 | 78.7 |
| C | 15 | 214 | 135753 | 1721.36 | 333 | 334 | 78.7 |
| C | 14 | 254 | 92547 | 1172.15 | 333 | 334 | 78.7 |
| D | 12 | 227 | 750593 | 10007.18 | 295 | 286 | 75.0 |
| D | 2 | 250 | 371874 | 4956.04 | 295 | 286 | 75.0 |
| D | 13 | 171 | 241815 | 3221.38 | 295 | 286 | 75.0 |
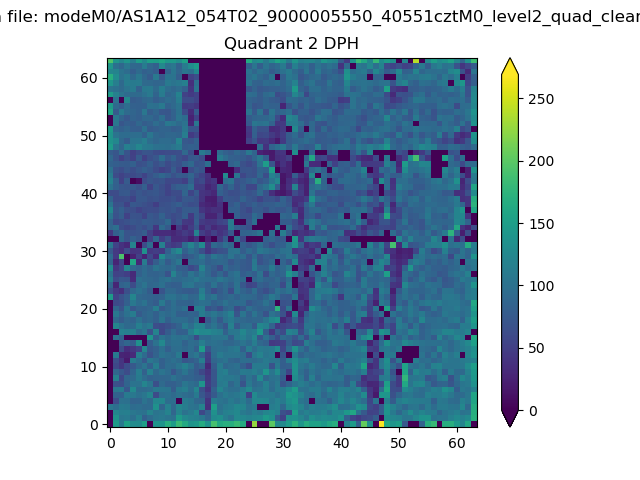
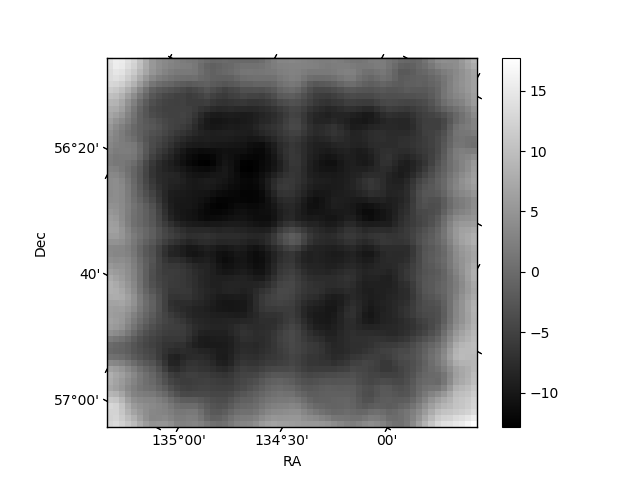
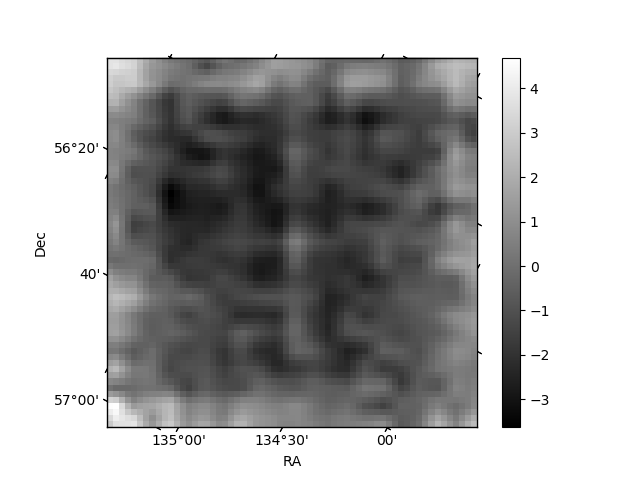
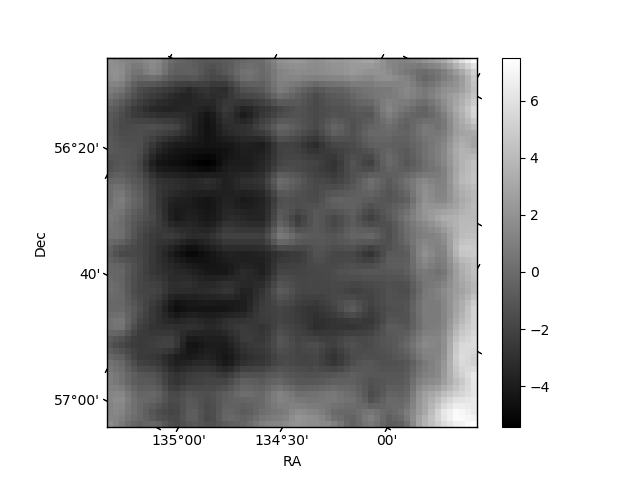
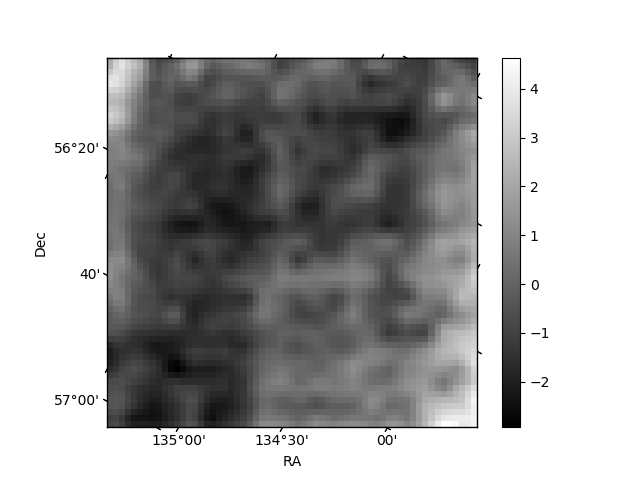
Histogram calculated using DETX and DETY for each event in the final _common_clean file
| Quadrant A | 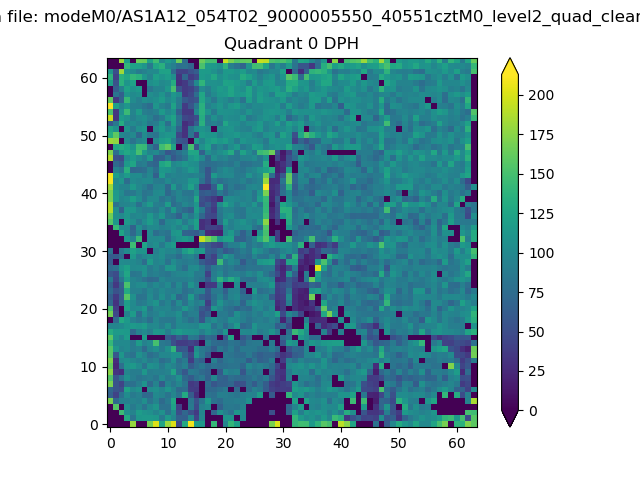 |
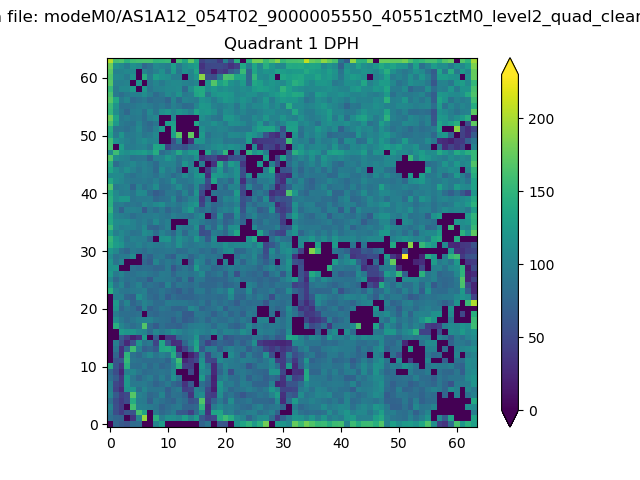 |
Quadrant B |
|---|---|---|---|
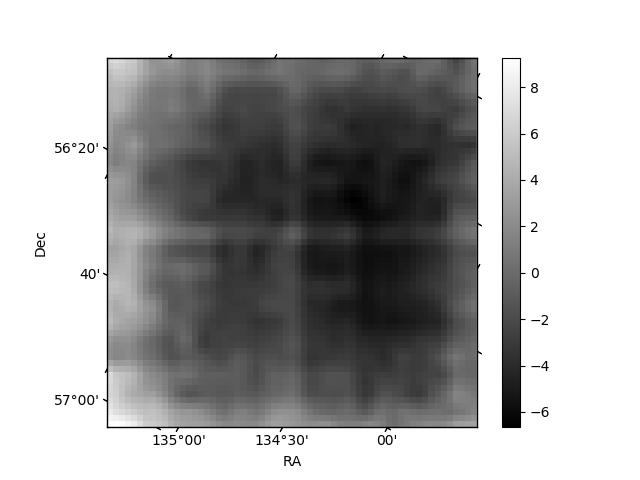
| Quadrant D | 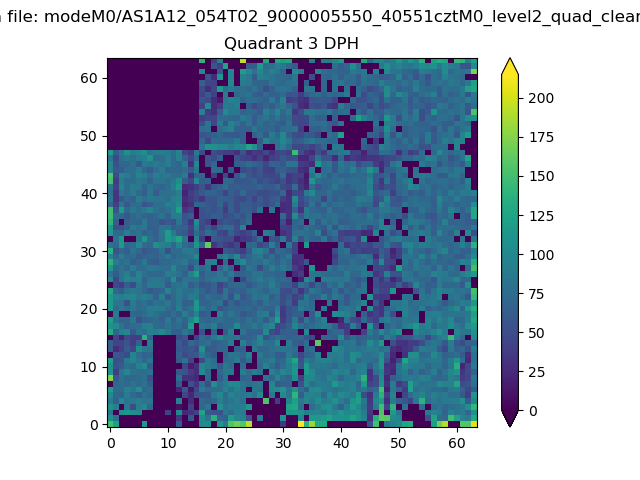 |
 |
Quadrant C |
| Plot type | Count rate plots | Images |
|---|---|---|
| Comparison with Poisson distribution Blue bars denote a histogram of data divided into 1 sec bins. Red curve is a Poisson curve with rate = median count rate of data. |
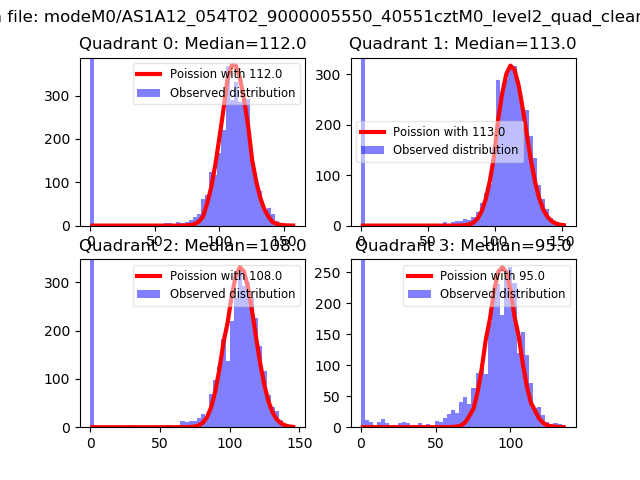 |
 |
| Quadrant-wise count rates Data is divided into 100 sec bins |
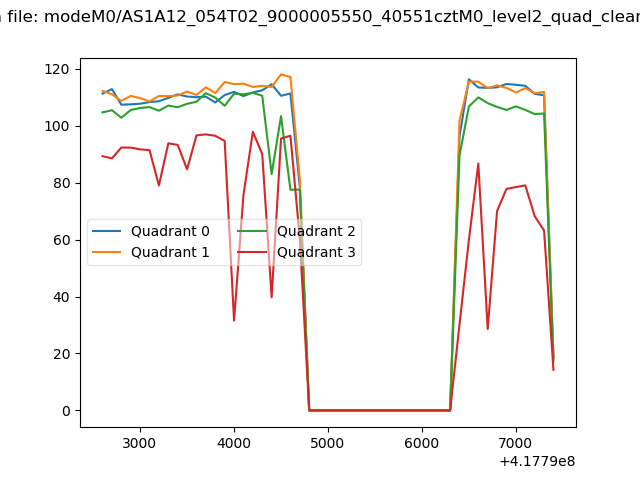 |
|
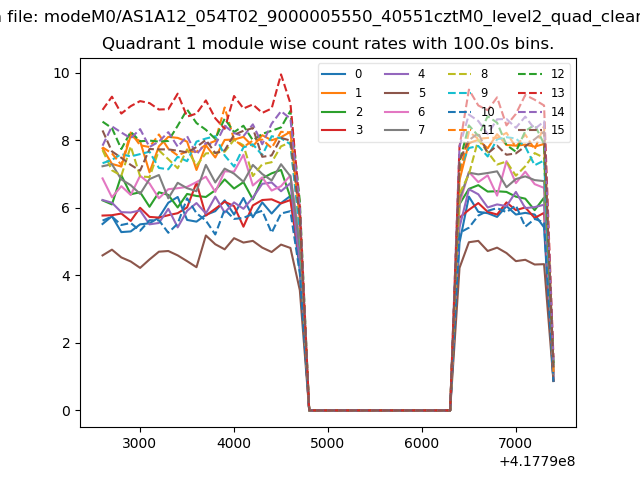
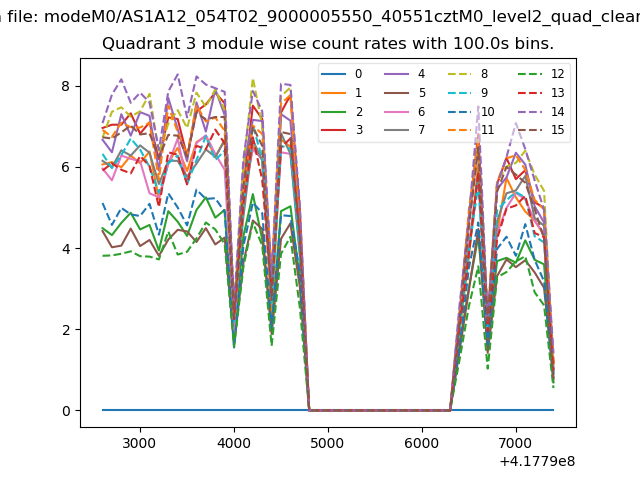
| Module-wise count rates for Quadrant A Data is divided into 100 sec bins |
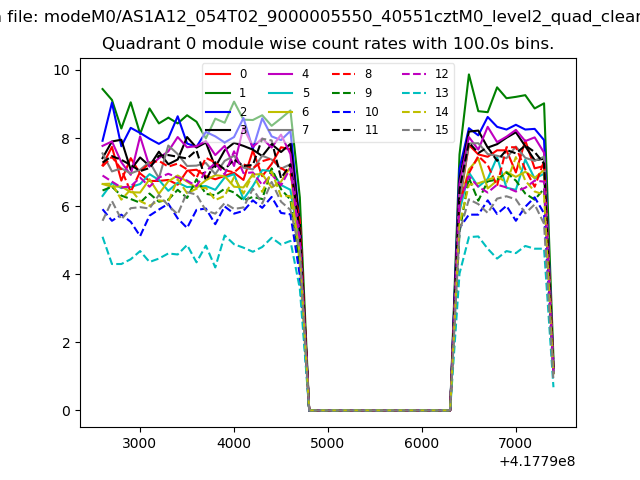 |
 |
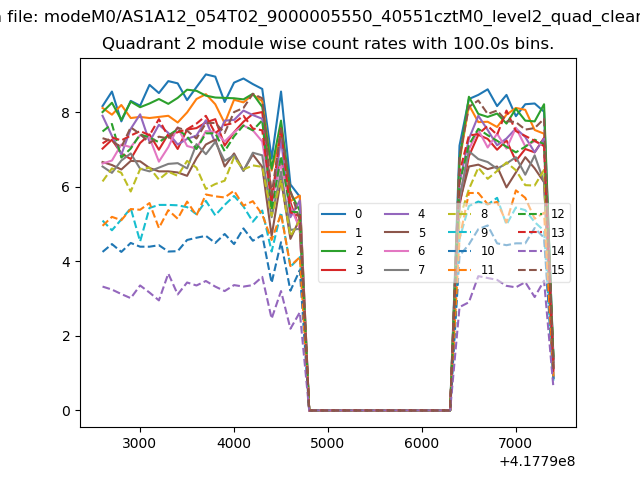
| Module-wise count rates for Quadrant B Data is divided into 100 sec bins |
 |
 |
| Module-wise count rates for Quadrant C Data is divided into 100 sec bins |
 |
 |
| Module-wise count rates for Quadrant D Data is divided into 100 sec bins |
 |
 |
| Parameter | Plot |
|---|---|
| CZT HV Monitor | 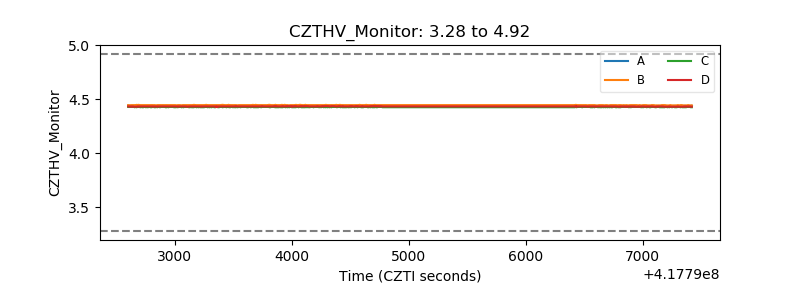 |
| D_VDD | 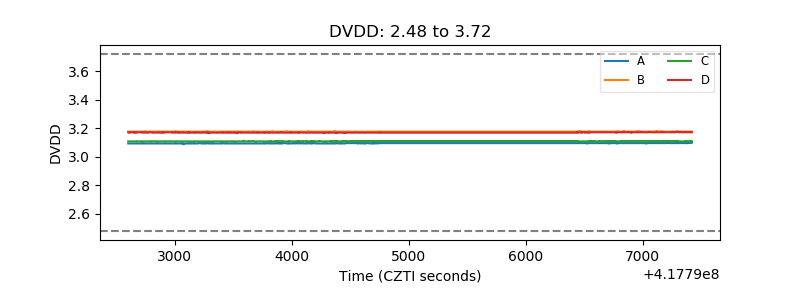 |
| Temperature 1 | 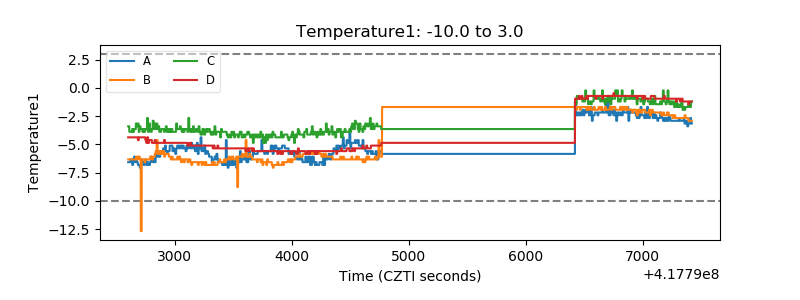 |
| Veto HV Monitor | 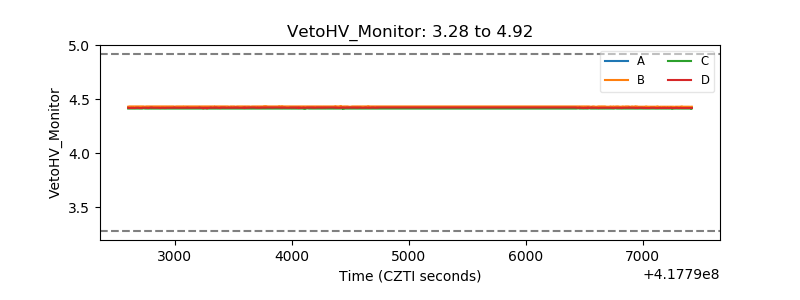 |
| Veto LLD | 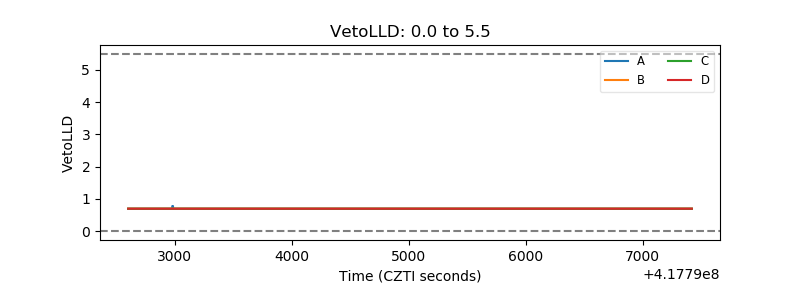 |
| Alpha Counter | 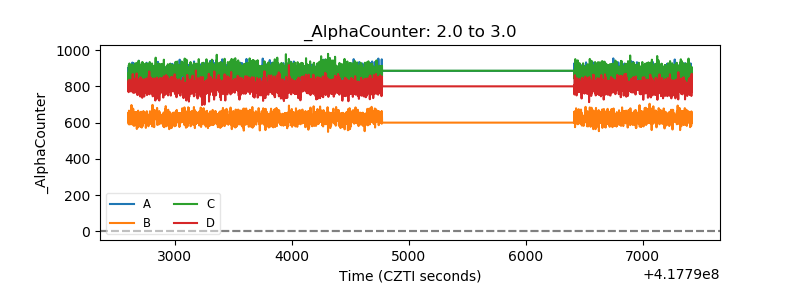 |
| _CPM_Rate | 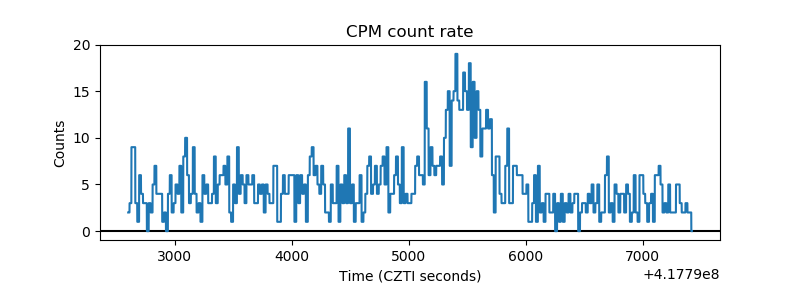 |
| CZT Counter | 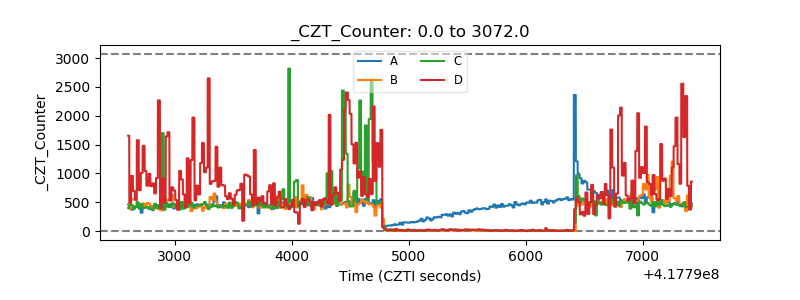 |
| +2.5 Volts monitor | 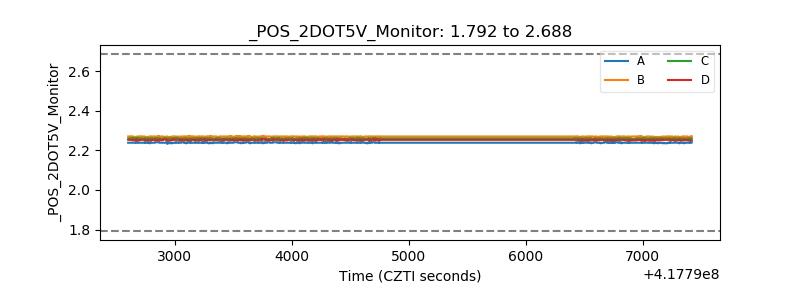 |
| +5 Volts monitor | 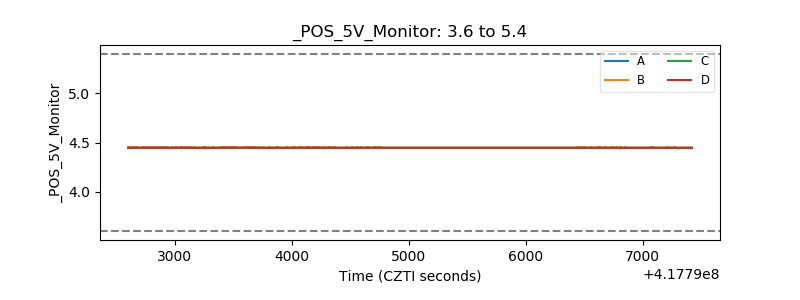 |
| _ROLL_ROT | 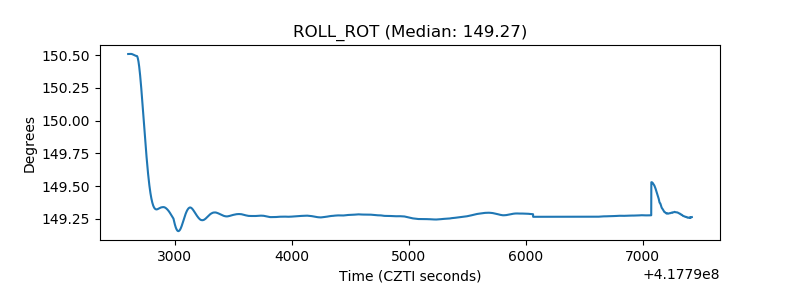 |
| _Roll_DEC | 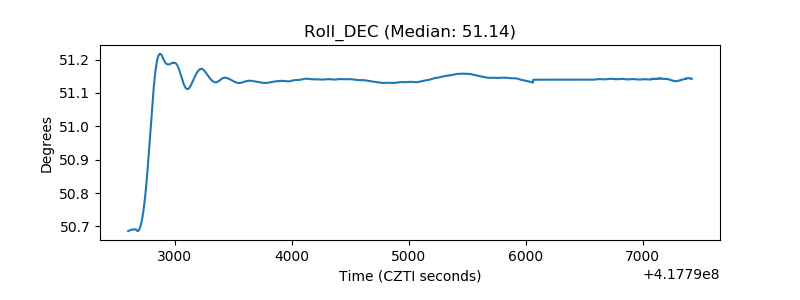 |
| _Roll_RA | 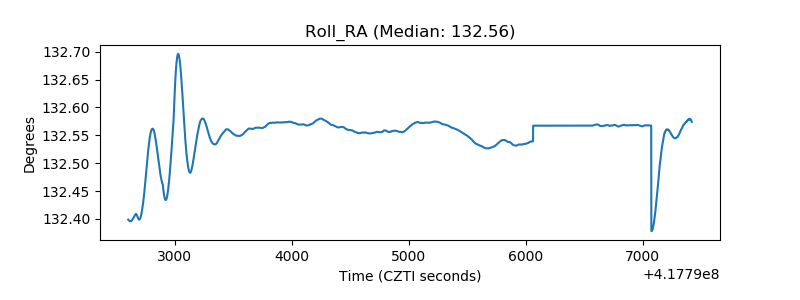 |
| Veto Counter | 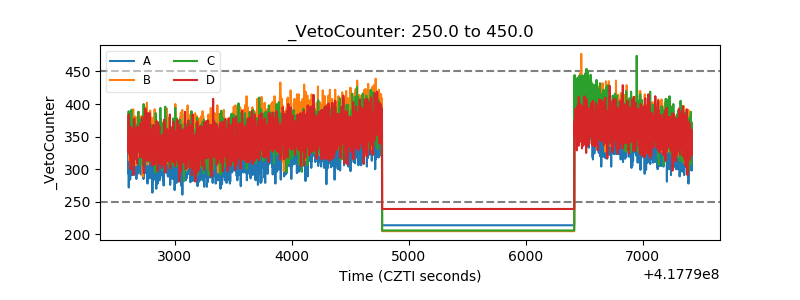 |