| Param | Original file | Final file |
|---|---|---|
| Filename | modeM0/AS1A12_054T02_9000005550_40552cztM0_level2.fits | modeM0/AS1A12_054T02_9000005550_40552cztM0_level2_quad_clean.evt |
| Size (bytes) | 364,366,080 | 89,712,000 |
| Size | 347.5 MB | 85.6 MB |
| Events in quadrant A | 2,929,259 | 622,771 |
| Events in quadrant B | 3,041,496 | 628,326 |
| Events in quadrant C | 2,798,139 | 599,131 |
| Events in quadrant D | 4,276,494 | 469,776 |
| Mode SS | |||
|---|---|---|---|
| Quadrant | BADHDUFLAG | Total packets | Discarded packets |
| A | 0 | 114 | 0 |
| B | 0 | 114 | 0 |
| C | 0 | 114 | 0 |
| D | 0 | 114 | 0 |
| Mode M0 | |||
|---|---|---|---|
| Quadrant | BADHDUFLAG | Total packets | Discarded packets |
| A | 0 | 12225 | 2 |
| B | 0 | 12689 | 1 |
| C | 0 | 12016 | 1 |
| D | 0 | 16637 | 1 |
| Mode M9 | |||
|---|---|---|---|
| Quadrant | BADHDUFLAG | Total packets | Discarded packets |
| A | 0 | 14 | 0 |
| B | 0 | 14 | 0 |
| C | 0 | 14 | 0 |
| D | 0 | 14 | 0 |
| Quadrant | Total seconds | Saturated seconds | Saturation percentage |
|---|---|---|---|
| A | 5669 | 5 | 0.088199% |
| B | 5669 | 12 | 0.211678% |
| C | 5669 | 31 | 0.546834% |
| D | 5669 | 1100 | 19.403775% |
Noise dominated data is calculated using 1-second bins in cleaned event files. If a bin has >2000 counts, and if more than 50% of those come from <1% of pixels, then it is considered to be noise-dominated and hence unusable.
| Quadrant | # 1 sec bins | Bins with >0 counts | Bins with >2000 counts | High rate bins dominated by noise | Noise dominated (total time) | Noise dominated (detector-on time) | Marked lightcurve |
|---|---|---|---|---|---|---|---|
| A | 7042 | 5670 | 3 | 3 | 0.04% | 0.05% | 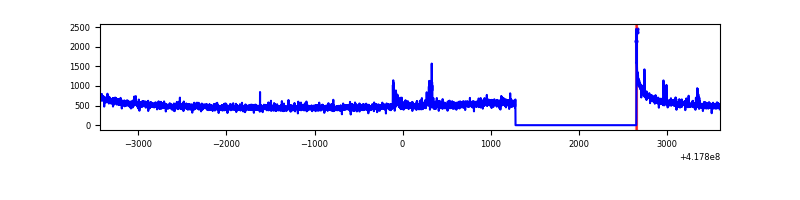 |
| B | 7042 | 5670 | 4 | 4 | 0.06% | 0.07% | 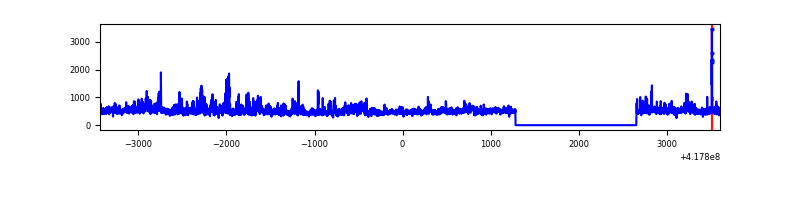 |
| C | 7042 | 5670 | 21 | 21 | 0.30% | 0.37% | 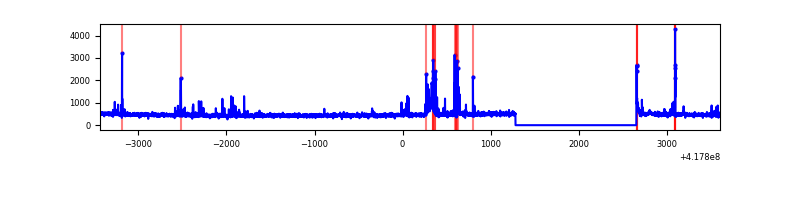 |
| D | 7041 | 5669 | 187 | 187 | 2.66% | 3.30% | 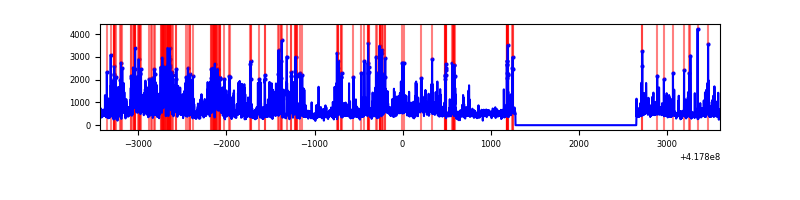 |
Top three noisy pixels from each quadrant. If the there are fewer than three noisy pixels in the level2.evt file, extra rows are filled as -1
| Pixel properties | Quadrant properties | ||||||
|---|---|---|---|---|---|---|---|
| Quadrant | DetID | PixID | Counts | Sigma | Mean | Median | Sigma |
| A | 10 | 83 | 477011 | 3818.37 | 607 | 595 | 124.8 |
| A | 12 | 189 | 37481 | 295.63 | 607 | 595 | 124.8 |
| A | 3 | 1 | 34469 | 271.49 | 607 | 595 | 124.8 |
| B | 3 | 112 | 584741 | 5031.72 | 602 | 584 | 116.1 |
| B | 0 | 230 | 53281 | 453.91 | 602 | 584 | 116.1 |
| B | 15 | 85 | 18884 | 157.63 | 602 | 584 | 116.1 |
| C | 15 | 214 | 243218 | 1757.77 | 592 | 596 | 138.0 |
| C | 14 | 254 | 114205 | 823.09 | 592 | 596 | 138.0 |
| C | 10 | 20 | 100278 | 722.19 | 592 | 596 | 138.0 |
| D | 12 | 227 | 1003125 | 7445.89 | 541 | 527 | 134.7 |
| D | 2 | 250 | 429303 | 3184.34 | 541 | 527 | 134.7 |
| D | 12 | 191 | 210621 | 1560.28 | 541 | 527 | 134.7 |
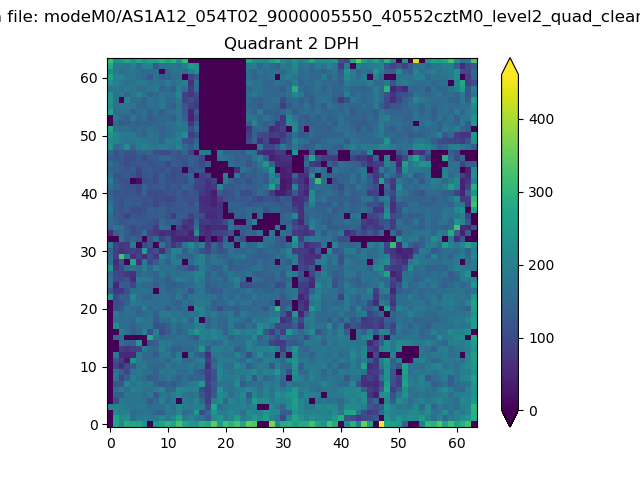
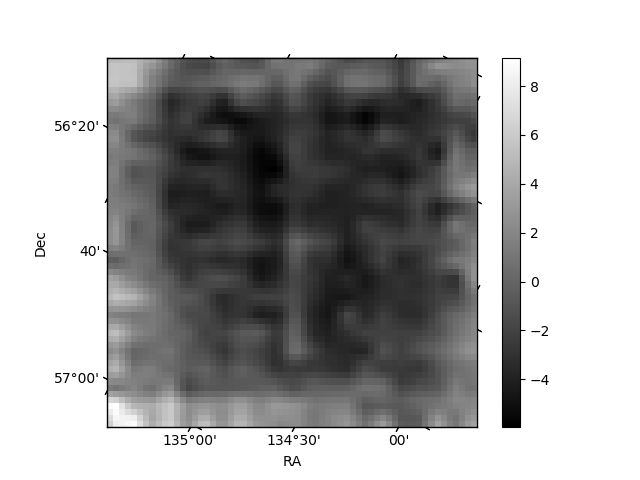
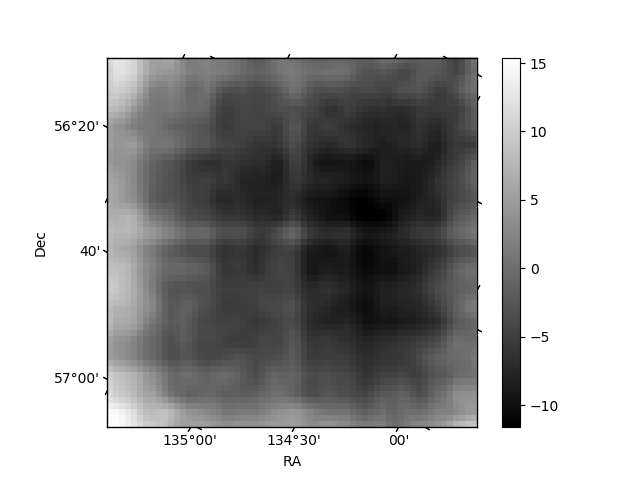
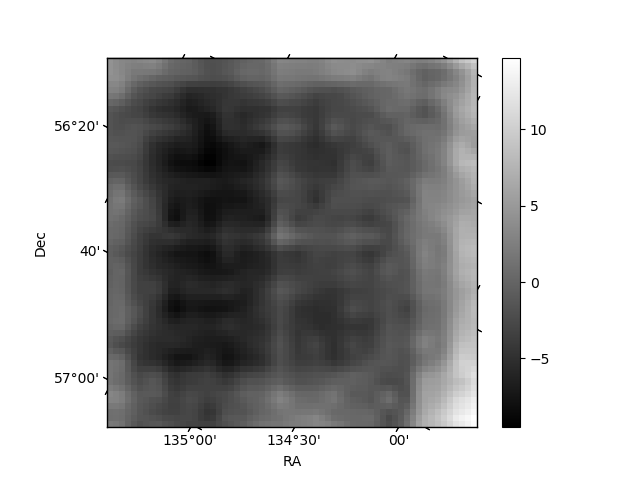
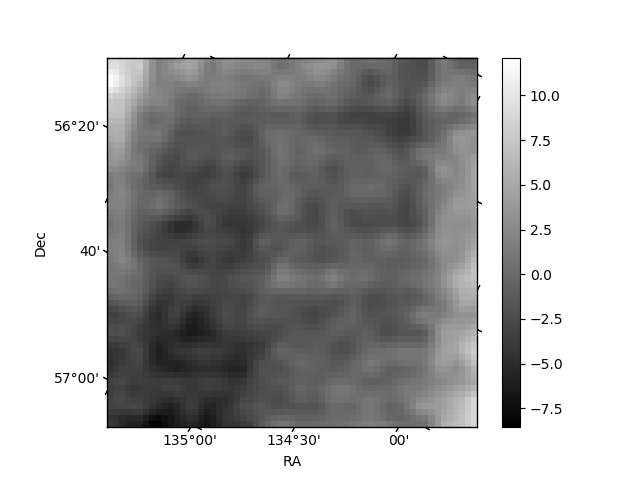
Histogram calculated using DETX and DETY for each event in the final _common_clean file
| Quadrant A | 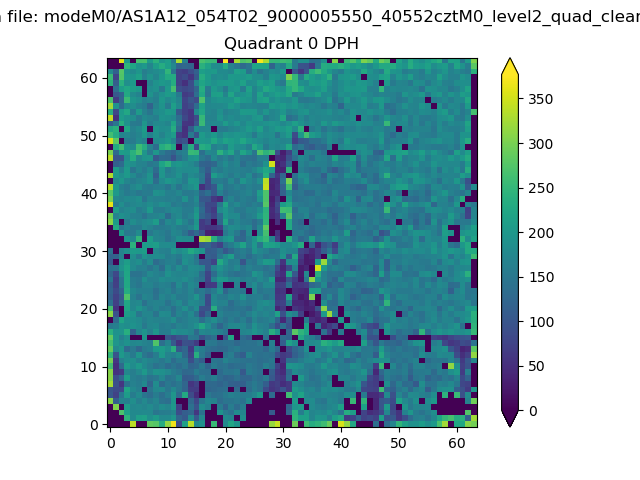 |
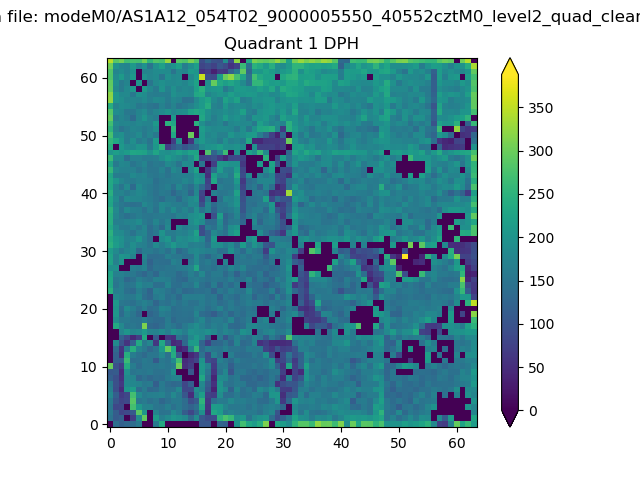 |
Quadrant B |
|---|---|---|---|
| Quadrant D | 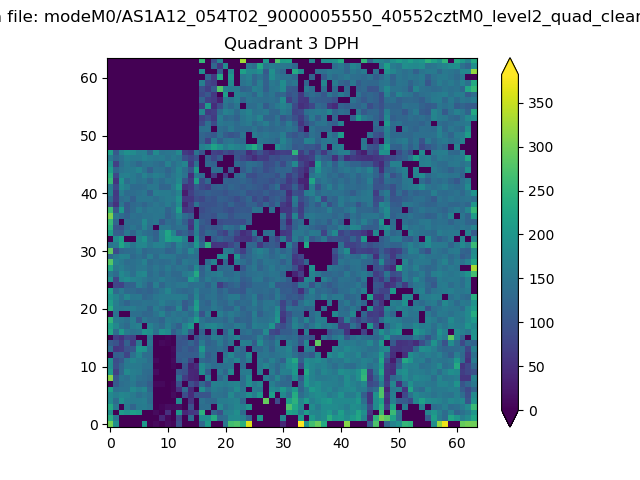 |
 |
Quadrant C |
| Plot type | Count rate plots | Images |
|---|---|---|
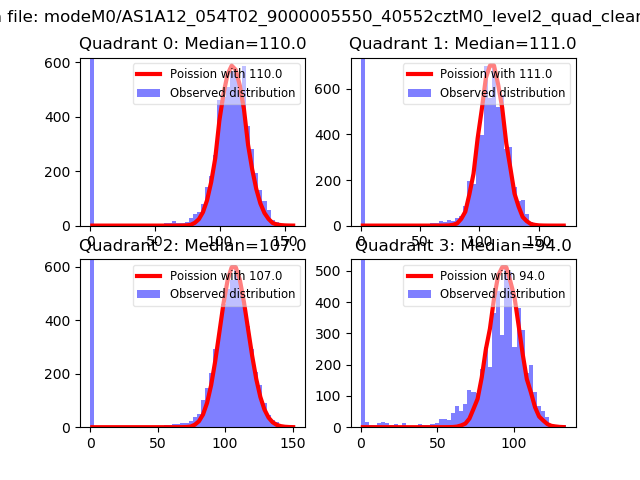
| Comparison with Poisson distribution Blue bars denote a histogram of data divided into 1 sec bins. Red curve is a Poisson curve with rate = median count rate of data. |
 |
 |
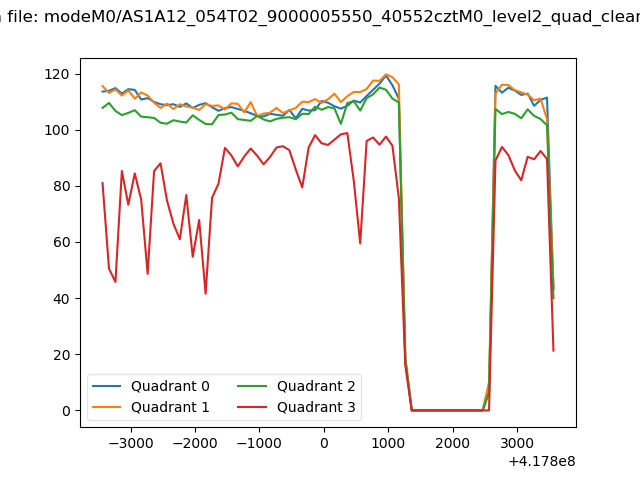
| Quadrant-wise count rates Data is divided into 100 sec bins |
 |
|
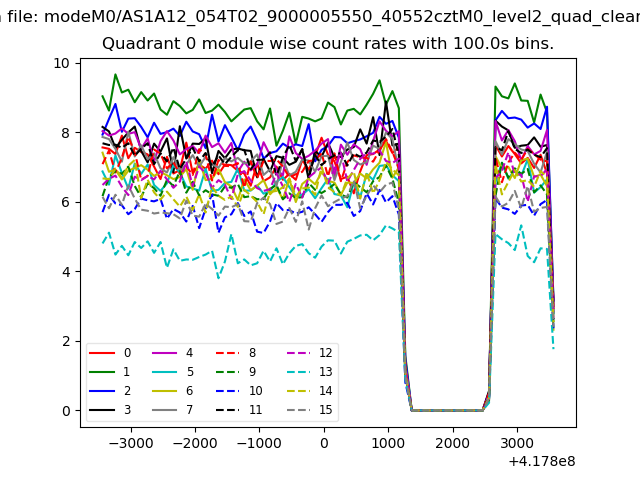
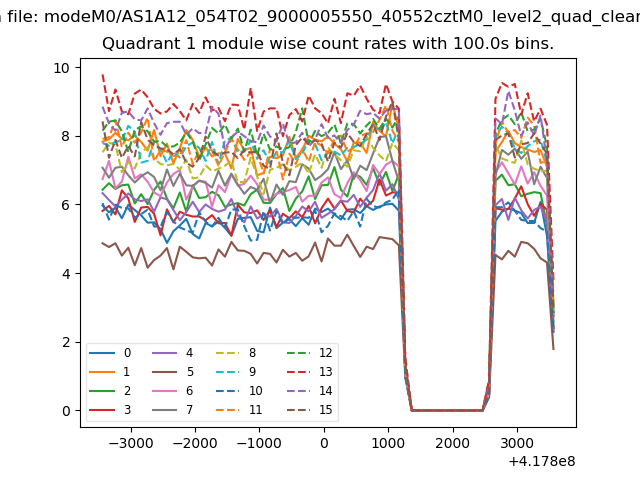
| Module-wise count rates for Quadrant A Data is divided into 100 sec bins |
 |
 |
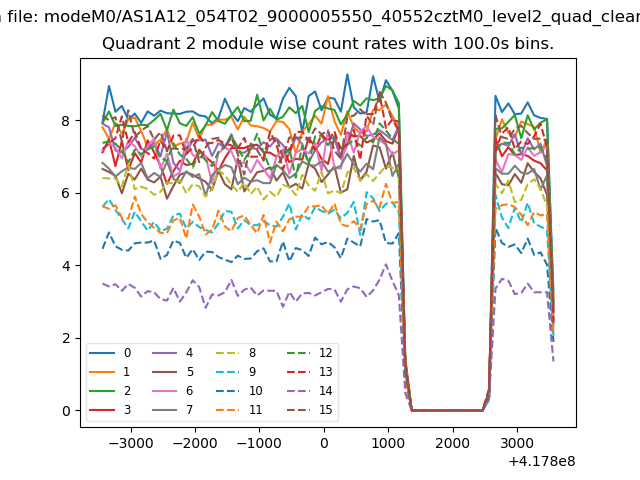
| Module-wise count rates for Quadrant B Data is divided into 100 sec bins |
 |
 |
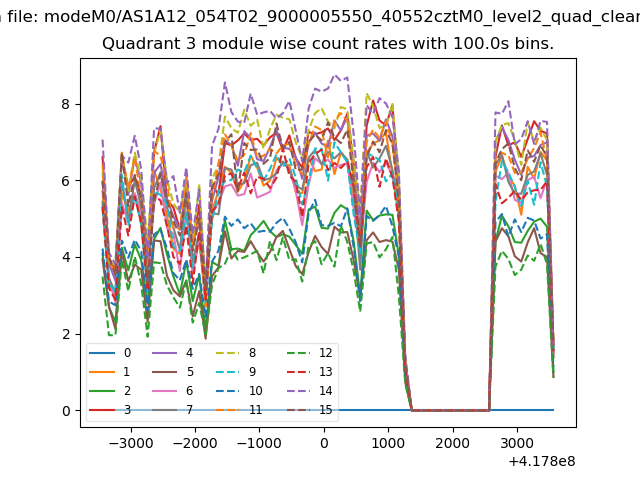
| Module-wise count rates for Quadrant C Data is divided into 100 sec bins |
 |
 |
| Module-wise count rates for Quadrant D Data is divided into 100 sec bins |
 |
 |
| Parameter | Plot |
|---|---|
| CZT HV Monitor | 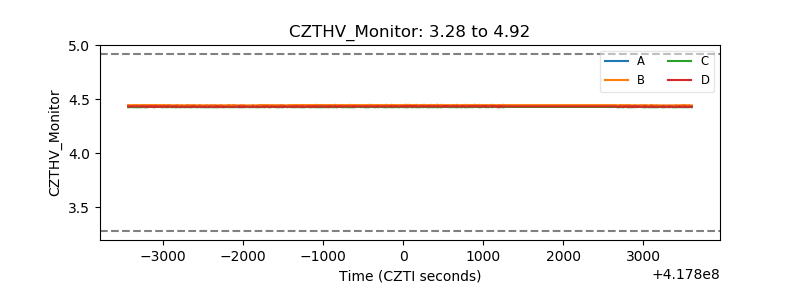 |
| D_VDD | 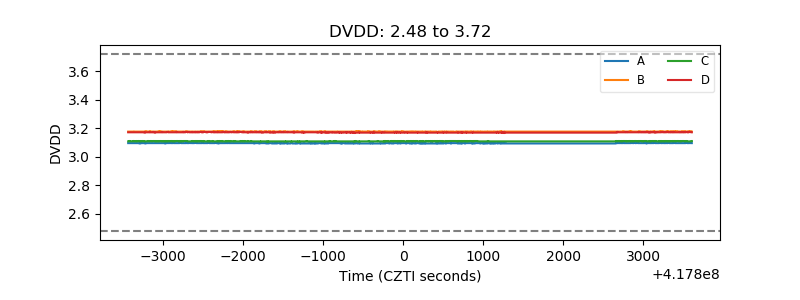 |
| Temperature 1 | 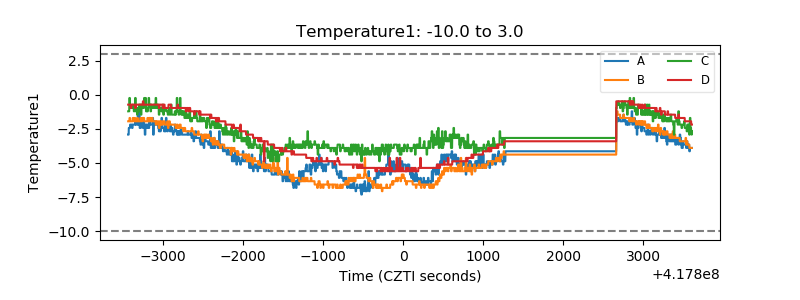 |
| Veto HV Monitor | 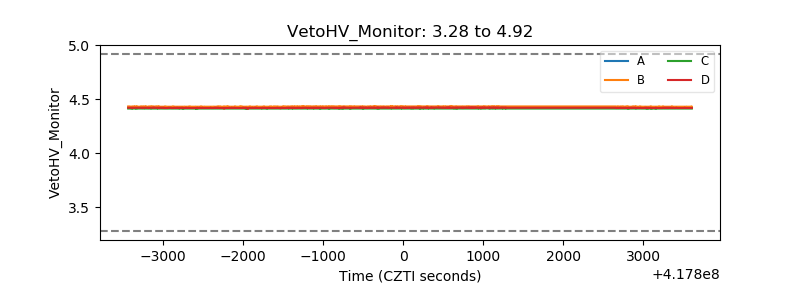 |
| Veto LLD | 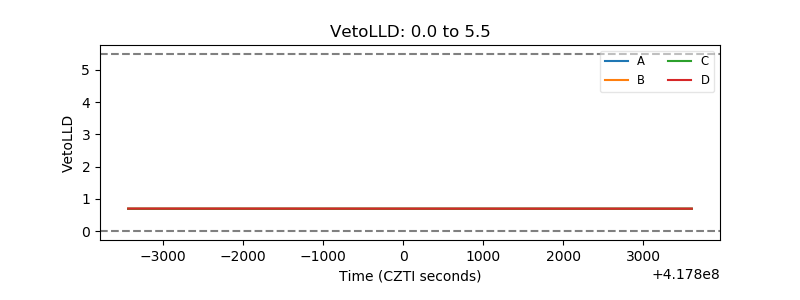 |
| Alpha Counter | 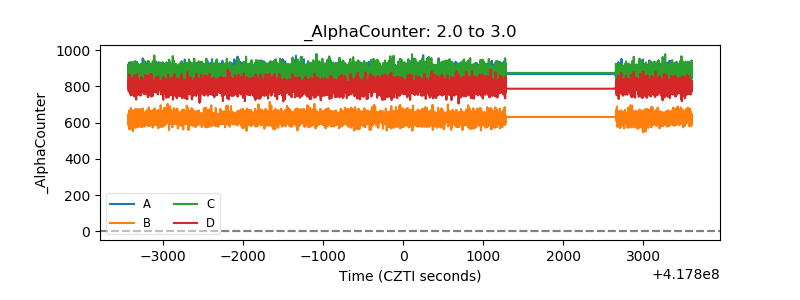 |
| _CPM_Rate | 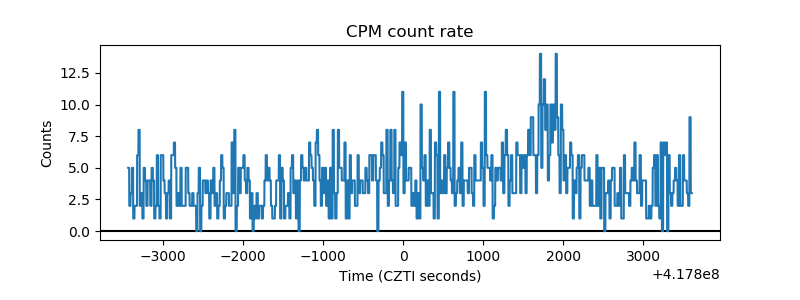 |
| CZT Counter | 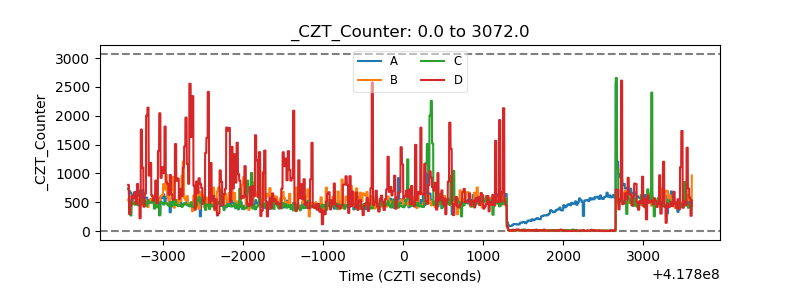 |
| +2.5 Volts monitor | 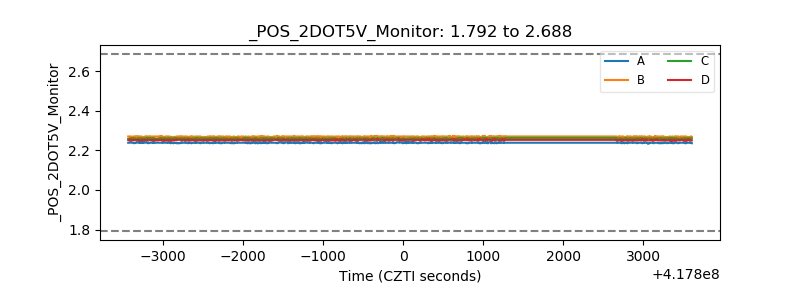 |
| +5 Volts monitor | 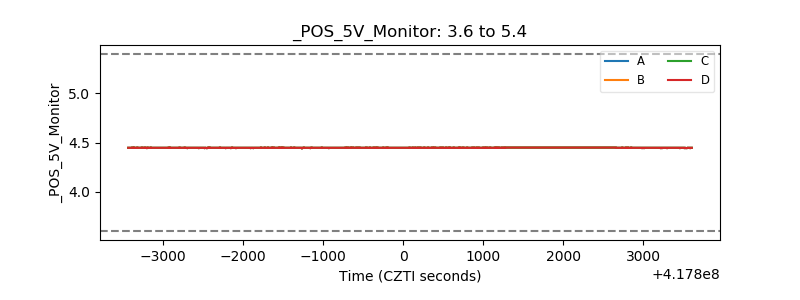 |
| _ROLL_ROT | 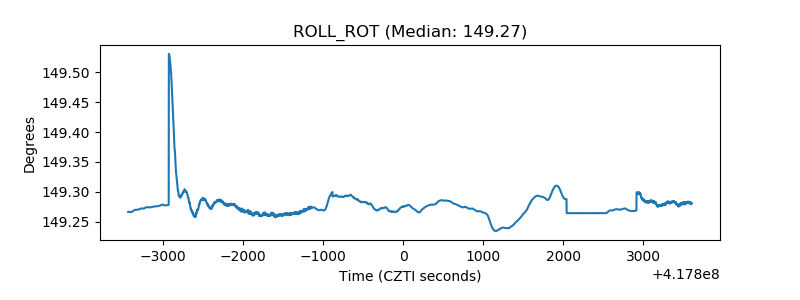 |
| _Roll_DEC | 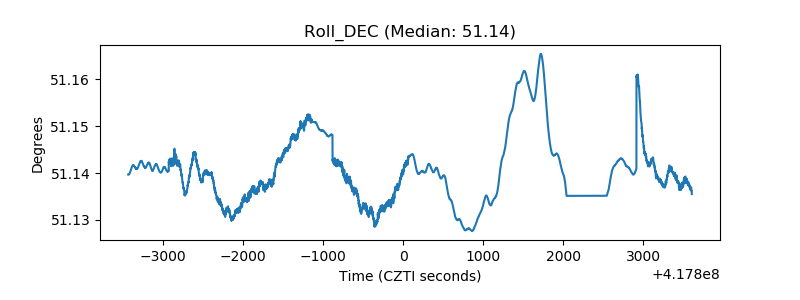 |
| _Roll_RA | 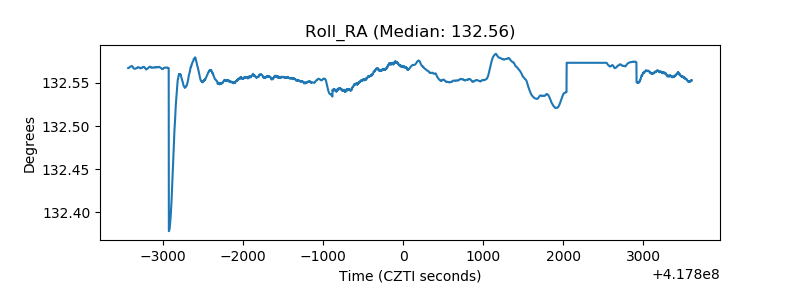 |
| Veto Counter | 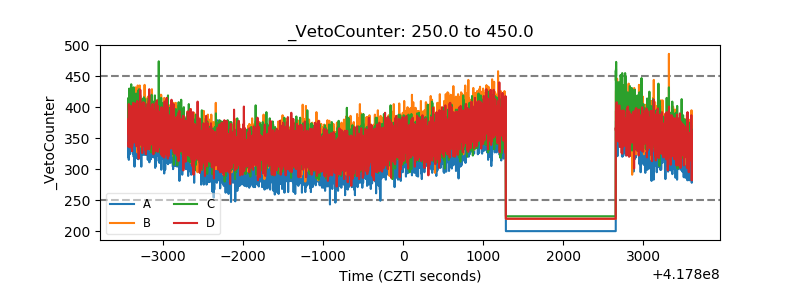 |