| Param | Original file | Final file |
|---|---|---|
| Filename | modeM0/AS1A12_054T02_9000005550_40553cztM0_level2.fits | modeM0/AS1A12_054T02_9000005550_40553cztM0_level2_quad_clean.evt |
| Size (bytes) | 362,782,080 | 92,594,880 |
| Size | 346.0 MB | 88.3 MB |
| Events in quadrant A | 3,059,068 | 639,787 |
| Events in quadrant B | 3,389,862 | 644,218 |
| Events in quadrant C | 3,010,384 | 617,005 |
| Events in quadrant D | 3,511,584 | 491,839 |
| Mode SS | |||
|---|---|---|---|
| Quadrant | BADHDUFLAG | Total packets | Discarded packets |
| A | 0 | 120 | 0 |
| B | 0 | 120 | 0 |
| C | 0 | 120 | 0 |
| D | 0 | 120 | 0 |
| Mode M0 | |||
|---|---|---|---|
| Quadrant | BADHDUFLAG | Total packets | Discarded packets |
| A | 0 | 12729 | 3 |
| B | 0 | 13991 | 2 |
| C | 0 | 12820 | 2 |
| D | 0 | 14586 | 2 |
| Mode M9 | |||
|---|---|---|---|
| Quadrant | BADHDUFLAG | Total packets | Discarded packets |
| A | 0 | 13 | 0 |
| B | 0 | 13 | 0 |
| C | 0 | 13 | 0 |
| D | 0 | 14 | 0 |
| Quadrant | Total seconds | Saturated seconds | Saturation percentage |
|---|---|---|---|
| A | 5874 | 11 | 0.187266% |
| B | 5874 | 47 | 0.800136% |
| C | 5874 | 54 | 0.919305% |
| D | 5874 | 1013 | 17.245489% |
Noise dominated data is calculated using 1-second bins in cleaned event files. If a bin has >2000 counts, and if more than 50% of those come from <1% of pixels, then it is considered to be noise-dominated and hence unusable.
| Quadrant | # 1 sec bins | Bins with >0 counts | Bins with >2000 counts | High rate bins dominated by noise | Noise dominated (total time) | Noise dominated (detector-on time) | Marked lightcurve |
|---|---|---|---|---|---|---|---|
| A | 7157 | 5875 | 5 | 5 | 0.07% | 0.09% | 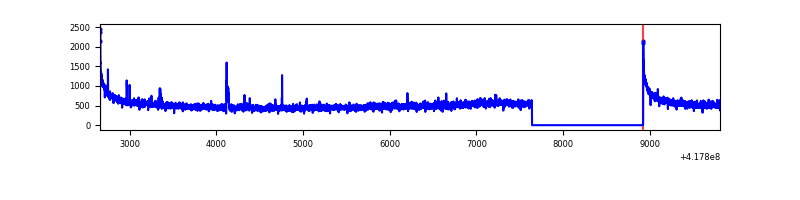 |
| B | 7157 | 5875 | 37 | 37 | 0.52% | 0.63% | 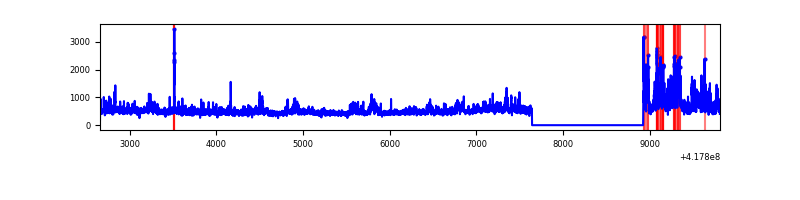 |
| C | 7157 | 5875 | 40 | 40 | 0.56% | 0.68% | 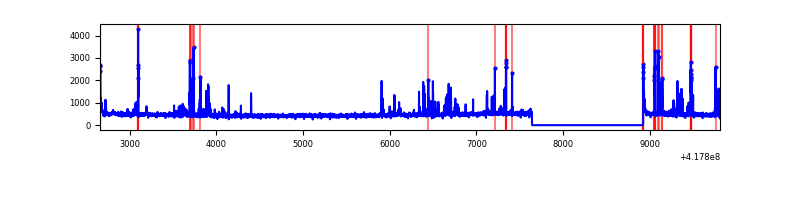 |
| D | 7157 | 5874 | 144 | 144 | 2.01% | 2.45% | 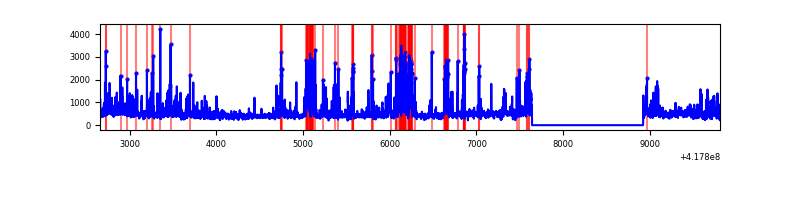 |
Top three noisy pixels from each quadrant. If the there are fewer than three noisy pixels in the level2.evt file, extra rows are filled as -1
| Pixel properties | Quadrant properties | ||||||
|---|---|---|---|---|---|---|---|
| Quadrant | DetID | PixID | Counts | Sigma | Mean | Median | Sigma |
| A | 10 | 83 | 547533 | 4291.27 | 629 | 615 | 127.4 |
| A | 3 | 1 | 20264 | 154.17 | 629 | 615 | 127.4 |
| A | 2 | 79 | 17890 | 135.54 | 629 | 615 | 127.4 |
| B | 3 | 112 | 764823 | 6296.75 | 624 | 607 | 121.4 |
| B | 15 | 35 | 49277 | 401.02 | 624 | 607 | 121.4 |
| B | 15 | 85 | 48655 | 395.89 | 624 | 607 | 121.4 |
| C | 14 | 254 | 292947 | 2043.76 | 614 | 617 | 143.0 |
| C | 15 | 214 | 254985 | 1778.36 | 614 | 617 | 143.0 |
| C | 0 | 10 | 41223 | 283.89 | 614 | 617 | 143.0 |
| D | 2 | 250 | 476812 | 3403.73 | 561 | 547 | 139.9 |
| D | 12 | 227 | 443209 | 3163.58 | 561 | 547 | 139.9 |
| D | 12 | 191 | 226987 | 1618.3 | 561 | 547 | 139.9 |
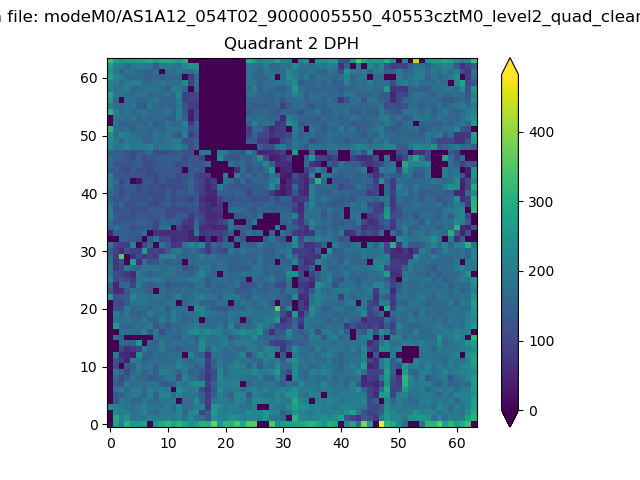
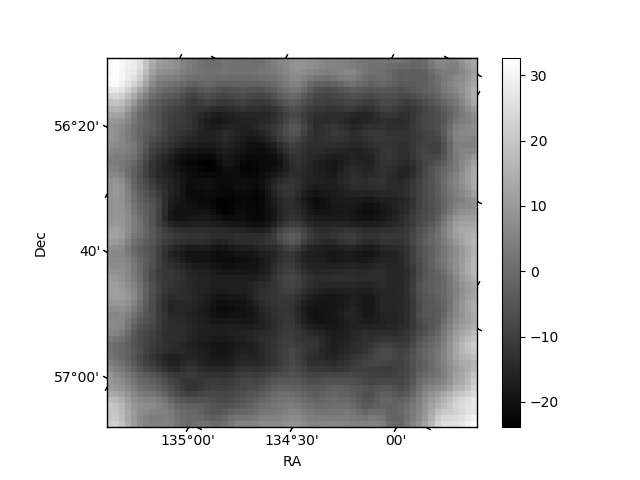
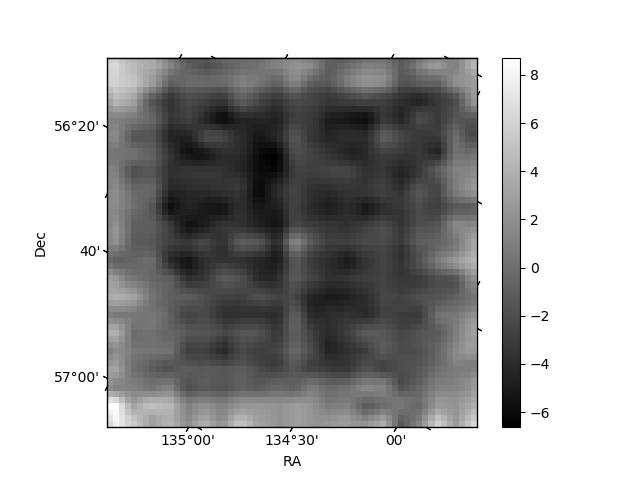
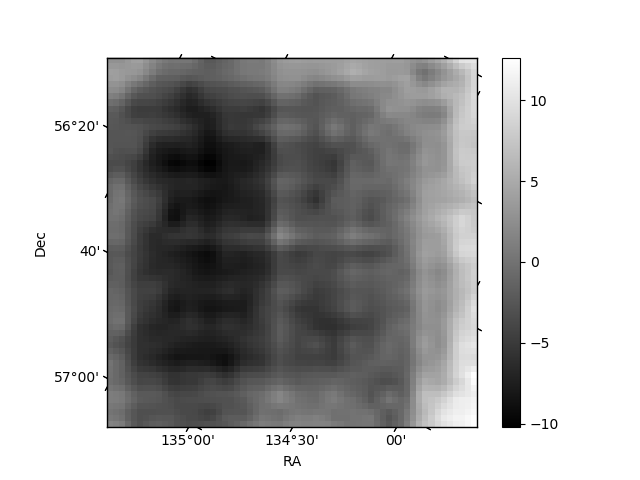
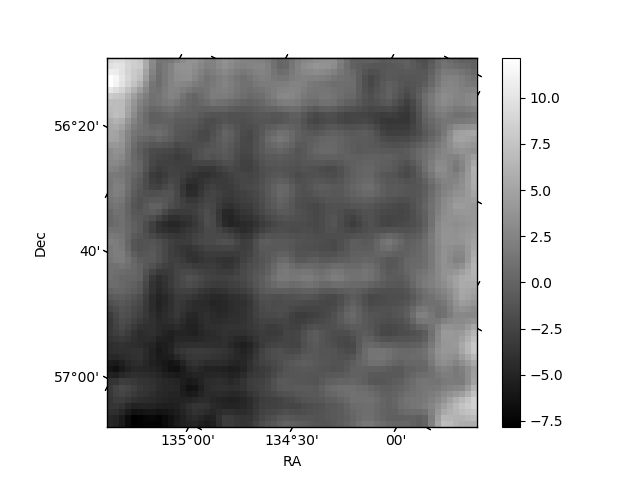
Histogram calculated using DETX and DETY for each event in the final _common_clean file
| Quadrant A | 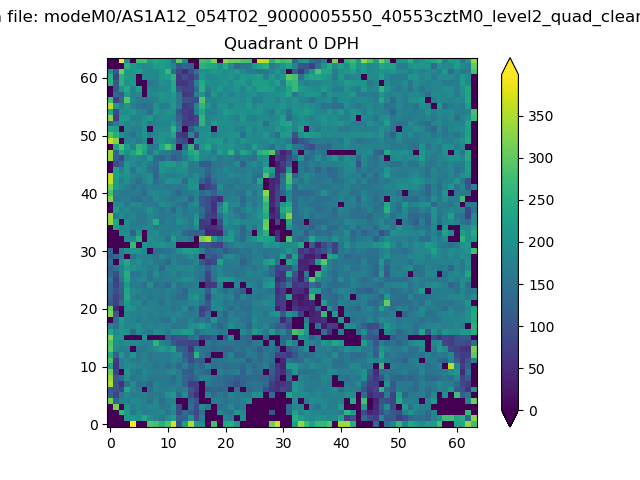 |
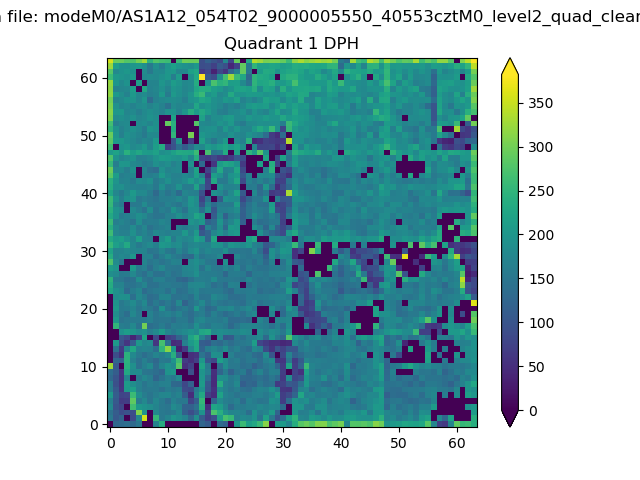 |
Quadrant B |
|---|---|---|---|
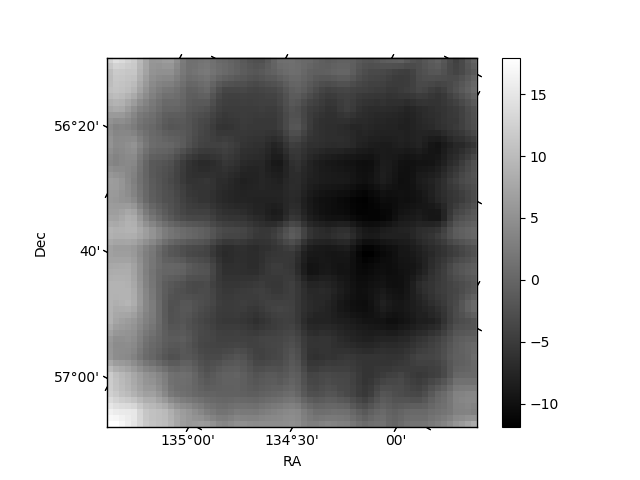
| Quadrant D | 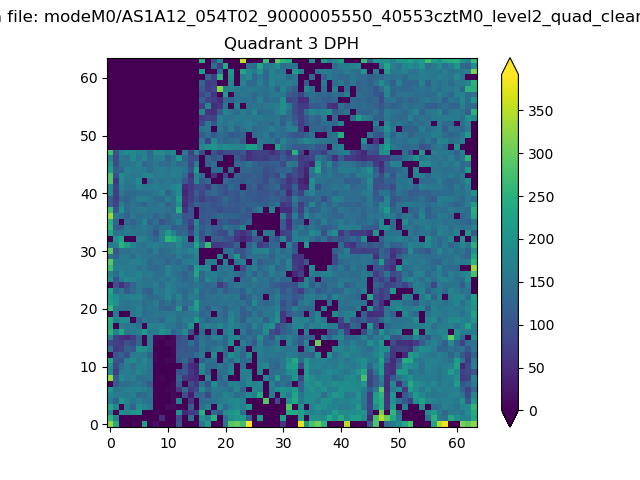 |
 |
Quadrant C |
| Plot type | Count rate plots | Images |
|---|---|---|
| Comparison with Poisson distribution Blue bars denote a histogram of data divided into 1 sec bins. Red curve is a Poisson curve with rate = median count rate of data. |
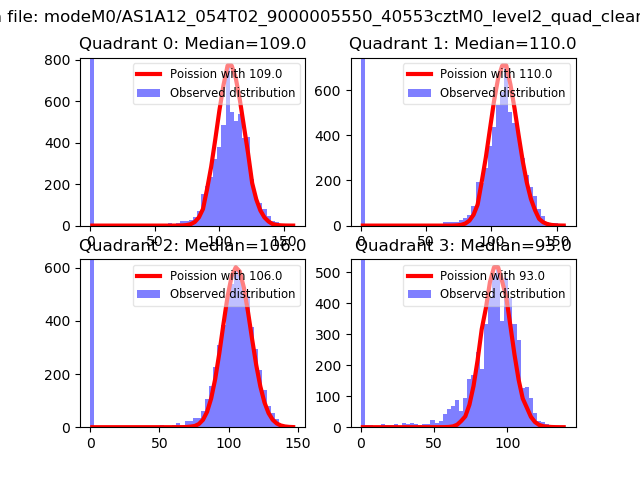 |
 |
| Quadrant-wise count rates Data is divided into 100 sec bins |
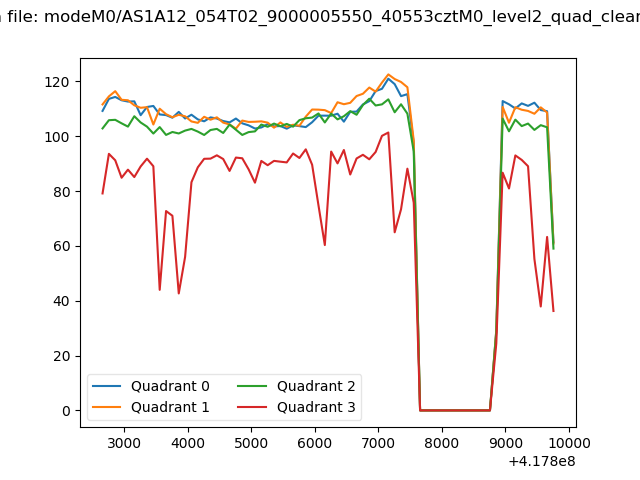 |
|
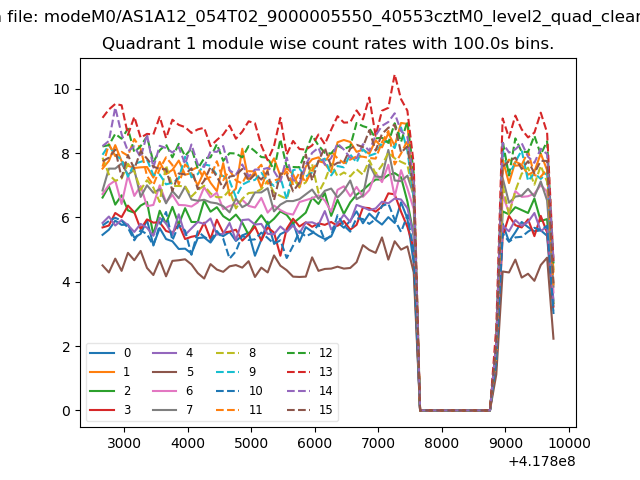
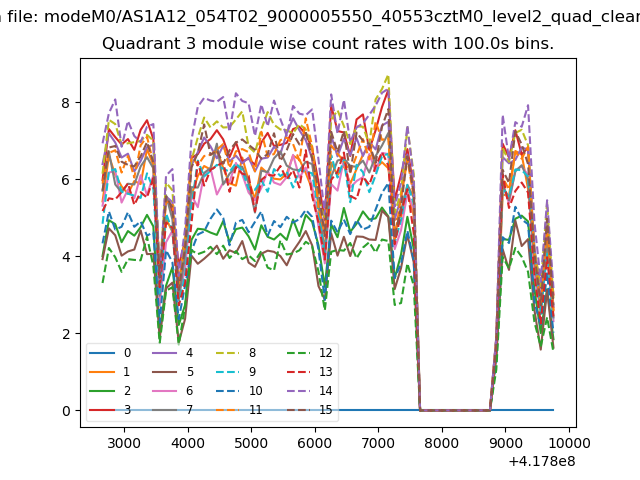
| Module-wise count rates for Quadrant A Data is divided into 100 sec bins |
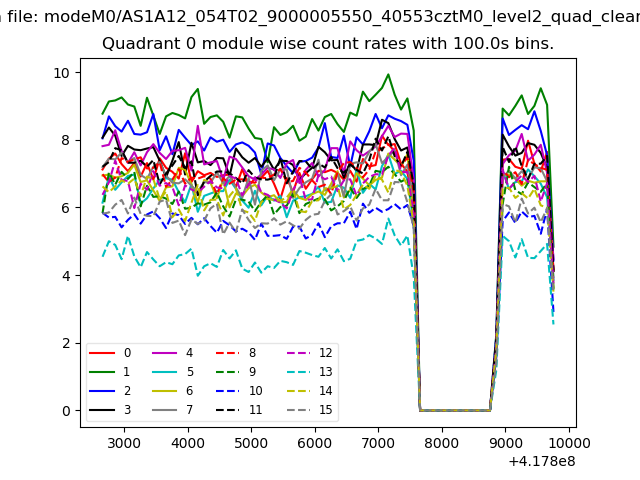 |
 |
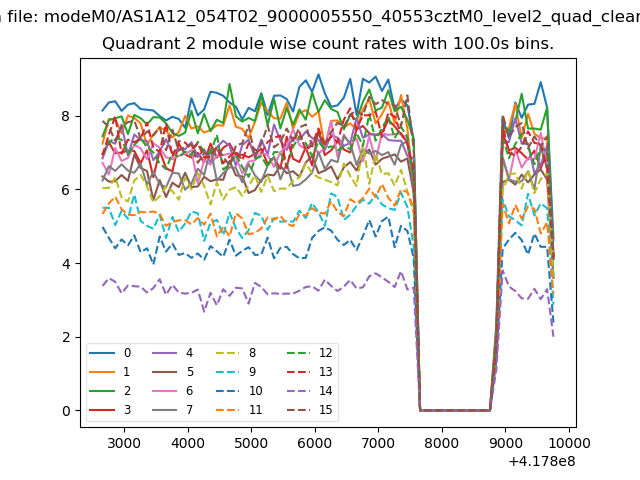
| Module-wise count rates for Quadrant B Data is divided into 100 sec bins |
 |
 |
| Module-wise count rates for Quadrant C Data is divided into 100 sec bins |
 |
 |
| Module-wise count rates for Quadrant D Data is divided into 100 sec bins |
 |
 |
| Parameter | Plot |
|---|---|
| CZT HV Monitor | 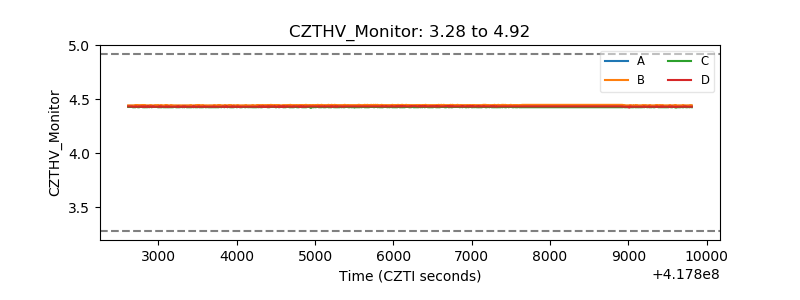 |
| D_VDD | 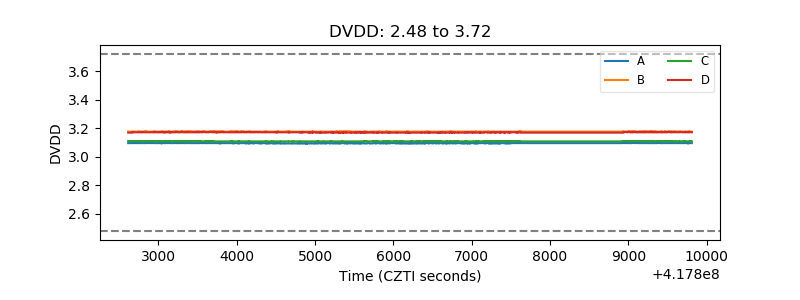 |
| Temperature 1 | 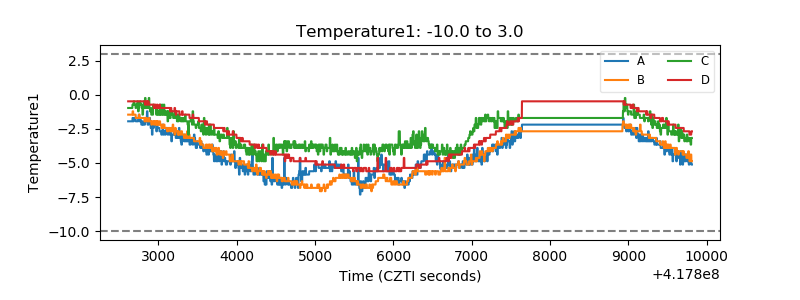 |
| Veto HV Monitor | 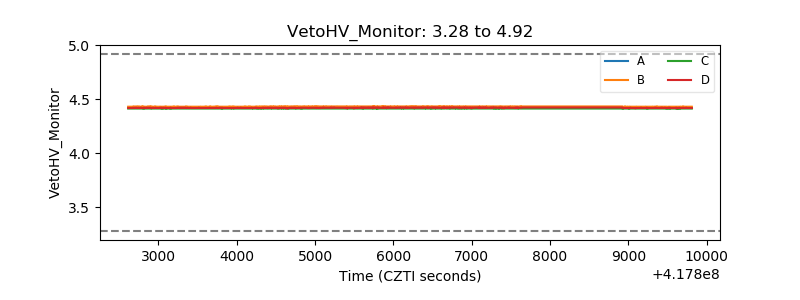 |
| Veto LLD | 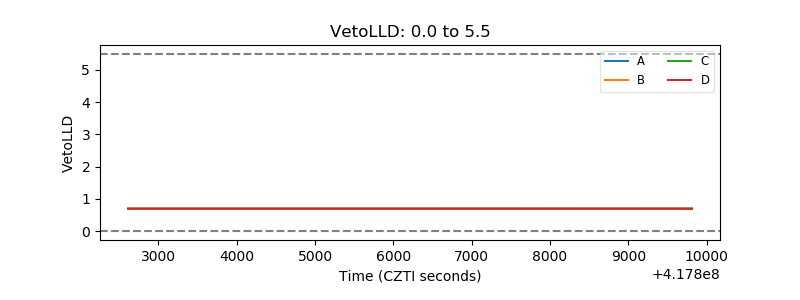 |
| Alpha Counter | 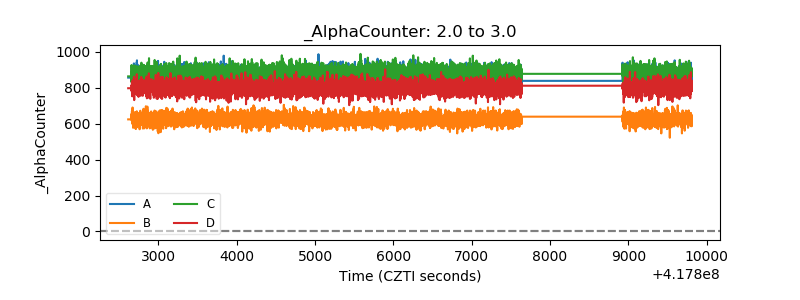 |
| _CPM_Rate | 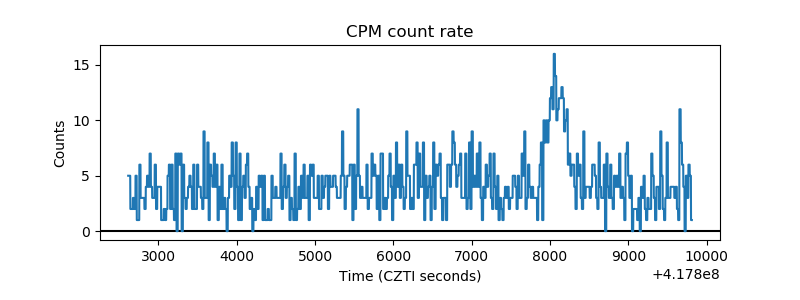 |
| CZT Counter | 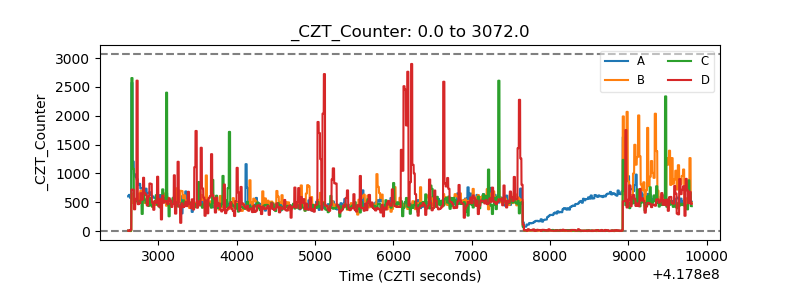 |
| +2.5 Volts monitor | 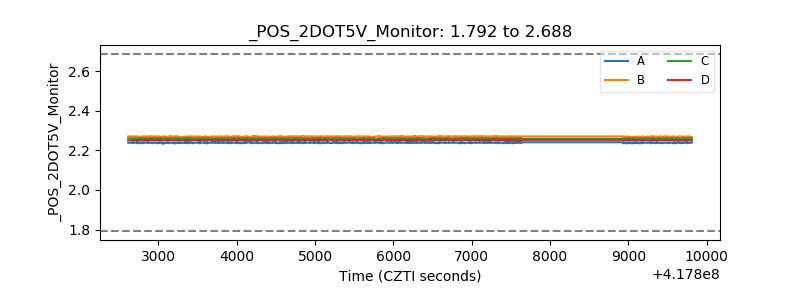 |
| +5 Volts monitor | 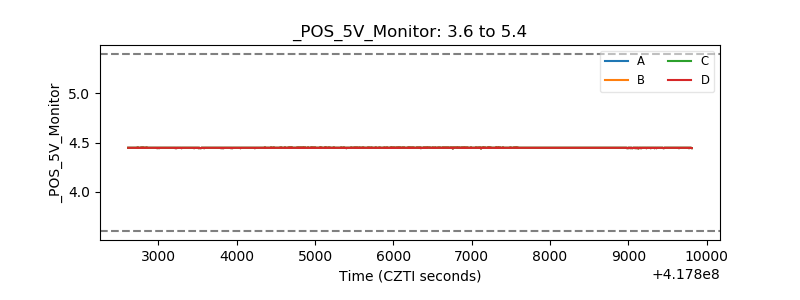 |
| _ROLL_ROT | 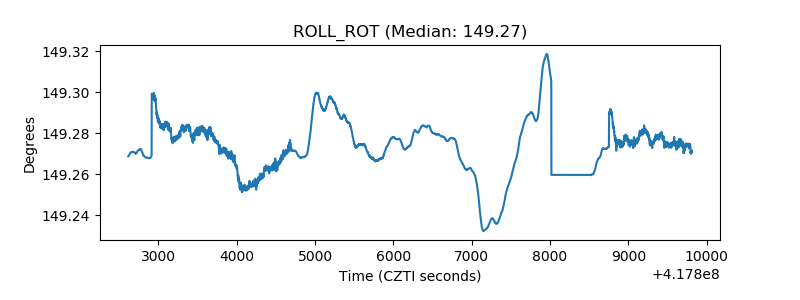 |
| _Roll_DEC | 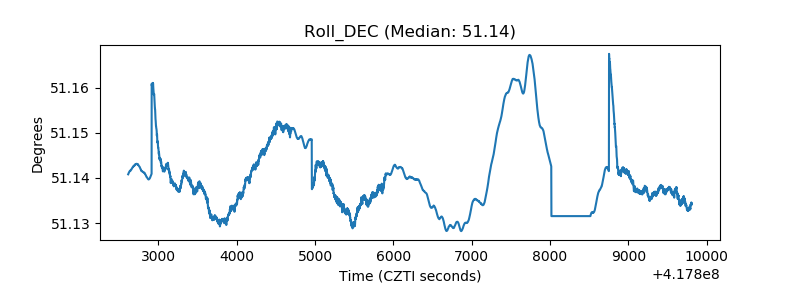 |
| _Roll_RA | 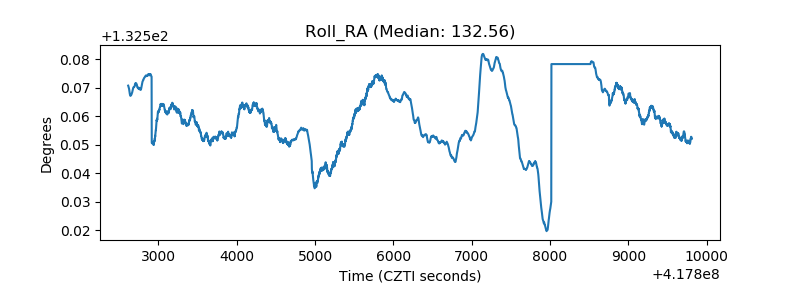 |
| Veto Counter | 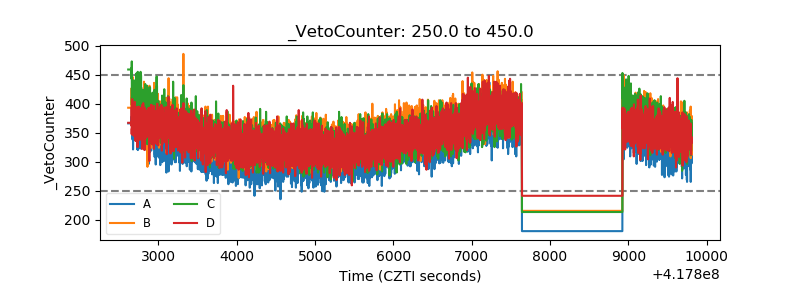 |