| Param | Original file | Final file |
|---|---|---|
| Filename | modeM0/AS1A12_054T02_9000005550_40556cztM0_level2.fits | modeM0/AS1A12_054T02_9000005550_40556cztM0_level2_quad_clean.evt |
| Size (bytes) | 977,656,320 | 239,736,960 |
| Size | 932.4 MB | 228.6 MB |
| Events in quadrant A | 8,101,726 | 1,656,186 |
| Events in quadrant B | 8,923,336 | 1,681,377 |
| Events in quadrant C | 8,270,162 | 1,613,856 |
| Events in quadrant D | 9,684,371 | 1,231,274 |
| Mode SS | |||
|---|---|---|---|
| Quadrant | BADHDUFLAG | Total packets | Discarded packets |
| A | 0 | 316 | 0 |
| B | 0 | 316 | 0 |
| C | 0 | 316 | 0 |
| D | 0 | 316 | 0 |
| Mode M0 | |||
|---|---|---|---|
| Quadrant | BADHDUFLAG | Total packets | Discarded packets |
| A | 0 | 33941 | 5 |
| B | 0 | 36746 | 4 |
| C | 0 | 35008 | 4 |
| D | 0 | 39643 | 4 |
| Mode M9 | |||
|---|---|---|---|
| Quadrant | BADHDUFLAG | Total packets | Discarded packets |
| A | 0 | 46 | 0 |
| B | 0 | 46 | 0 |
| C | 0 | 46 | 0 |
| D | 0 | 47 | 0 |
| Quadrant | Total seconds | Saturated seconds | Saturation percentage |
|---|---|---|---|
| A | 15587 | 32 | 0.205299% |
| B | 15587 | 68 | 0.436261% |
| C | 15587 | 218 | 1.398601% |
| D | 15587 | 3169 | 20.331045% |
Noise dominated data is calculated using 1-second bins in cleaned event files. If a bin has >2000 counts, and if more than 50% of those come from <1% of pixels, then it is considered to be noise-dominated and hence unusable.
| Quadrant | # 1 sec bins | Bins with >0 counts | Bins with >2000 counts | High rate bins dominated by noise | Noise dominated (total time) | Noise dominated (detector-on time) | Marked lightcurve |
|---|---|---|---|---|---|---|---|
| A | 19826 | 15590 | 9 | 9 | 0.05% | 0.06% | 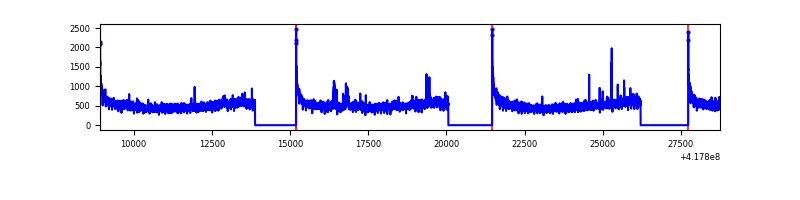 |
| B | 19826 | 15590 | 40 | 40 | 0.20% | 0.26% | 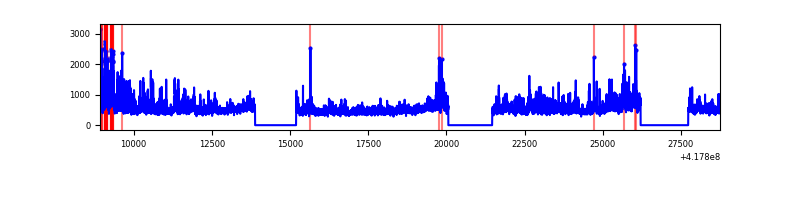 |
| C | 19826 | 15590 | 182 | 182 | 0.92% | 1.17% | 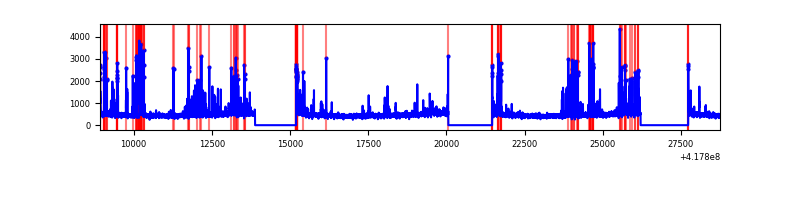 |
| D | 19826 | 15589 | 271 | 271 | 1.37% | 1.74% | 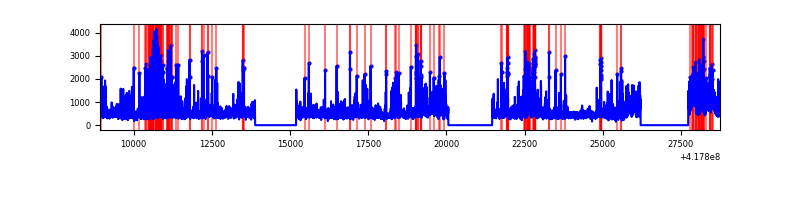 |
Top three noisy pixels from each quadrant. If the there are fewer than three noisy pixels in the level2.evt file, extra rows are filled as -1
| Pixel properties | Quadrant properties | ||||||
|---|---|---|---|---|---|---|---|
| Quadrant | DetID | PixID | Counts | Sigma | Mean | Median | Sigma |
| A | 10 | 83 | 1270977 | 3745.49 | 1671 | 1635 | 338.9 |
| A | 6 | 10 | 139796 | 407.67 | 1671 | 1635 | 338.9 |
| A | 12 | 189 | 138673 | 404.36 | 1671 | 1635 | 338.9 |
| B | 3 | 112 | 2008751 | 6293.48 | 1662 | 1613 | 318.9 |
| B | 0 | 230 | 118448 | 366.34 | 1662 | 1613 | 318.9 |
| B | 4 | 171 | 100727 | 310.78 | 1662 | 1613 | 318.9 |
| C | 14 | 254 | 978620 | 2577.01 | 1626 | 1634 | 379.1 |
| C | 15 | 214 | 669373 | 1761.31 | 1626 | 1634 | 379.1 |
| C | 10 | 20 | 153170 | 399.71 | 1626 | 1634 | 379.1 |
| D | 12 | 227 | 1788151 | 4906.34 | 1471 | 1427 | 364.2 |
| D | 2 | 250 | 776876 | 2129.38 | 1471 | 1427 | 364.2 |
| D | 12 | 191 | 715512 | 1960.88 | 1471 | 1427 | 364.2 |
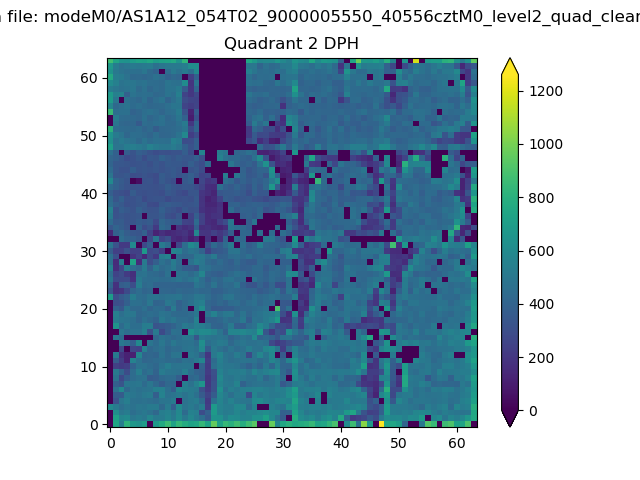
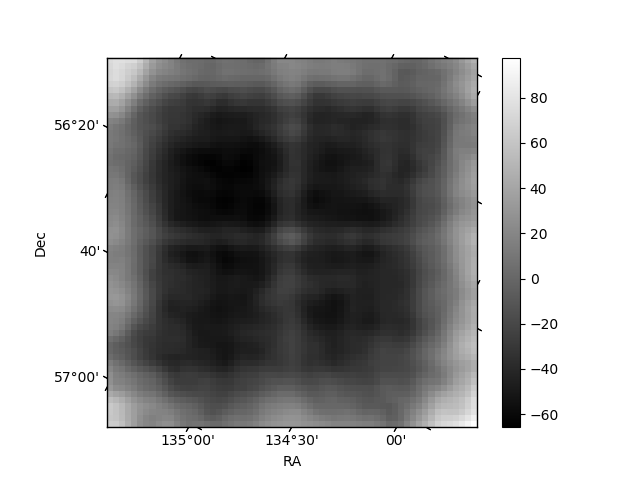
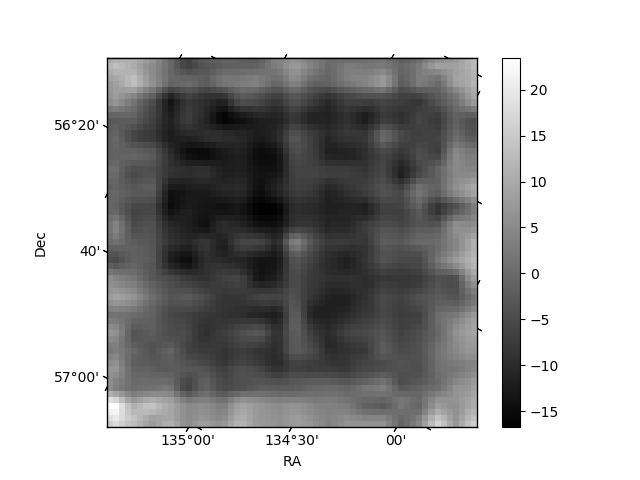
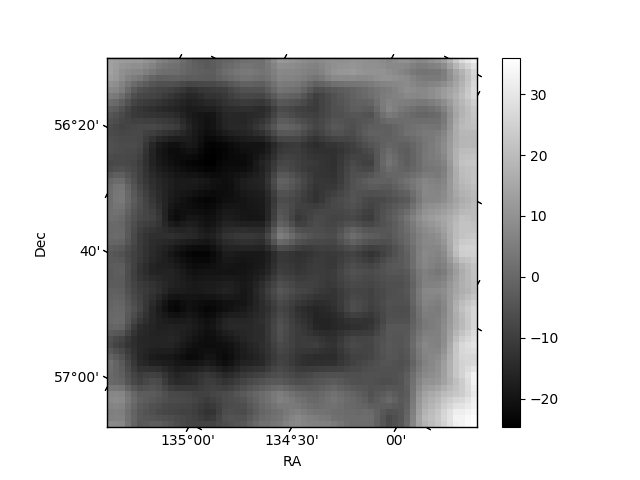
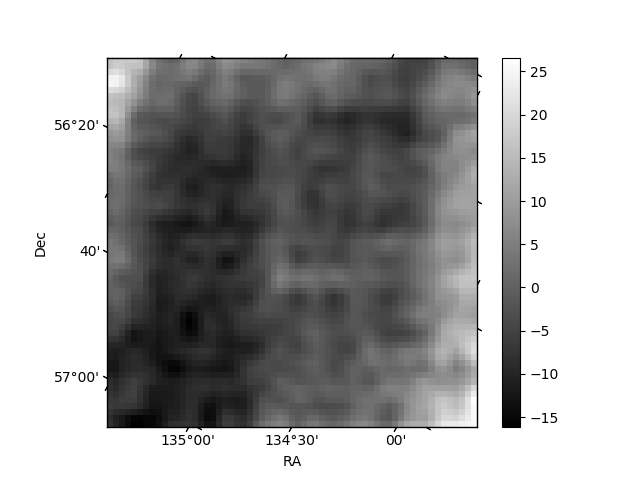
Histogram calculated using DETX and DETY for each event in the final _common_clean file
| Quadrant A | 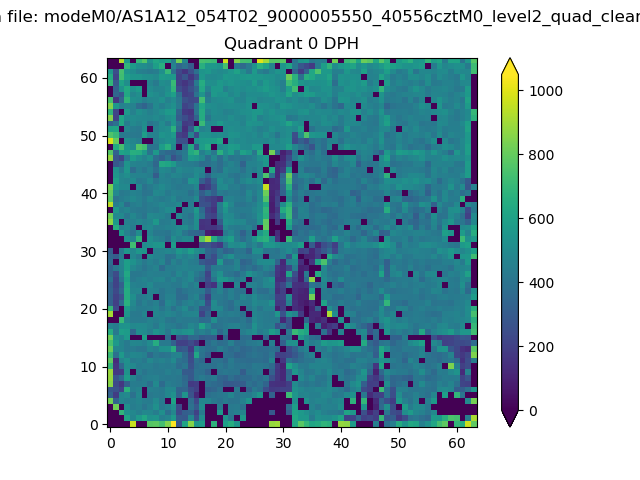 |
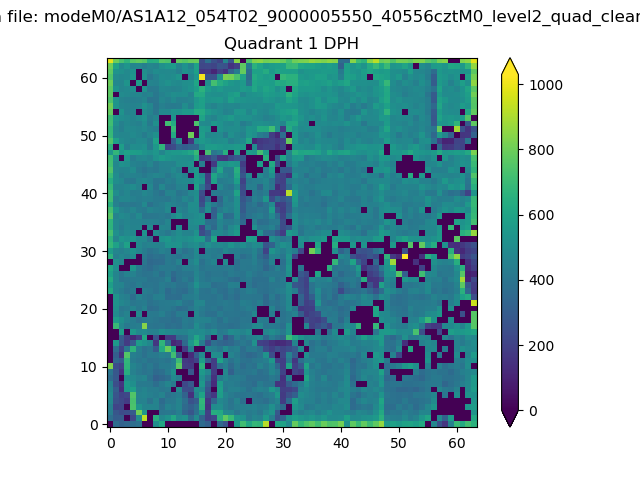 |
Quadrant B |
|---|---|---|---|
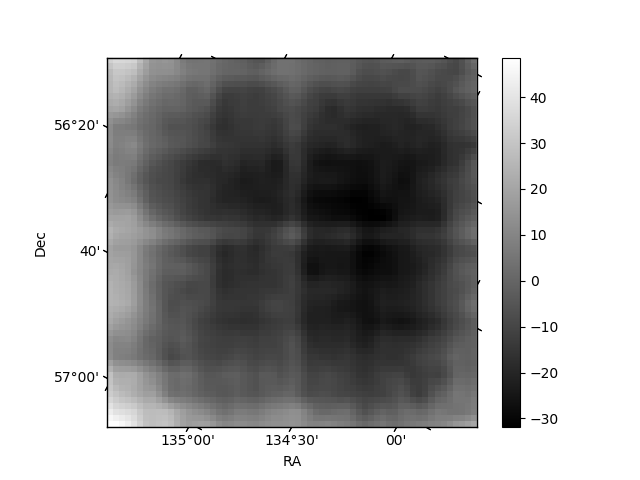
| Quadrant D | 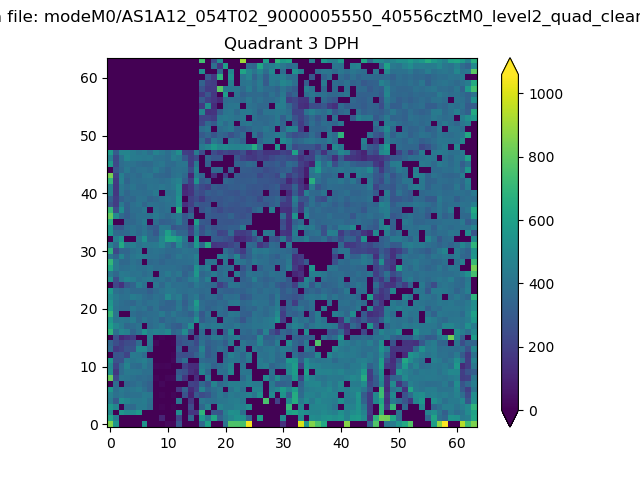 |
 |
Quadrant C |
| Plot type | Count rate plots | Images |
|---|---|---|
| Comparison with Poisson distribution Blue bars denote a histogram of data divided into 1 sec bins. Red curve is a Poisson curve with rate = median count rate of data. |
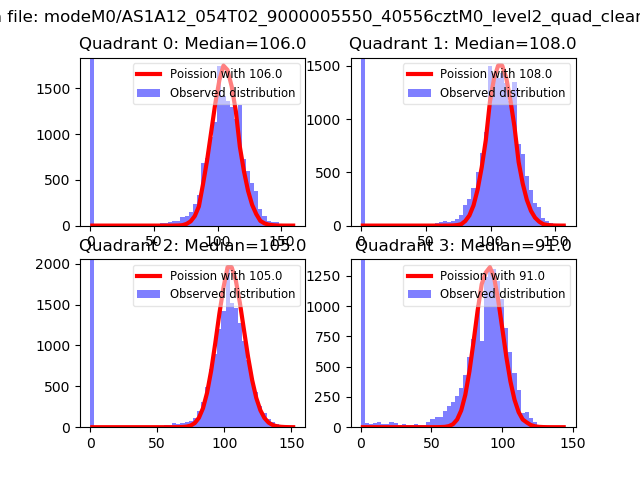 |
 |
| Quadrant-wise count rates Data is divided into 100 sec bins |
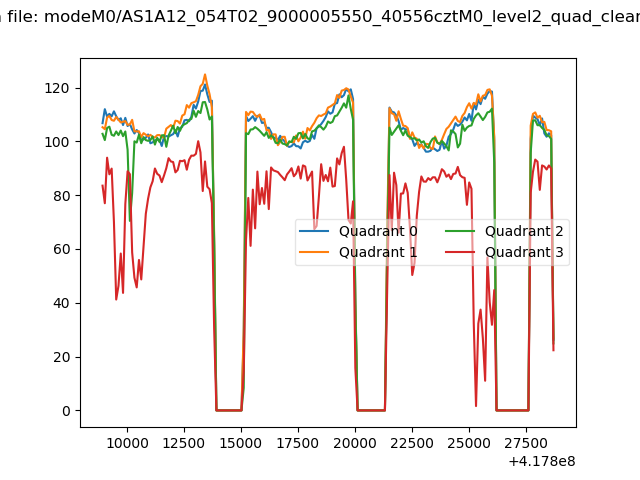 |
|
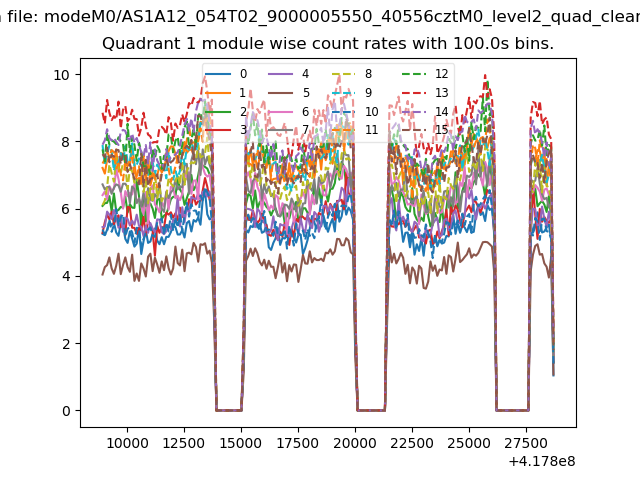
| Module-wise count rates for Quadrant A Data is divided into 100 sec bins |
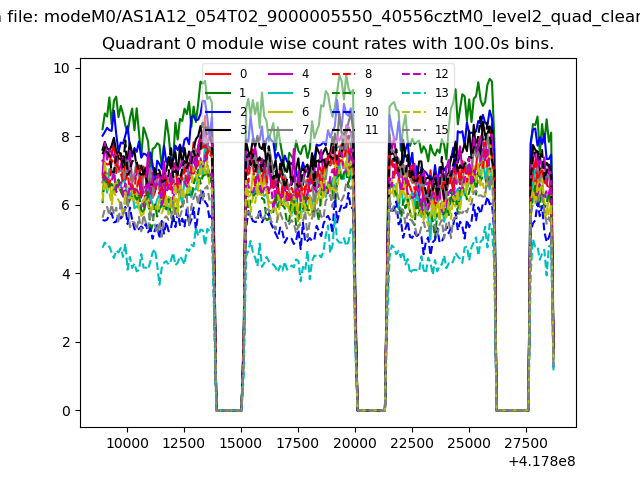 |
 |
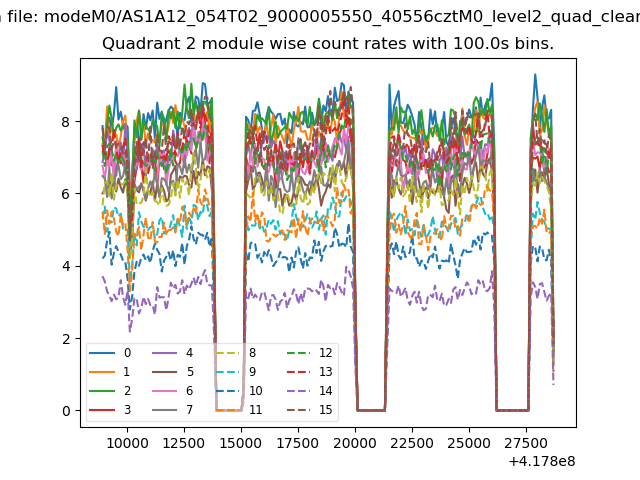
| Module-wise count rates for Quadrant B Data is divided into 100 sec bins |
 |
 |
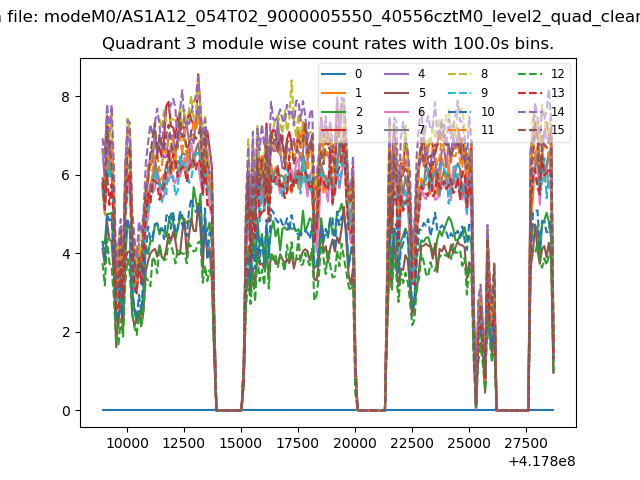
| Module-wise count rates for Quadrant C Data is divided into 100 sec bins |
 |
 |
| Module-wise count rates for Quadrant D Data is divided into 100 sec bins |
 |
 |
| Parameter | Plot |
|---|---|
| CZT HV Monitor | 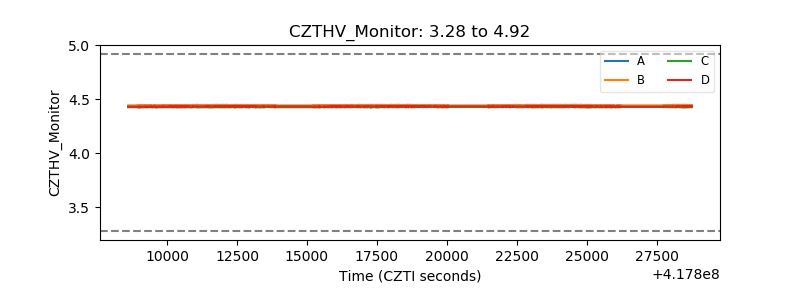 |
| D_VDD | 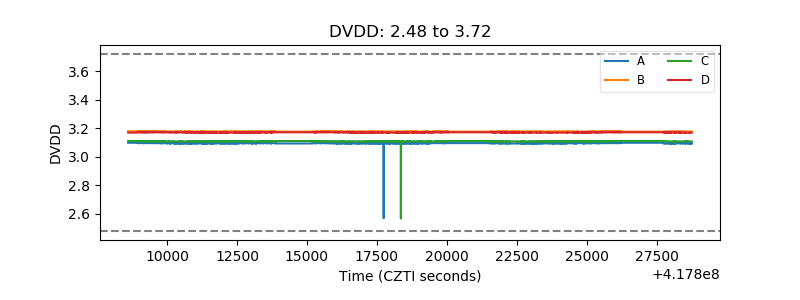 |
| Temperature 1 | 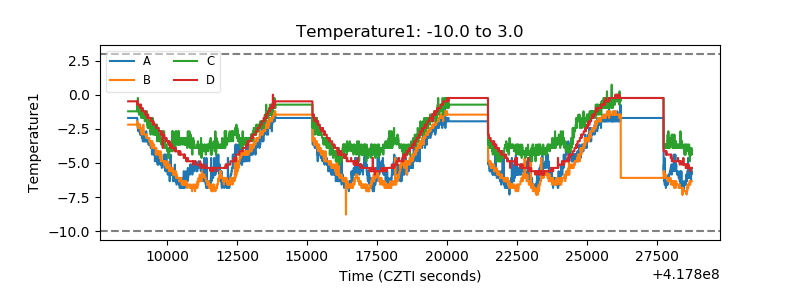 |
| Veto HV Monitor | 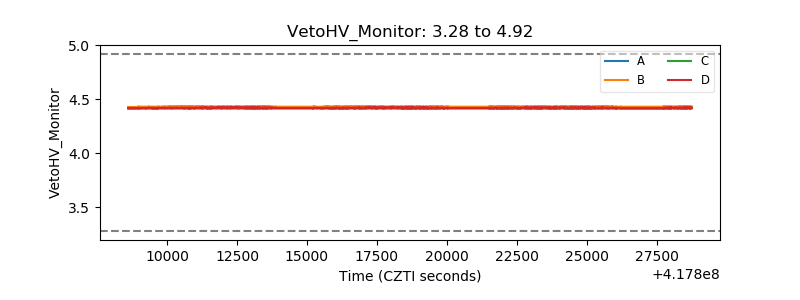 |
| Veto LLD | 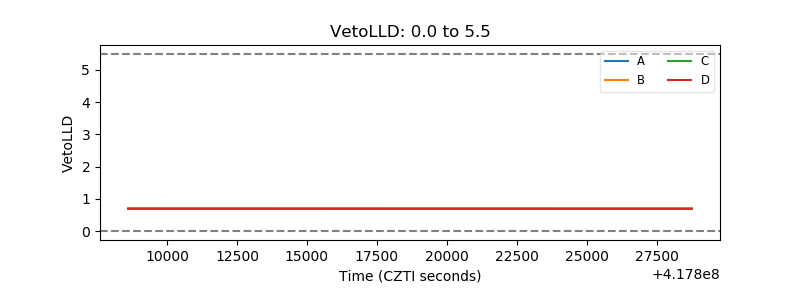 |
| Alpha Counter | 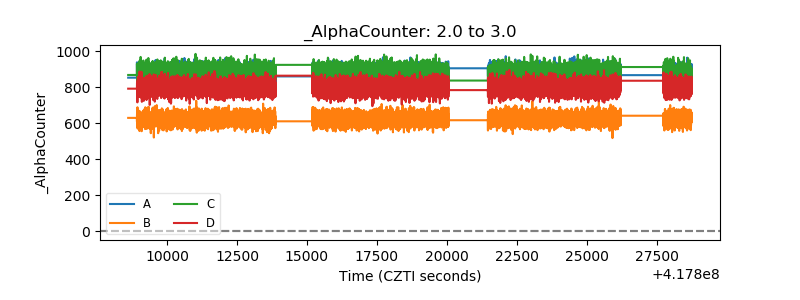 |
| _CPM_Rate | 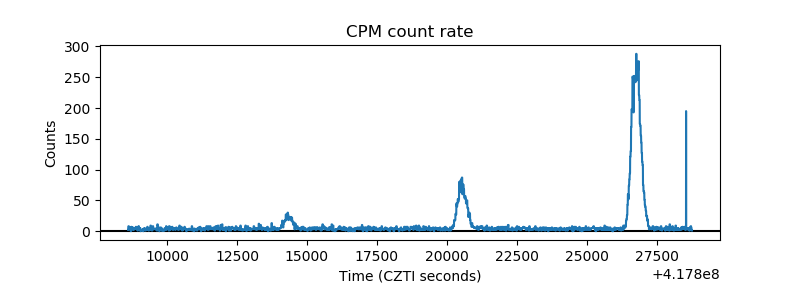 |
| CZT Counter | 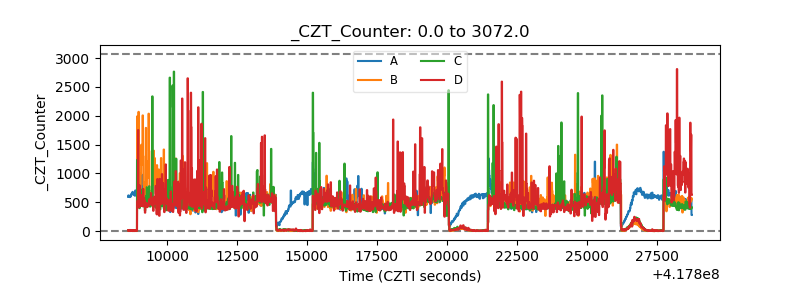 |
| +2.5 Volts monitor | 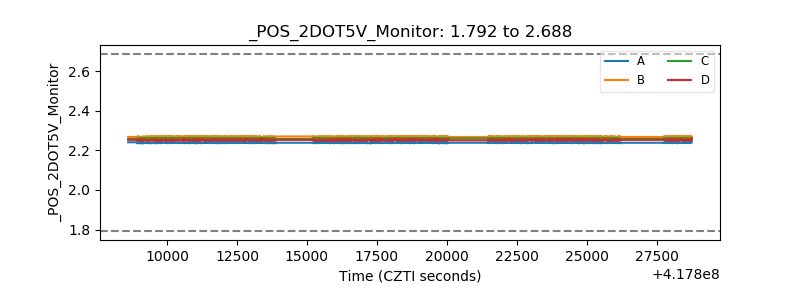 |
| +5 Volts monitor | 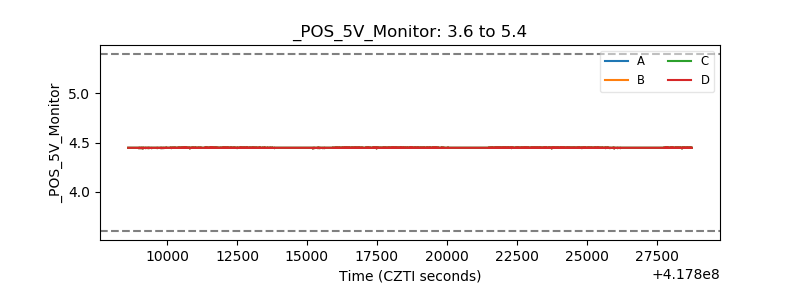 |
| _ROLL_ROT | 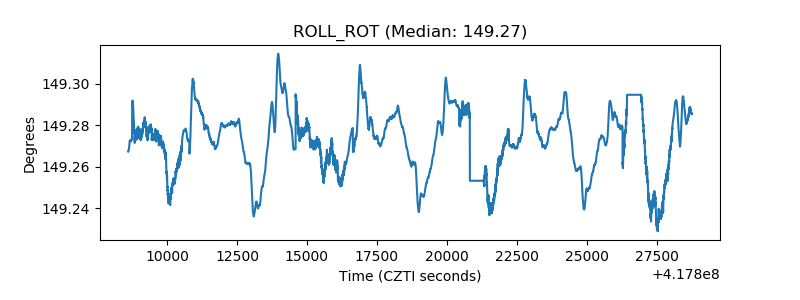 |
| _Roll_DEC | 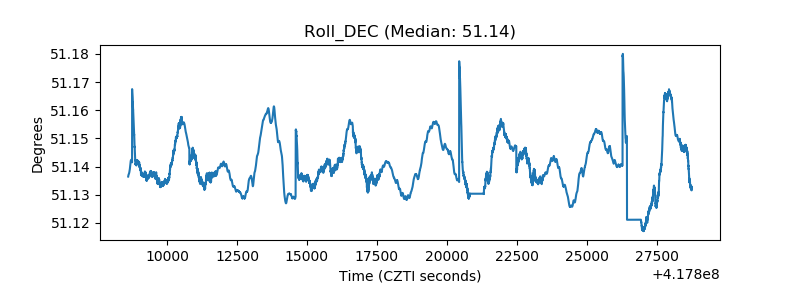 |
| _Roll_RA | 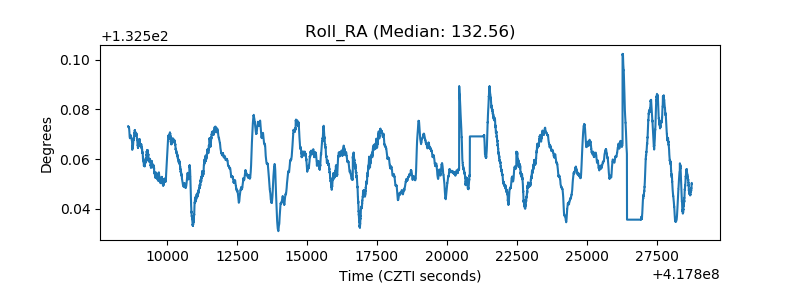 |
| Veto Counter | 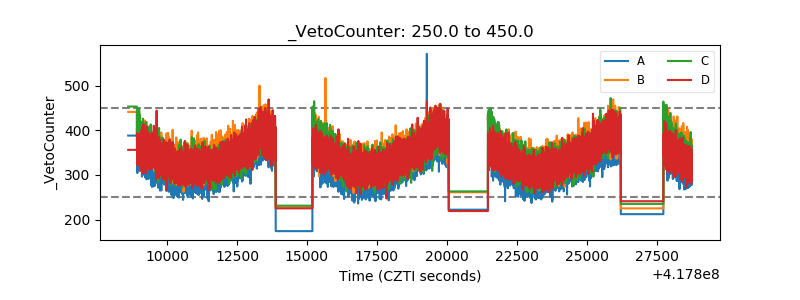 |