| Param | Original file | Final file |
|---|---|---|
| Filename | modeM0/AS1A12_054T02_9000005550_40557cztM0_level2.fits | modeM0/AS1A12_054T02_9000005550_40557cztM0_level2_quad_clean.evt |
| Size (bytes) | 353,275,200 | 85,553,280 |
| Size | 336.9 MB | 81.6 MB |
| Events in quadrant A | 2,902,658 | 587,886 |
| Events in quadrant B | 2,965,336 | 599,530 |
| Events in quadrant C | 2,602,566 | 578,685 |
| Events in quadrant D | 4,178,678 | 440,411 |
| Mode SS | |||
|---|---|---|---|
| Quadrant | BADHDUFLAG | Total packets | Discarded packets |
| A | 0 | 112 | 0 |
| B | 0 | 112 | 0 |
| C | 0 | 112 | 0 |
| D | 0 | 112 | 0 |
| Mode M0 | |||
|---|---|---|---|
| Quadrant | BADHDUFLAG | Total packets | Discarded packets |
| A | 0 | 11881 | 3 |
| B | 0 | 12412 | 2 |
| C | 0 | 11343 | 2 |
| D | 0 | 16241 | 2 |
| Mode M9 | |||
|---|---|---|---|
| Quadrant | BADHDUFLAG | Total packets | Discarded packets |
| A | 0 | 23 | 0 |
| B | 0 | 23 | 0 |
| C | 0 | 23 | 0 |
| D | 0 | 24 | 0 |
| Quadrant | Total seconds | Saturated seconds | Saturation percentage |
|---|---|---|---|
| A | 5481 | 10 | 0.182448% |
| B | 5481 | 52 | 0.948732% |
| C | 5481 | 19 | 0.346652% |
| D | 5481 | 1138 | 20.762635% |
Noise dominated data is calculated using 1-second bins in cleaned event files. If a bin has >2000 counts, and if more than 50% of those come from <1% of pixels, then it is considered to be noise-dominated and hence unusable.
| Quadrant | # 1 sec bins | Bins with >0 counts | Bins with >2000 counts | High rate bins dominated by noise | Noise dominated (total time) | Noise dominated (detector-on time) | Marked lightcurve |
|---|---|---|---|---|---|---|---|
| A | 7153 | 5482 | 3 | 3 | 0.04% | 0.05% | 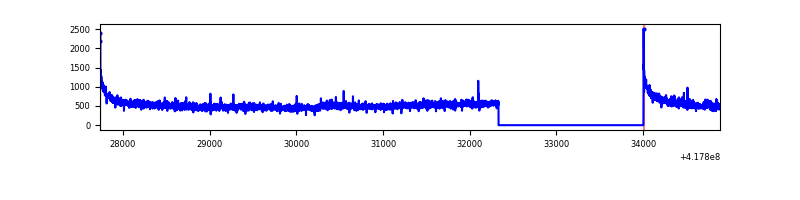 |
| B | 7153 | 5482 | 38 | 38 | 0.53% | 0.69% | 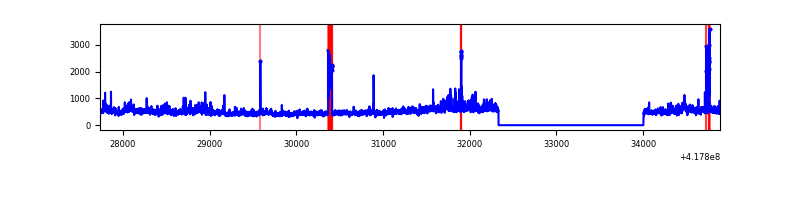 |
| C | 7153 | 5482 | 15 | 15 | 0.21% | 0.27% | 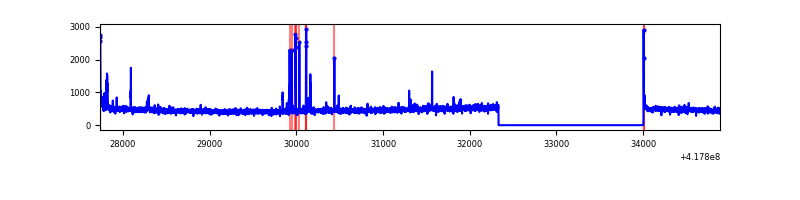 |
| D | 7153 | 5481 | 202 | 202 | 2.82% | 3.69% | 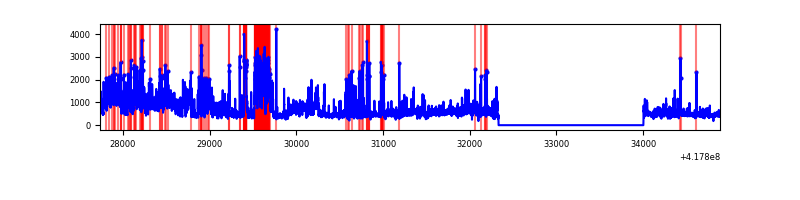 |
Top three noisy pixels from each quadrant. If the there are fewer than three noisy pixels in the level2.evt file, extra rows are filled as -1
| Pixel properties | Quadrant properties | ||||||
|---|---|---|---|---|---|---|---|
| Quadrant | DetID | PixID | Counts | Sigma | Mean | Median | Sigma |
| A | 10 | 83 | 489176 | 4043.43 | 587 | 574 | 120.8 |
| A | 6 | 10 | 120468 | 992.18 | 587 | 574 | 120.8 |
| A | 2 | 79 | 8756 | 67.71 | 587 | 574 | 120.8 |
| B | 3 | 112 | 480287 | 4209.3 | 584 | 568 | 114.0 |
| B | 4 | 171 | 65573 | 570.39 | 584 | 568 | 114.0 |
| B | 0 | 230 | 45258 | 392.13 | 584 | 568 | 114.0 |
| C | 15 | 214 | 240576 | 1772.71 | 574 | 576 | 135.4 |
| C | 14 | 254 | 65506 | 479.59 | 574 | 576 | 135.4 |
| C | 9 | 187 | 26990 | 195.1 | 574 | 576 | 135.4 |
| D | 12 | 227 | 1099658 | 8447.07 | 521 | 506 | 130.1 |
| D | 12 | 6 | 260218 | 1995.91 | 521 | 506 | 130.1 |
| D | 2 | 250 | 250817 | 1923.66 | 521 | 506 | 130.1 |
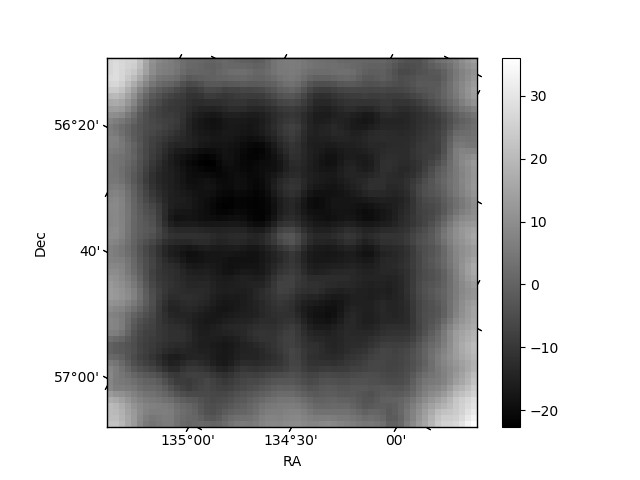
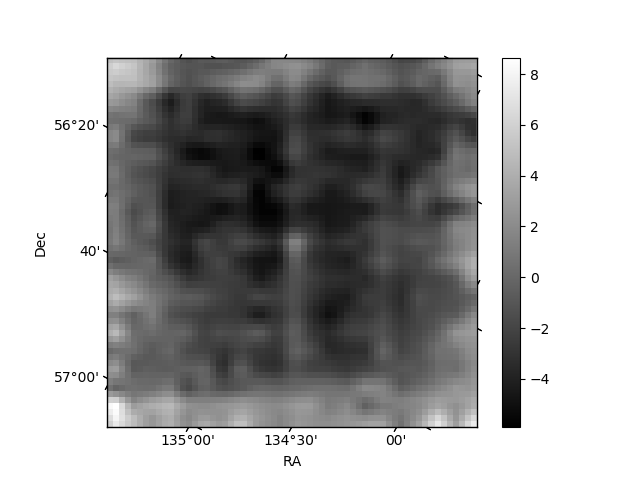
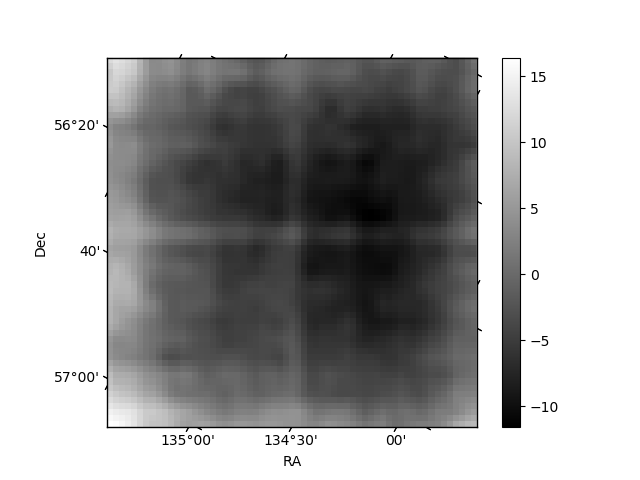
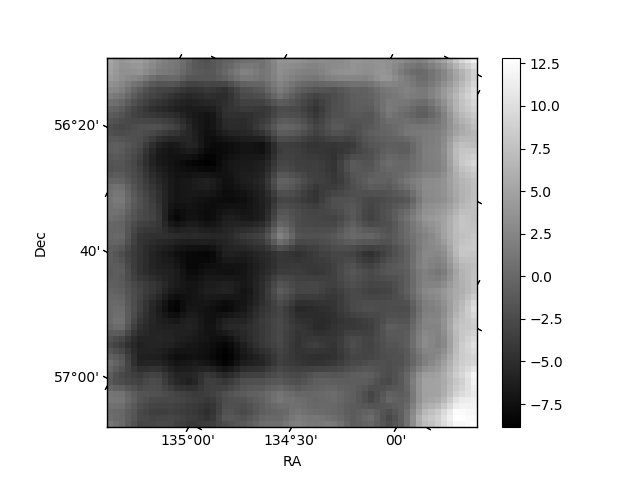
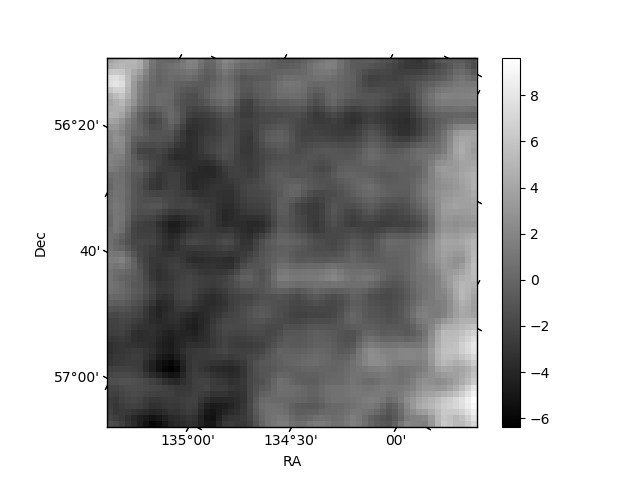
Histogram calculated using DETX and DETY for each event in the final _common_clean file
| Quadrant A | 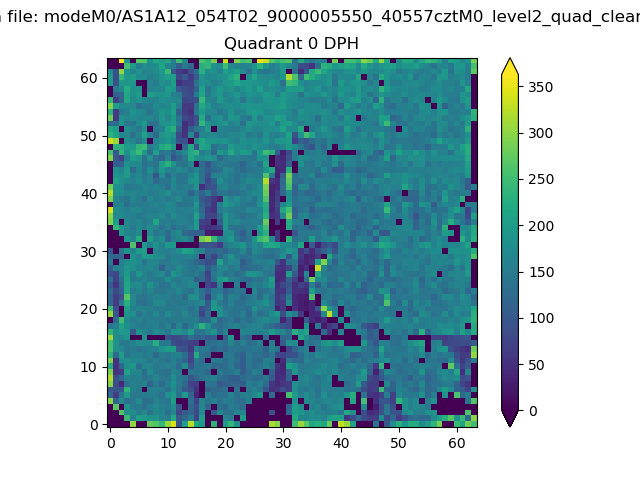 |
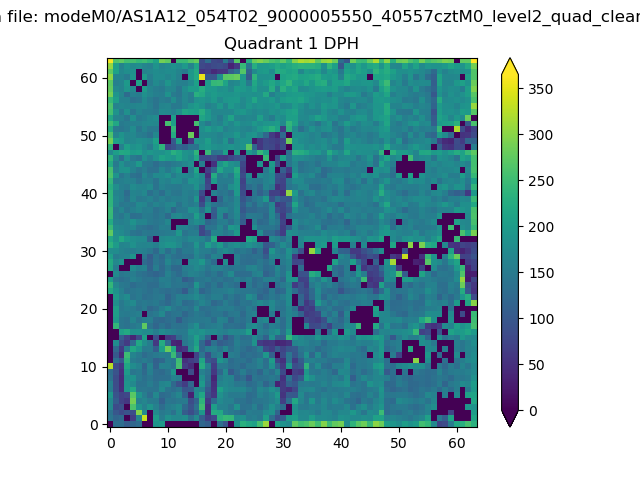 |
Quadrant B |
|---|---|---|---|
| Quadrant D | 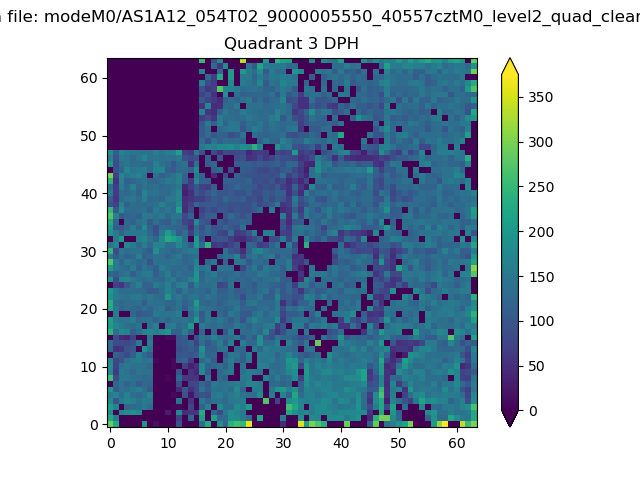 |
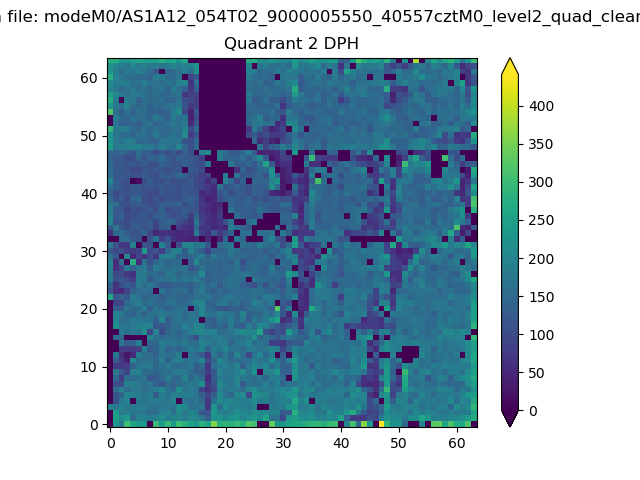 |
Quadrant C |
| Plot type | Count rate plots | Images |
|---|---|---|
| Comparison with Poisson distribution Blue bars denote a histogram of data divided into 1 sec bins. Red curve is a Poisson curve with rate = median count rate of data. |
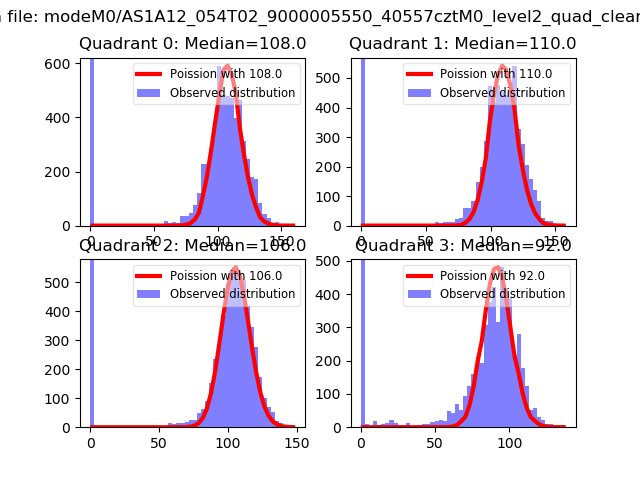 |
 |
| Quadrant-wise count rates Data is divided into 100 sec bins |
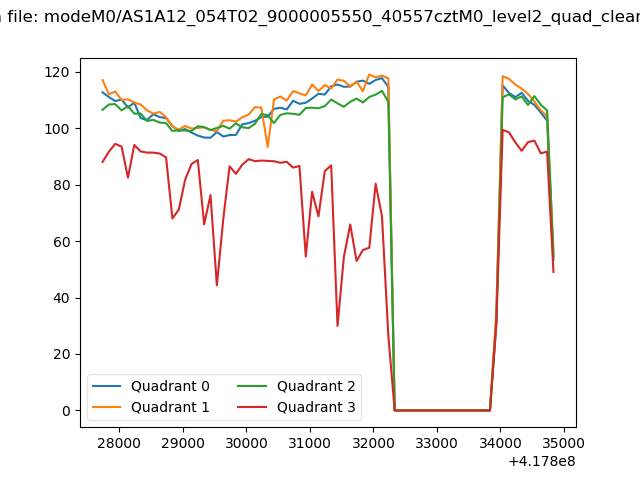 |
|
| Module-wise count rates for Quadrant A Data is divided into 100 sec bins |
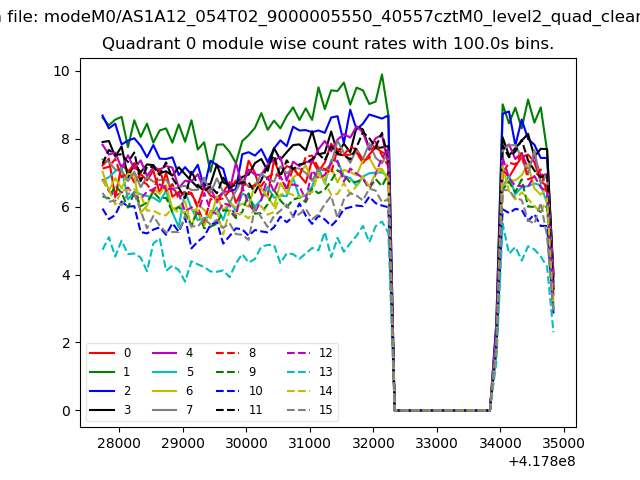 |
 |
| Module-wise count rates for Quadrant B Data is divided into 100 sec bins |
 |
 |
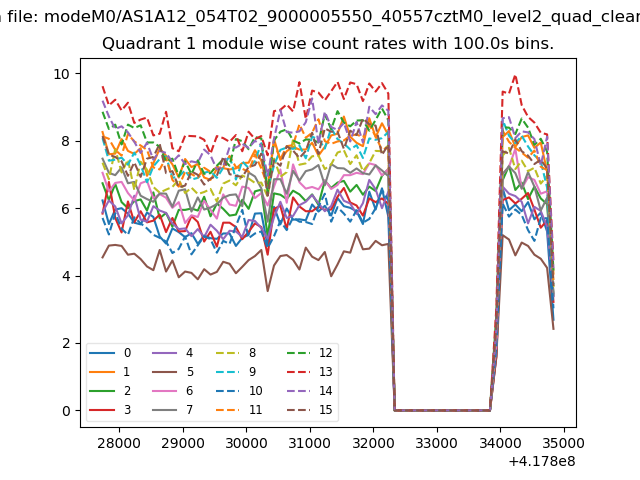
| Module-wise count rates for Quadrant C Data is divided into 100 sec bins |
 |
 |
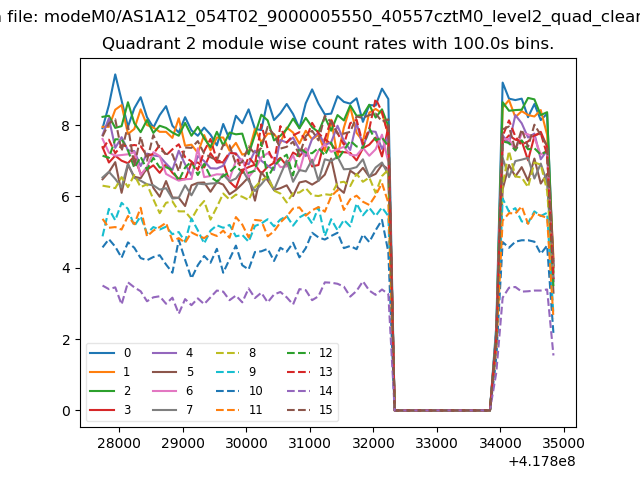
| Module-wise count rates for Quadrant D Data is divided into 100 sec bins |
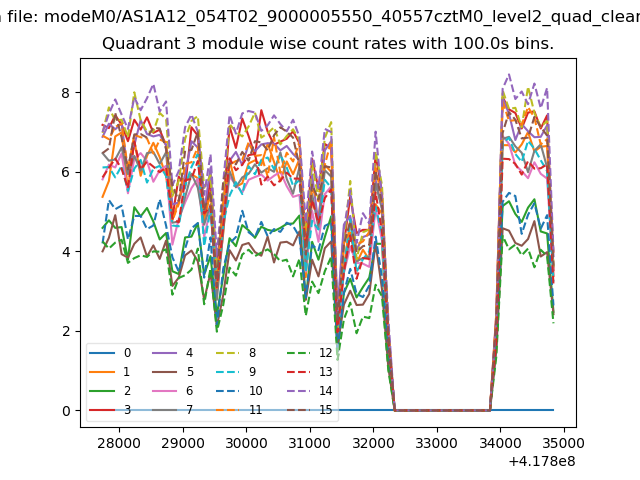 |
 |
| Parameter | Plot |
|---|---|
| CZT HV Monitor | 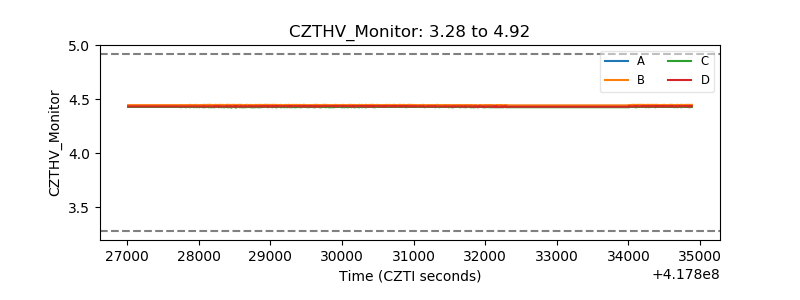 |
| D_VDD | 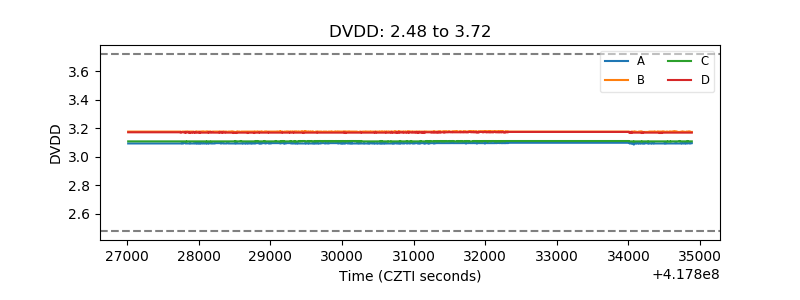 |
| Temperature 1 | 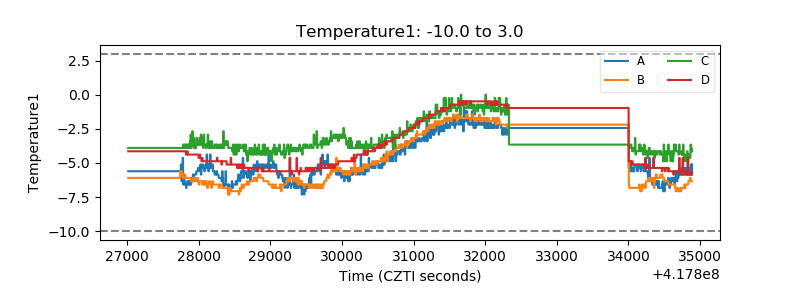 |
| Veto HV Monitor | 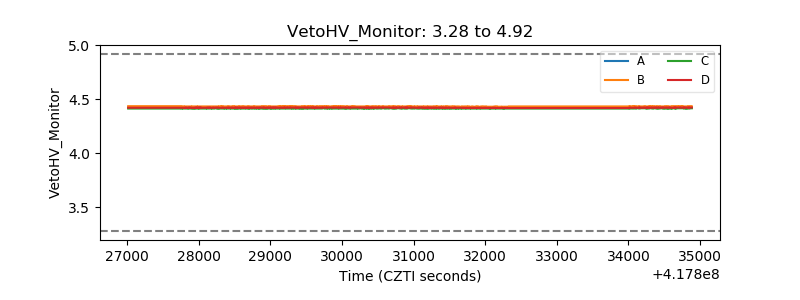 |
| Veto LLD | 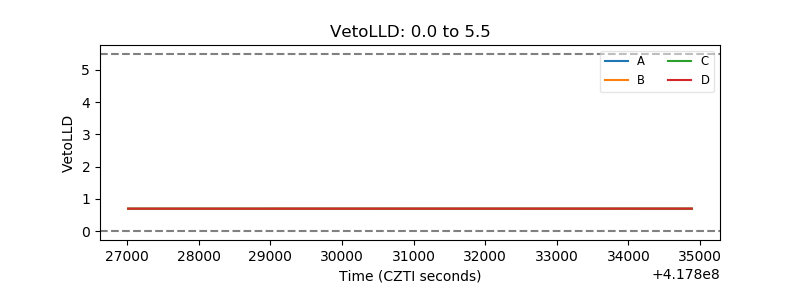 |
| Alpha Counter | 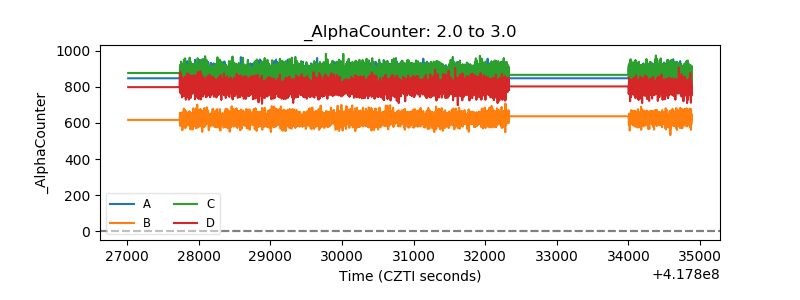 |
| _CPM_Rate | 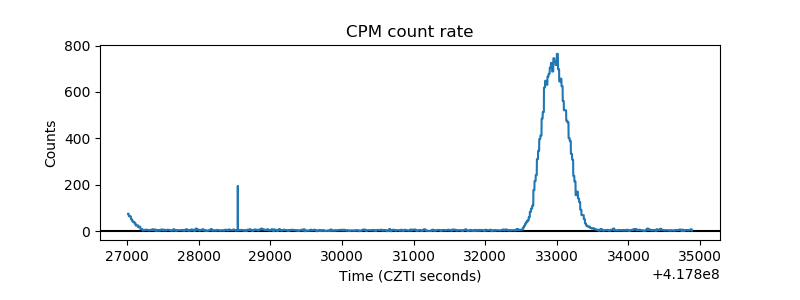 |
| CZT Counter | 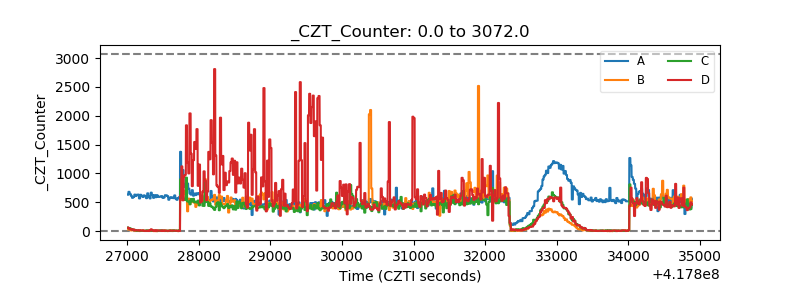 |
| +2.5 Volts monitor | 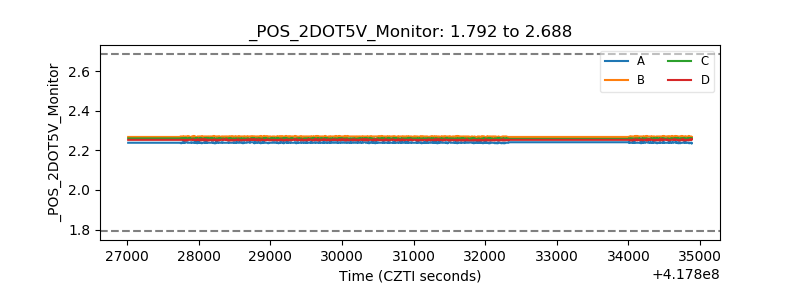 |
| +5 Volts monitor | 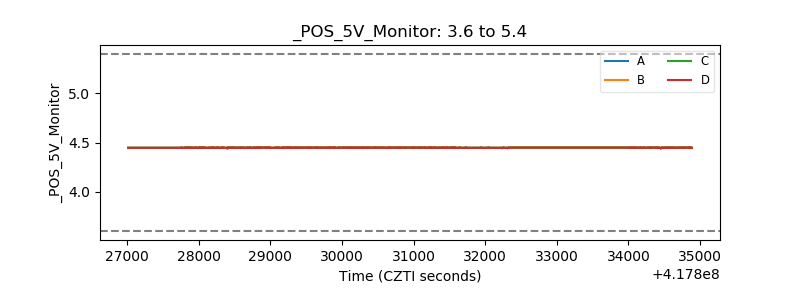 |
| _ROLL_ROT | 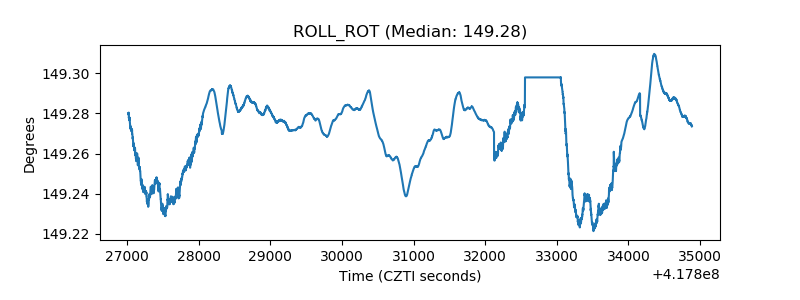 |
| _Roll_DEC | 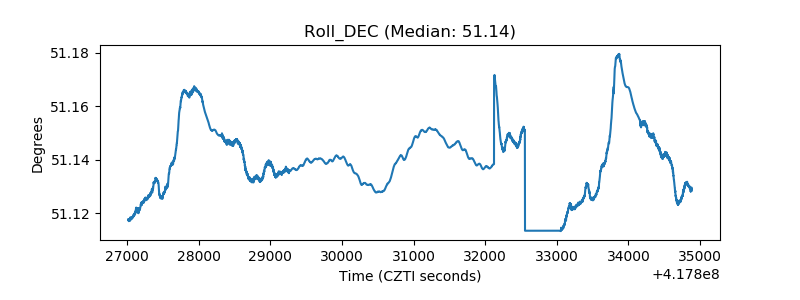 |
| _Roll_RA | 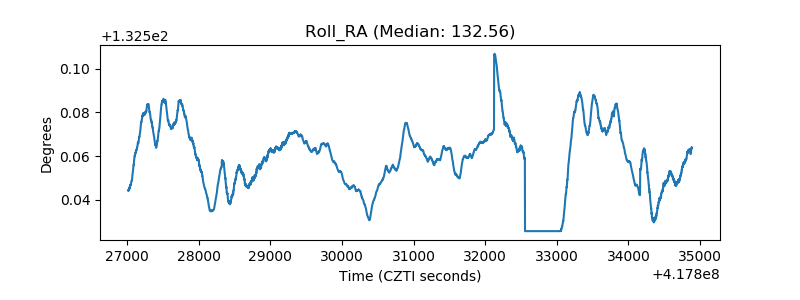 |
| Veto Counter | 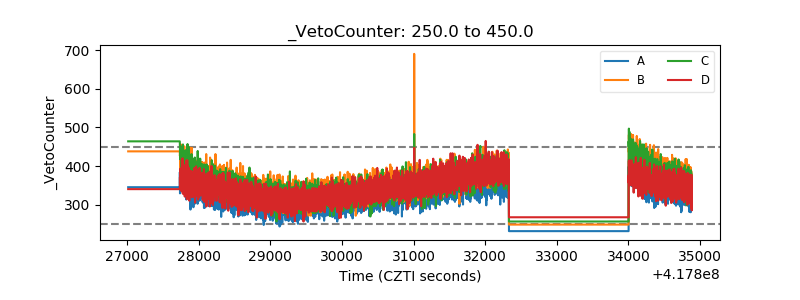 |