| Param | Original file | Final file |
|---|---|---|
| Filename | modeM0/AS1A12_054T02_9000005550_40559cztM0_level2.fits | modeM0/AS1A12_054T02_9000005550_40559cztM0_level2_quad_clean.evt |
| Size (bytes) | 333,146,880 | 89,334,720 |
| Size | 317.7 MB | 85.2 MB |
| Events in quadrant A | 3,016,401 | 617,058 |
| Events in quadrant B | 3,149,321 | 632,785 |
| Events in quadrant C | 2,723,804 | 604,890 |
| Events in quadrant D | 3,005,937 | 458,947 |
| Mode SS | |||
|---|---|---|---|
| Quadrant | BADHDUFLAG | Total packets | Discarded packets |
| A | 0 | 114 | 0 |
| B | 0 | 114 | 0 |
| C | 0 | 114 | 0 |
| D | 0 | 114 | 0 |
| Mode M0 | |||
|---|---|---|---|
| Quadrant | BADHDUFLAG | Total packets | Discarded packets |
| A | 0 | 12312 | 3 |
| B | 0 | 12908 | 2 |
| C | 0 | 11643 | 2 |
| D | 0 | 12786 | 2 |
| Mode M9 | |||
|---|---|---|---|
| Quadrant | BADHDUFLAG | Total packets | Discarded packets |
| A | 0 | 26 | 0 |
| B | 0 | 26 | 0 |
| C | 0 | 26 | 0 |
| D | 0 | 27 | 0 |
| Quadrant | Total seconds | Saturated seconds | Saturation percentage |
|---|---|---|---|
| A | 5591 | 9 | 0.160973% |
| B | 5591 | 20 | 0.357718% |
| C | 5591 | 36 | 0.643892% |
| D | 5591 | 1114 | 19.924879% |
Noise dominated data is calculated using 1-second bins in cleaned event files. If a bin has >2000 counts, and if more than 50% of those come from <1% of pixels, then it is considered to be noise-dominated and hence unusable.
| Quadrant | # 1 sec bins | Bins with >0 counts | Bins with >2000 counts | High rate bins dominated by noise | Noise dominated (total time) | Noise dominated (detector-on time) | Marked lightcurve |
|---|---|---|---|---|---|---|---|
| A | 7353 | 5592 | 4 | 4 | 0.05% | 0.07% | 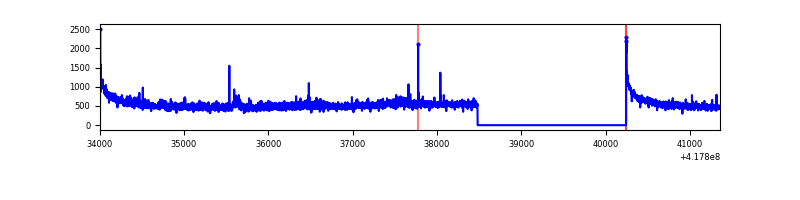 |
| B | 7353 | 5592 | 13 | 13 | 0.18% | 0.23% | 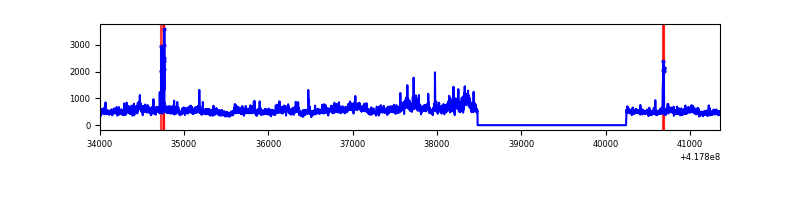 |
| C | 7353 | 5592 | 30 | 30 | 0.41% | 0.54% | 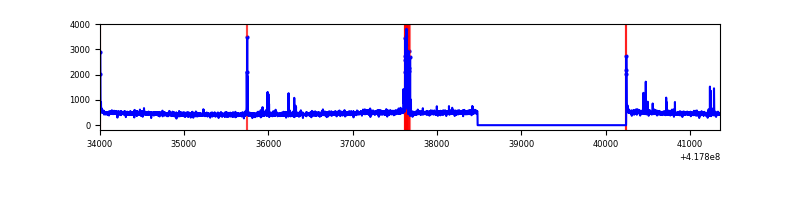 |
| D | 7353 | 5592 | 27 | 27 | 0.37% | 0.48% | 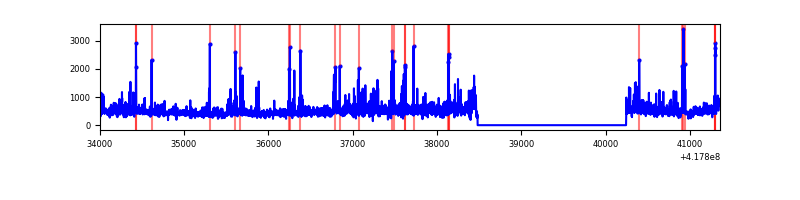 |
Top three noisy pixels from each quadrant. If the there are fewer than three noisy pixels in the level2.evt file, extra rows are filled as -1
| Pixel properties | Quadrant properties | ||||||
|---|---|---|---|---|---|---|---|
| Quadrant | DetID | PixID | Counts | Sigma | Mean | Median | Sigma |
| A | 10 | 83 | 505717 | 4062.24 | 608 | 596 | 124.3 |
| A | 6 | 10 | 90146 | 720.17 | 608 | 596 | 124.3 |
| A | 12 | 189 | 56543 | 449.93 | 608 | 596 | 124.3 |
| B | 3 | 112 | 714304 | 6115.94 | 604 | 588 | 116.7 |
| B | 4 | 170 | 34884 | 293.89 | 604 | 588 | 116.7 |
| B | 12 | 111 | 14945 | 123.03 | 604 | 588 | 116.7 |
| C | 15 | 214 | 244062 | 1749.63 | 590 | 597 | 139.2 |
| C | 14 | 254 | 131520 | 940.86 | 590 | 597 | 139.2 |
| C | 0 | 10 | 21851 | 152.74 | 590 | 597 | 139.2 |
| D | 12 | 191 | 261164 | 1985.42 | 535 | 521 | 131.3 |
| D | 2 | 250 | 197939 | 1503.81 | 535 | 521 | 131.3 |
| D | 12 | 79 | 168945 | 1282.95 | 535 | 521 | 131.3 |
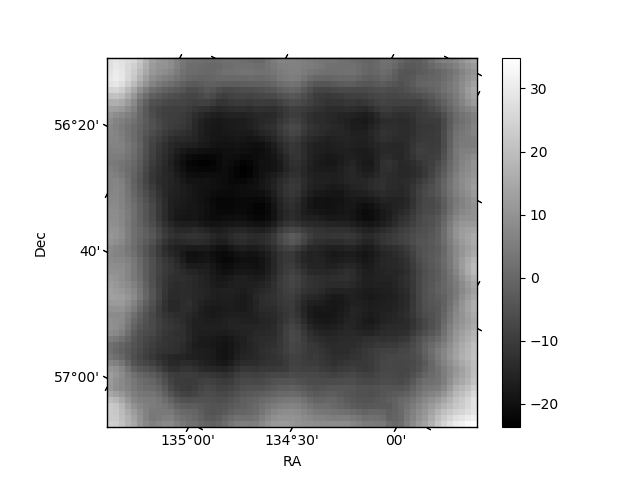
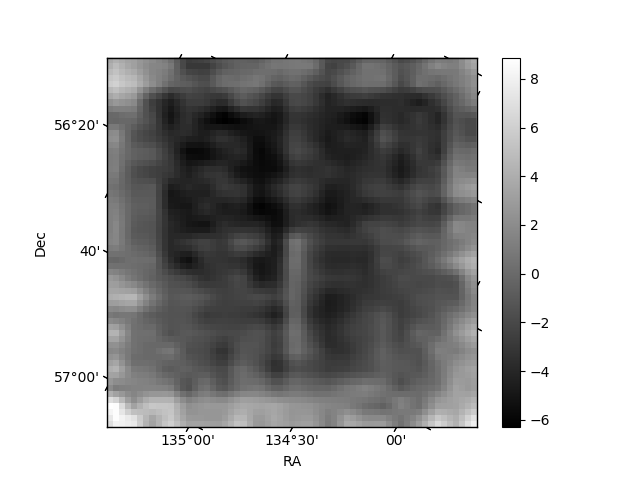
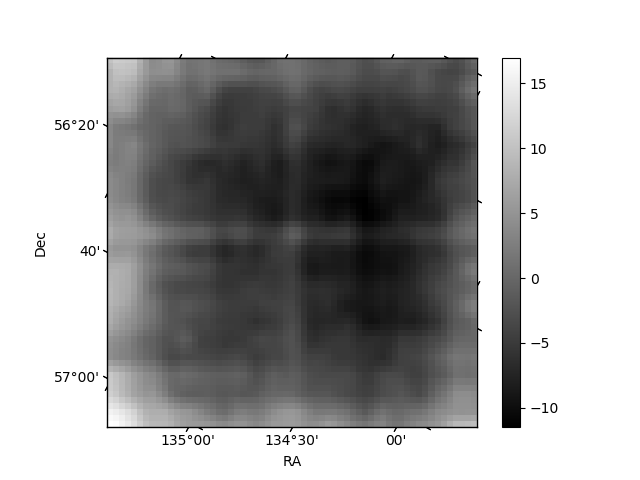
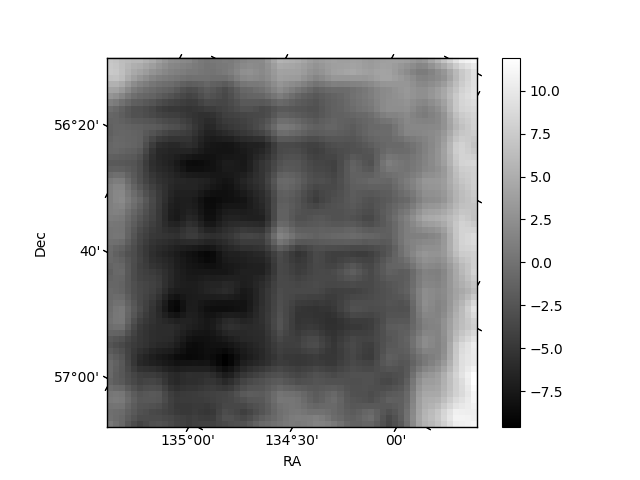
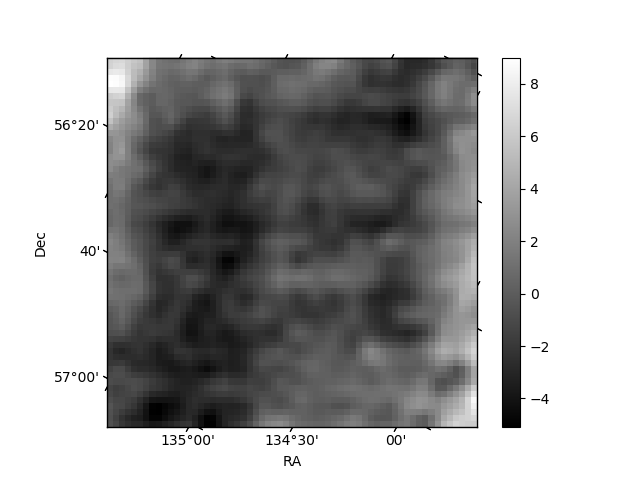
Histogram calculated using DETX and DETY for each event in the final _common_clean file
| Quadrant A | 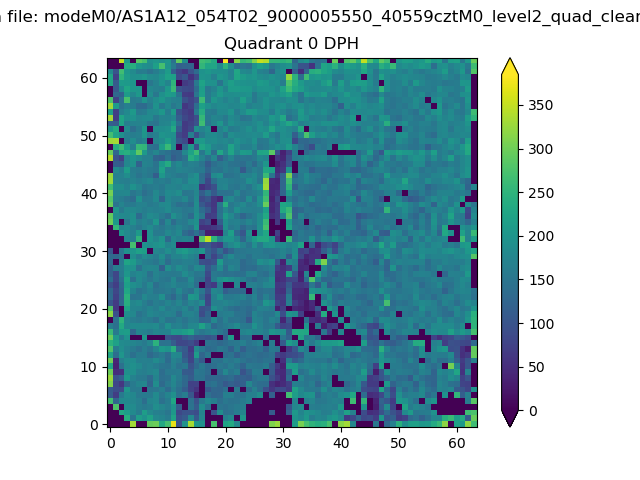 |
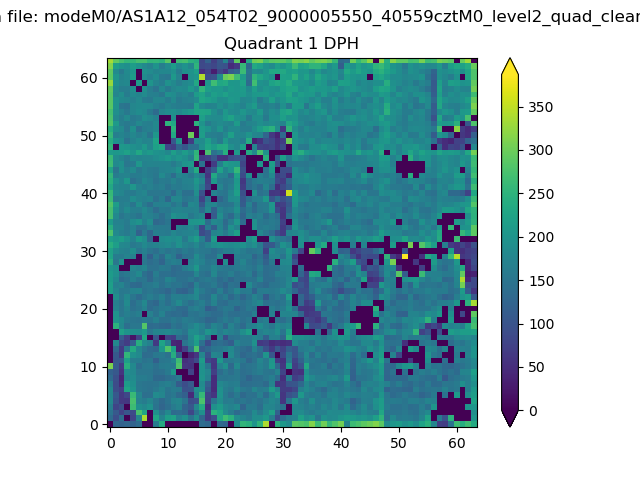 |
Quadrant B |
|---|---|---|---|
| Quadrant D | 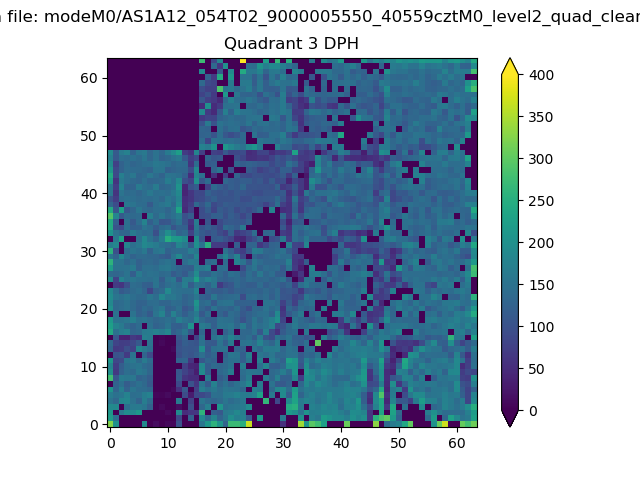 |
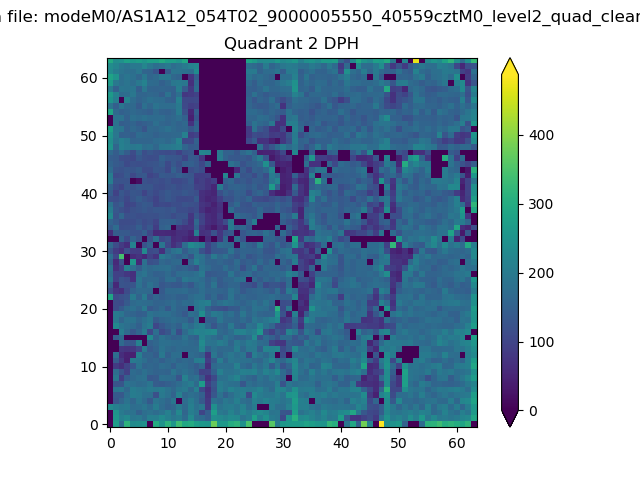 |
Quadrant C |
| Plot type | Count rate plots | Images |
|---|---|---|
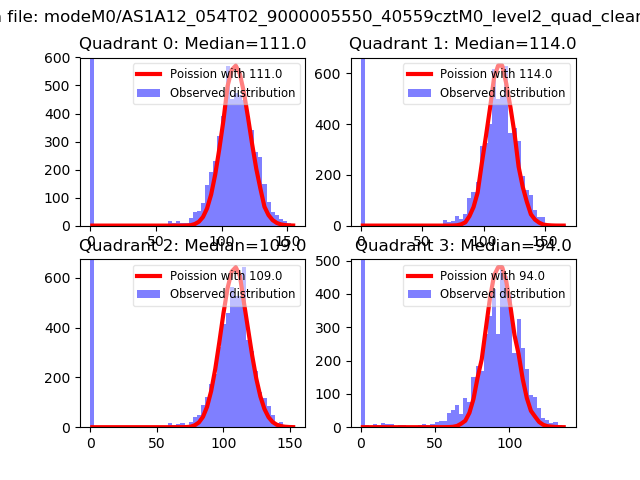
| Comparison with Poisson distribution Blue bars denote a histogram of data divided into 1 sec bins. Red curve is a Poisson curve with rate = median count rate of data. |
 |
 |
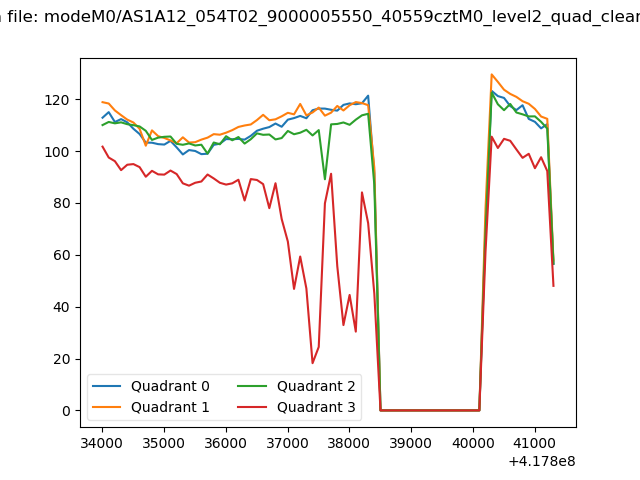
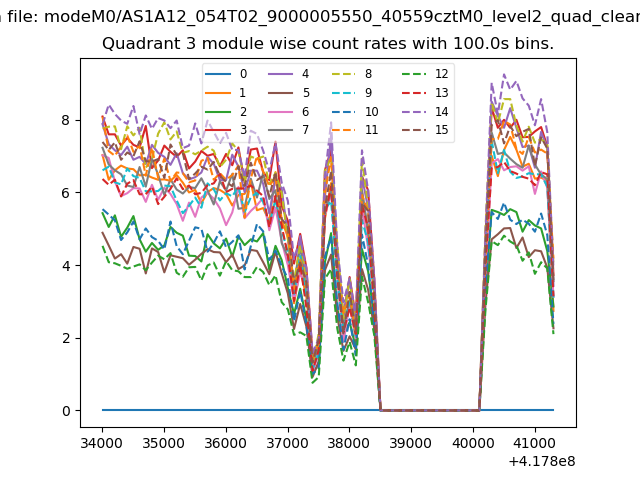
| Quadrant-wise count rates Data is divided into 100 sec bins |
 |
|
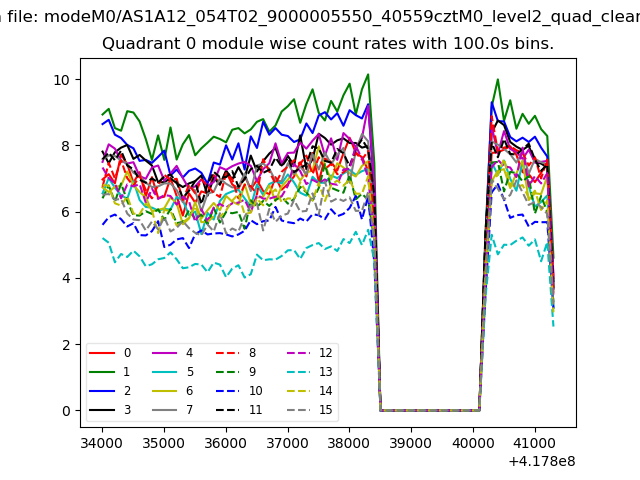
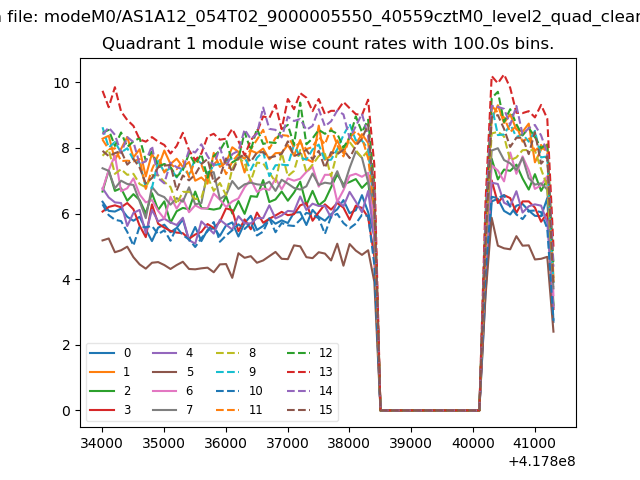
| Module-wise count rates for Quadrant A Data is divided into 100 sec bins |
 |
 |
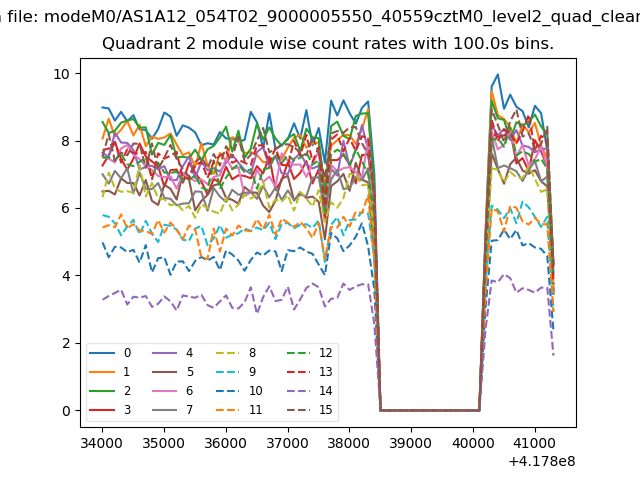
| Module-wise count rates for Quadrant B Data is divided into 100 sec bins |
 |
 |
| Module-wise count rates for Quadrant C Data is divided into 100 sec bins |
 |
 |
| Module-wise count rates for Quadrant D Data is divided into 100 sec bins |
 |
 |
| Parameter | Plot |
|---|---|
| CZT HV Monitor | 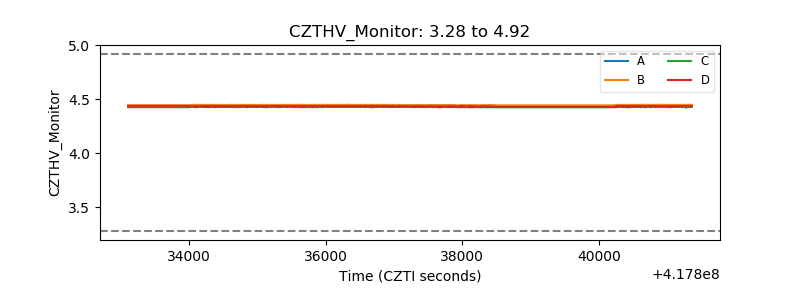 |
| D_VDD | 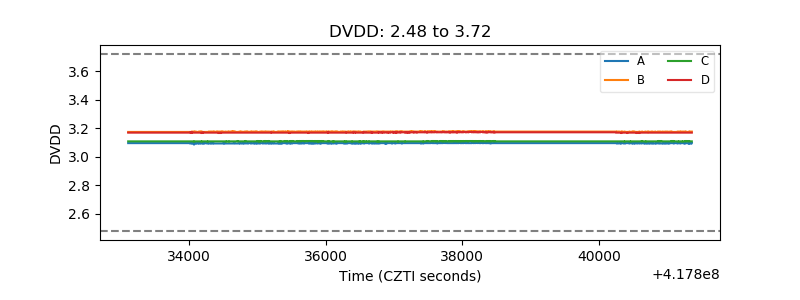 |
| Temperature 1 | 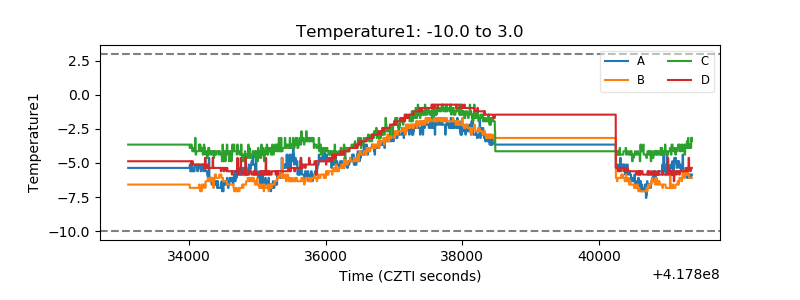 |
| Veto HV Monitor | 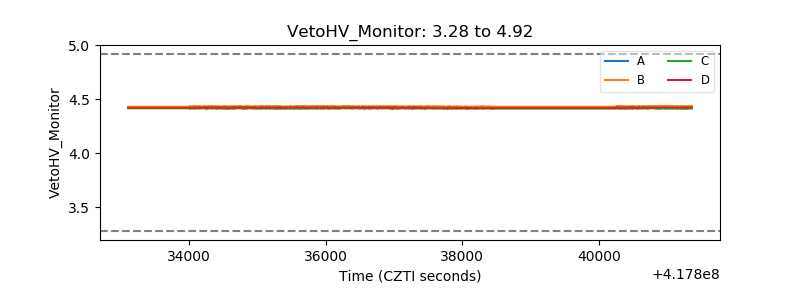 |
| Veto LLD | 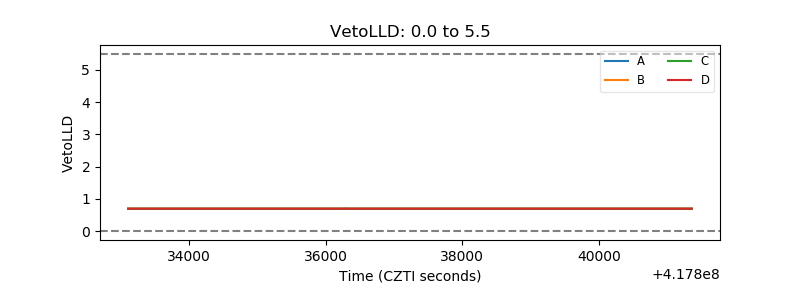 |
| Alpha Counter | 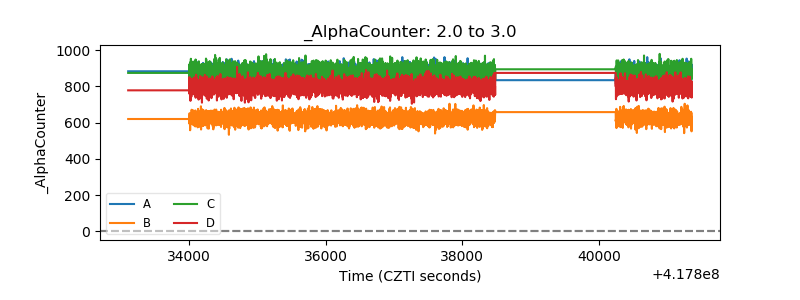 |
| _CPM_Rate | 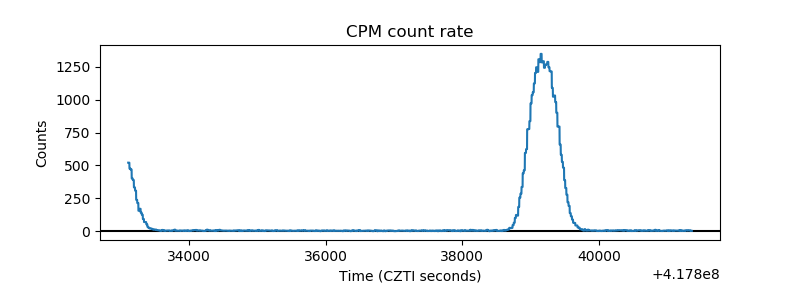 |
| CZT Counter | 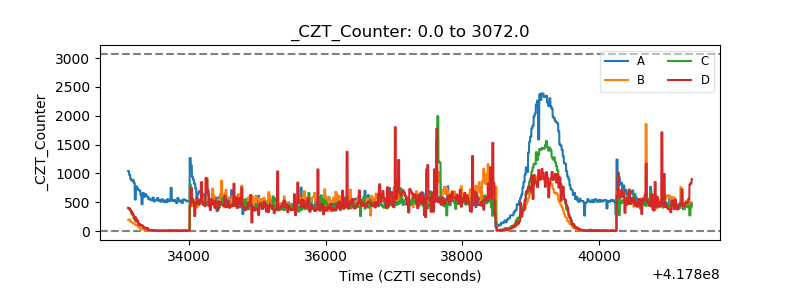 |
| +2.5 Volts monitor | 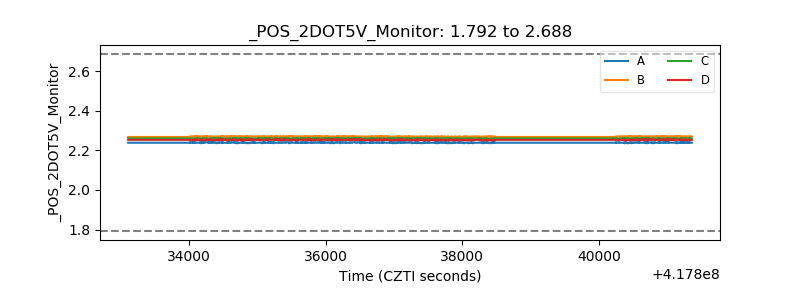 |
| +5 Volts monitor | 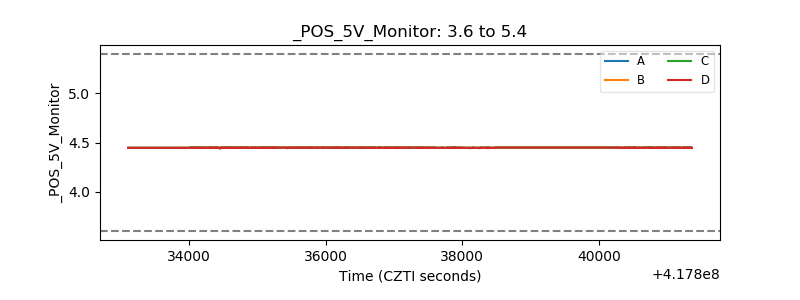 |
| _ROLL_ROT | 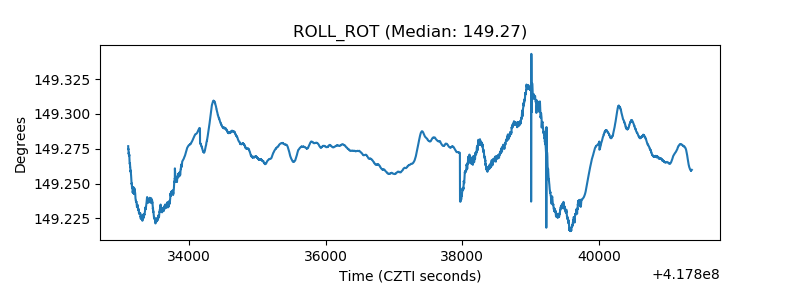 |
| _Roll_DEC | 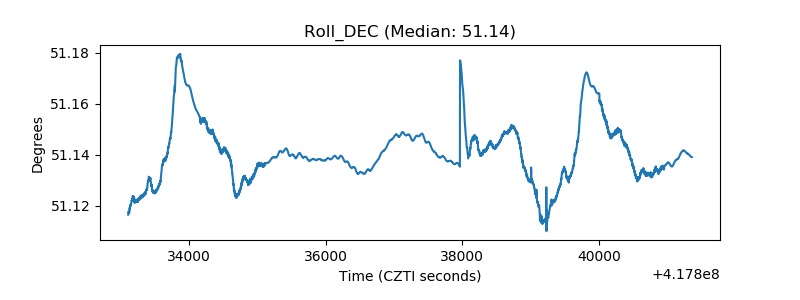 |
| _Roll_RA | 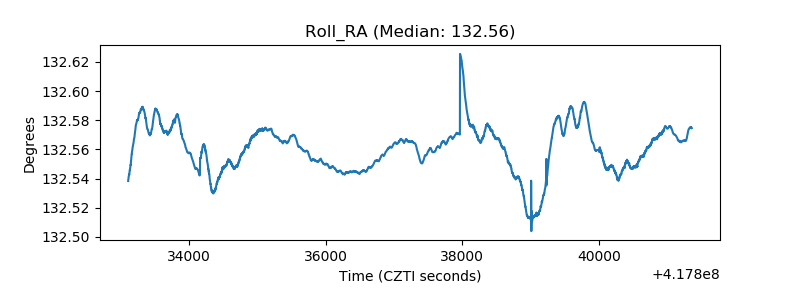 |
| Veto Counter | 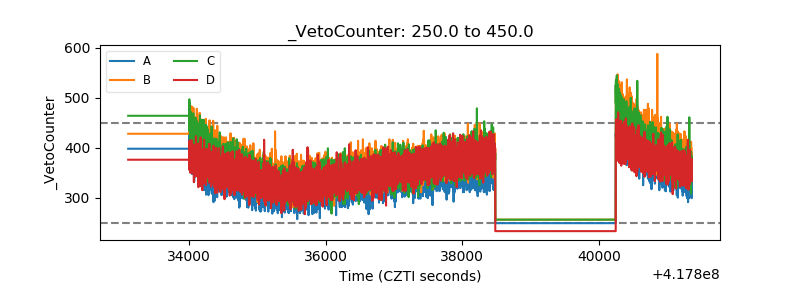 |