| Param | Original file | Final file |
|---|---|---|
| Filename | modeM0/AS1A12_054T02_9000005550_40560cztM0_level2.fits | modeM0/AS1A12_054T02_9000005550_40560cztM0_level2_quad_clean.evt |
| Size (bytes) | 928,016,640 | 228,847,680 |
| Size | 885.0 MB | 218.2 MB |
| Events in quadrant A | 7,682,409 | 1,607,489 |
| Events in quadrant B | 8,908,745 | 1,602,777 |
| Events in quadrant C | 7,087,778 | 1,561,543 |
| Events in quadrant D | 9,543,946 | 1,152,933 |
| Mode SS | |||
|---|---|---|---|
| Quadrant | BADHDUFLAG | Total packets | Discarded packets |
| A | 0 | 296 | 0 |
| B | 0 | 296 | 0 |
| C | 0 | 296 | 0 |
| D | 0 | 296 | 0 |
| Mode M0 | |||
|---|---|---|---|
| Quadrant | BADHDUFLAG | Total packets | Discarded packets |
| A | 0 | 31389 | 5 |
| B | 0 | 36062 | 4 |
| C | 0 | 30358 | 4 |
| D | 0 | 38426 | 4 |
| Mode M9 | |||
|---|---|---|---|
| Quadrant | BADHDUFLAG | Total packets | Discarded packets |
| A | 0 | 61 | 0 |
| B | 0 | 61 | 0 |
| C | 0 | 61 | 0 |
| D | 0 | 62 | 0 |
| Quadrant | Total seconds | Saturated seconds | Saturation percentage |
|---|---|---|---|
| A | 14546 | 21 | 0.144370% |
| B | 14546 | 341 | 2.344287% |
| C | 14546 | 147 | 1.010587% |
| D | 14546 | 3057 | 21.016087% |
Noise dominated data is calculated using 1-second bins in cleaned event files. If a bin has >2000 counts, and if more than 50% of those come from <1% of pixels, then it is considered to be noise-dominated and hence unusable.
| Quadrant | # 1 sec bins | Bins with >0 counts | Bins with >2000 counts | High rate bins dominated by noise | Noise dominated (total time) | Noise dominated (detector-on time) | Marked lightcurve |
|---|---|---|---|---|---|---|---|
| A | 19894 | 14549 | 7 | 7 | 0.04% | 0.05% | 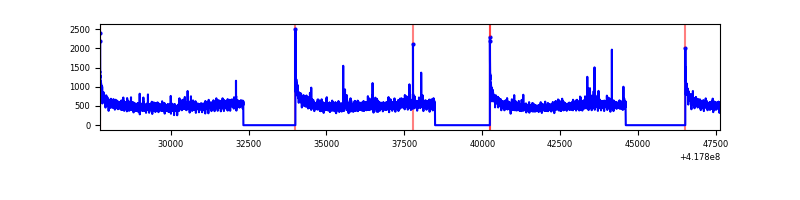 |
| B | 19894 | 14549 | 290 | 290 | 1.46% | 1.99% | 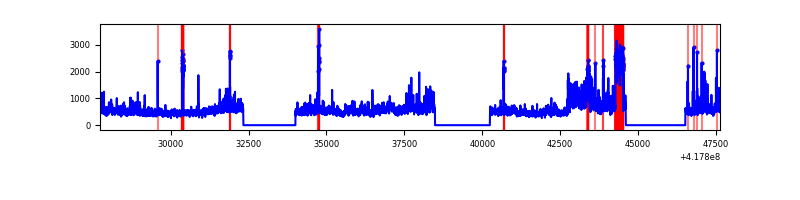 |
| C | 19893 | 14548 | 89 | 89 | 0.45% | 0.61% | 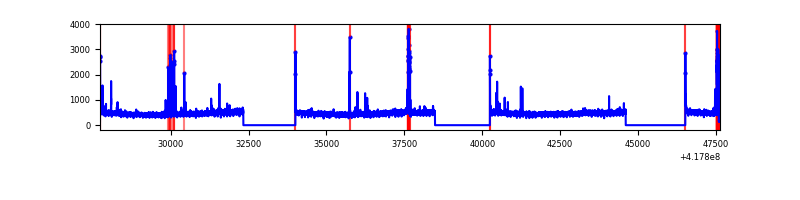 |
| D | 19894 | 14548 | 312 | 312 | 1.57% | 2.14% | 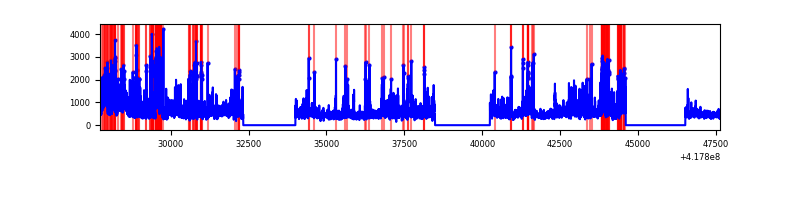 |
Top three noisy pixels from each quadrant. If the there are fewer than three noisy pixels in the level2.evt file, extra rows are filled as -1
| Pixel properties | Quadrant properties | ||||||
|---|---|---|---|---|---|---|---|
| Quadrant | DetID | PixID | Counts | Sigma | Mean | Median | Sigma |
| A | 10 | 83 | 1196208 | 3687.96 | 1596 | 1565 | 323.9 |
| A | 6 | 10 | 184508 | 564.76 | 1596 | 1565 | 323.9 |
| A | 12 | 189 | 99330 | 301.81 | 1596 | 1565 | 323.9 |
| B | 3 | 112 | 1945088 | 6528.3 | 1570 | 1528 | 297.7 |
| B | 7 | 202 | 467395 | 1564.82 | 1570 | 1528 | 297.7 |
| B | 5 | 255 | 79446 | 261.72 | 1570 | 1528 | 297.7 |
| C | 15 | 214 | 626927 | 1744.08 | 1539 | 1544 | 358.6 |
| C | 14 | 254 | 349986 | 971.74 | 1539 | 1544 | 358.6 |
| C | 0 | 10 | 54669 | 148.16 | 1539 | 1544 | 358.6 |
| D | 12 | 227 | 1314339 | 3845.01 | 1395 | 1358 | 341.5 |
| D | 2 | 250 | 1003292 | 2934.12 | 1395 | 1358 | 341.5 |
| D | 12 | 191 | 662907 | 1937.32 | 1395 | 1358 | 341.5 |
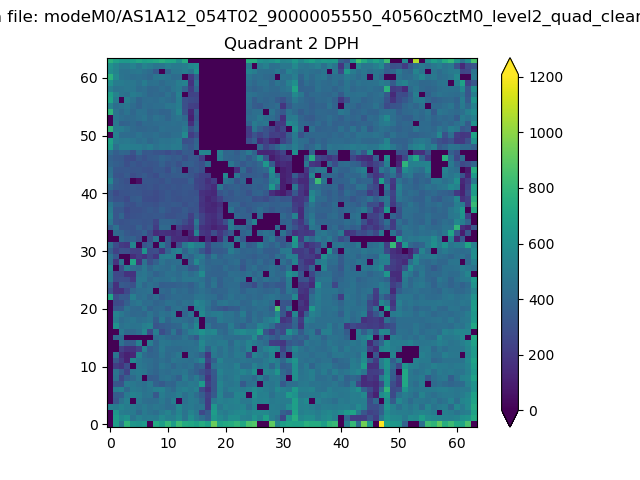
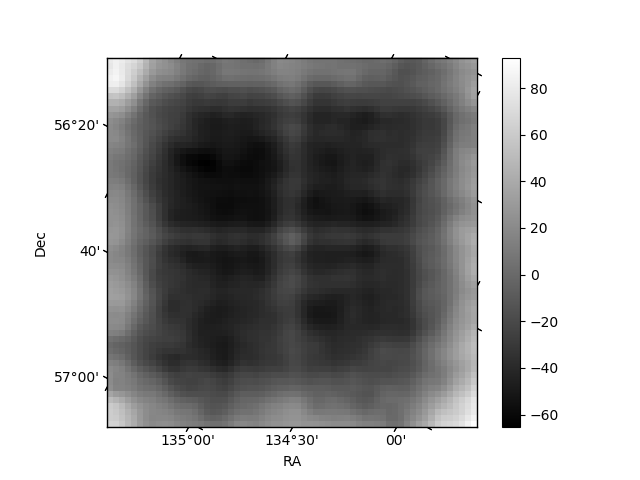
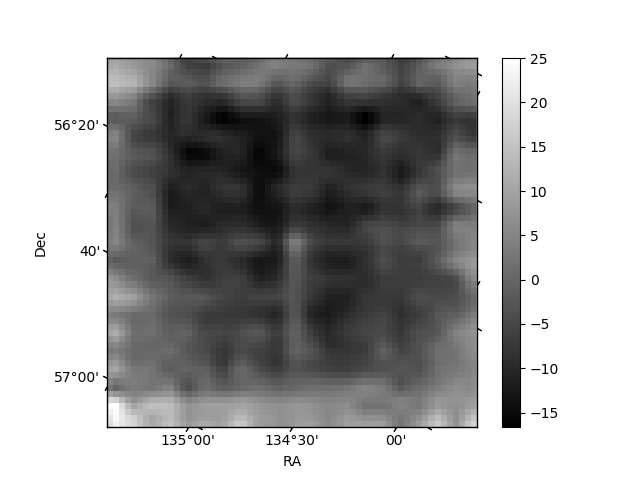
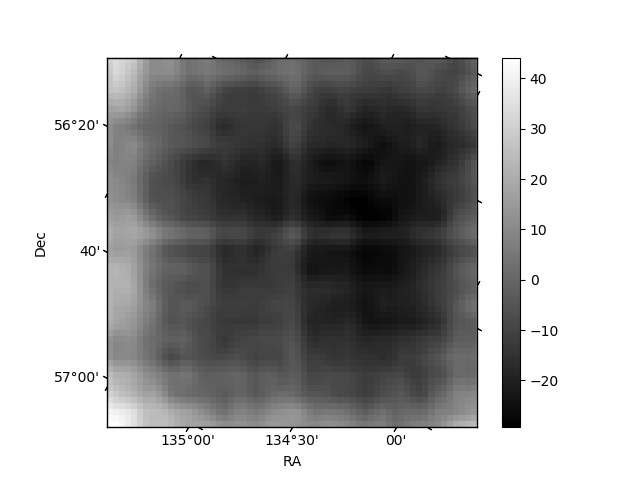
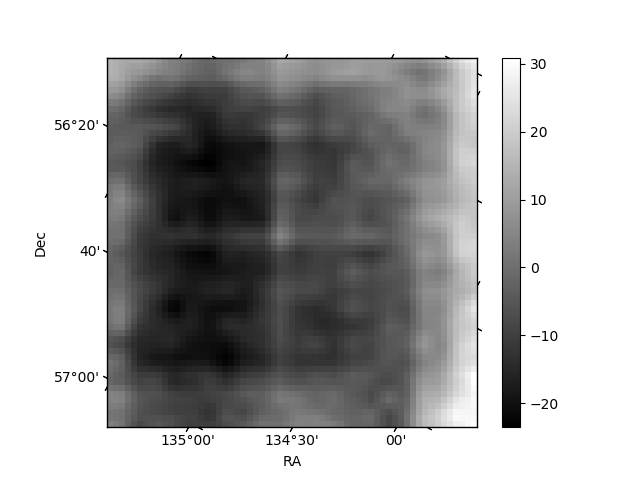
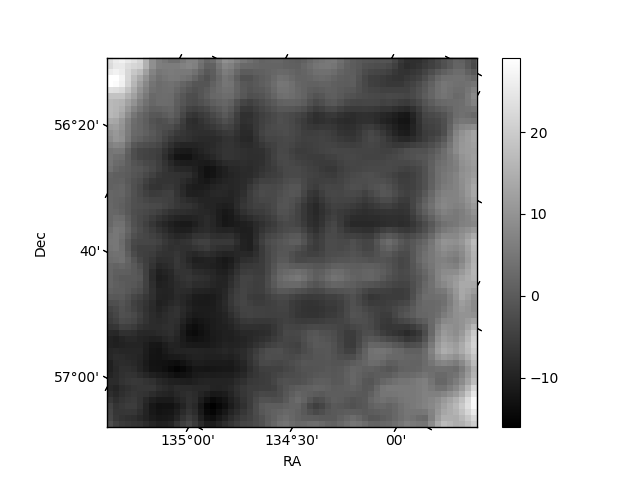
Histogram calculated using DETX and DETY for each event in the final _common_clean file
| Quadrant A |  |
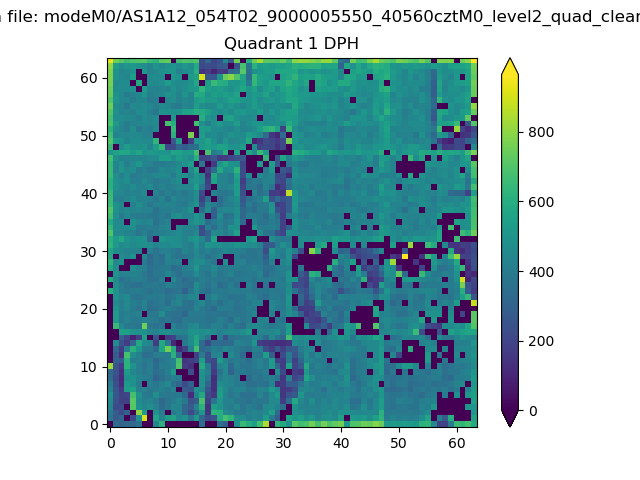 |
Quadrant B |
|---|---|---|---|
| Quadrant D | 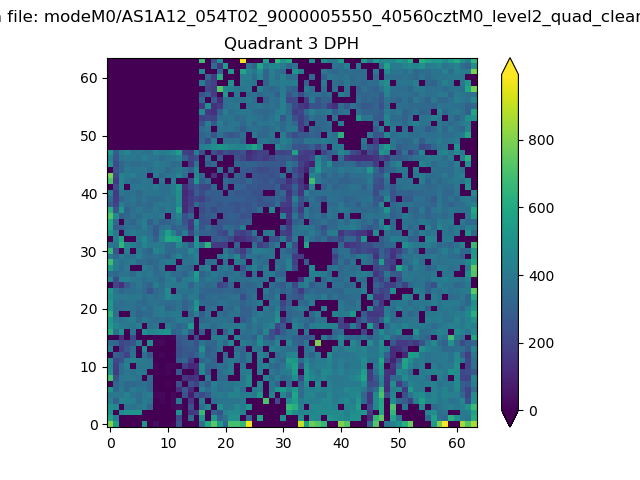 |
 |
Quadrant C |
| Plot type | Count rate plots | Images |
|---|---|---|
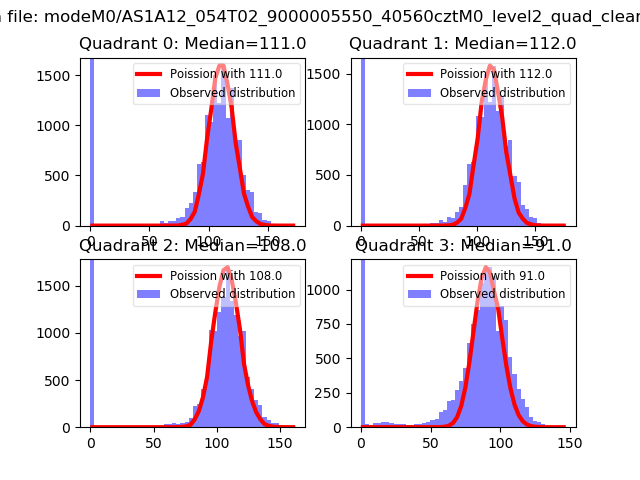
| Comparison with Poisson distribution Blue bars denote a histogram of data divided into 1 sec bins. Red curve is a Poisson curve with rate = median count rate of data. |
 |
 |
| Quadrant-wise count rates Data is divided into 100 sec bins |
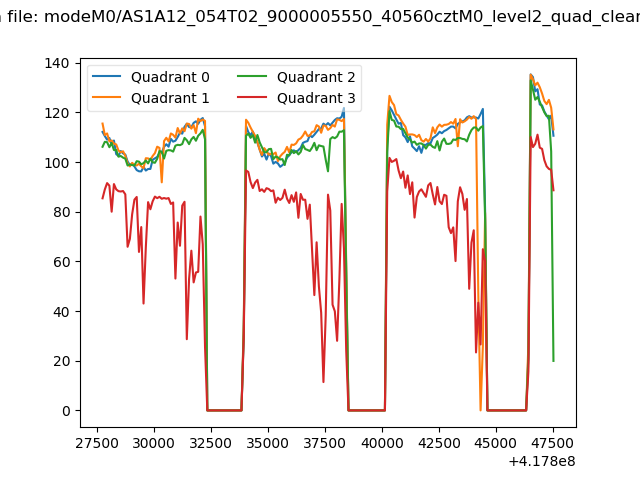 |
|
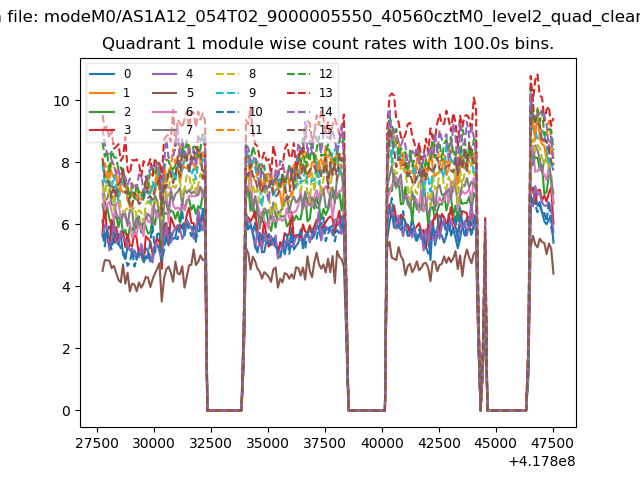
| Module-wise count rates for Quadrant A Data is divided into 100 sec bins |
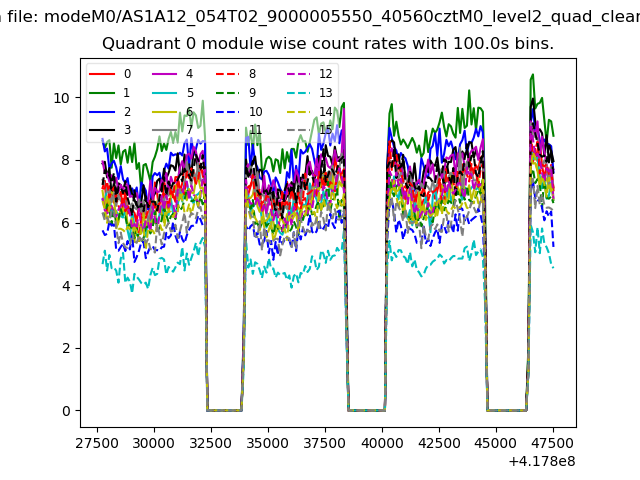 |
 |
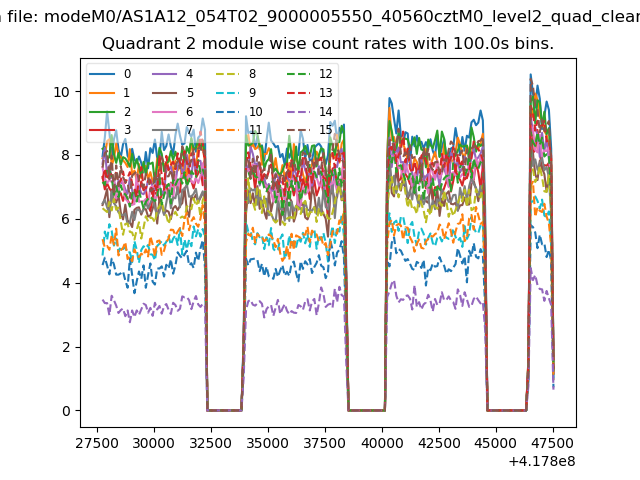
| Module-wise count rates for Quadrant B Data is divided into 100 sec bins |
 |
 |
| Module-wise count rates for Quadrant C Data is divided into 100 sec bins |
 |
 |
| Module-wise count rates for Quadrant D Data is divided into 100 sec bins |
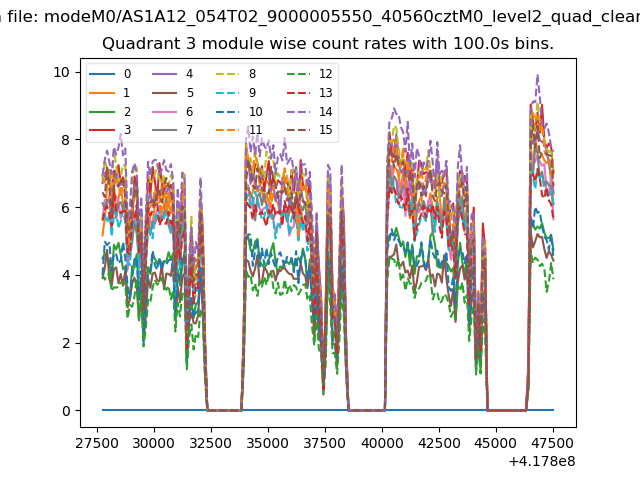 |
 |
| Parameter | Plot |
|---|---|
| CZT HV Monitor | 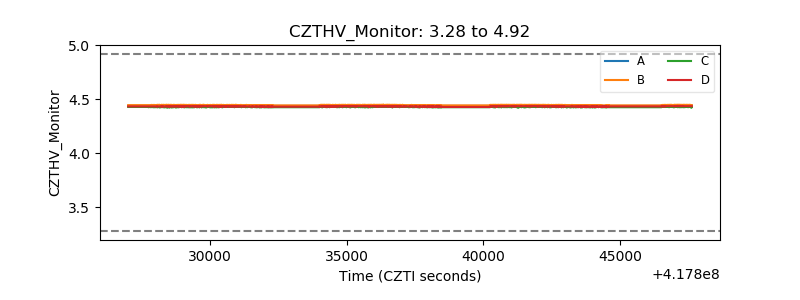 |
| D_VDD | 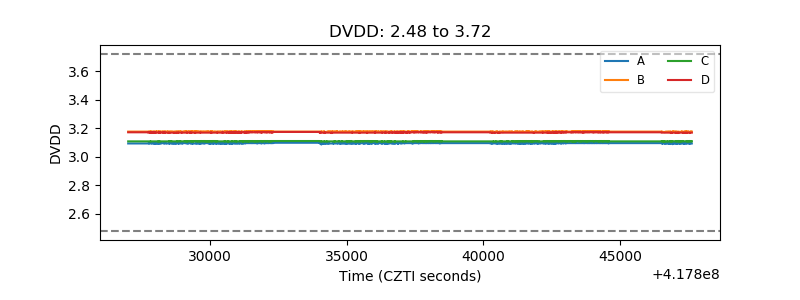 |
| Temperature 1 | 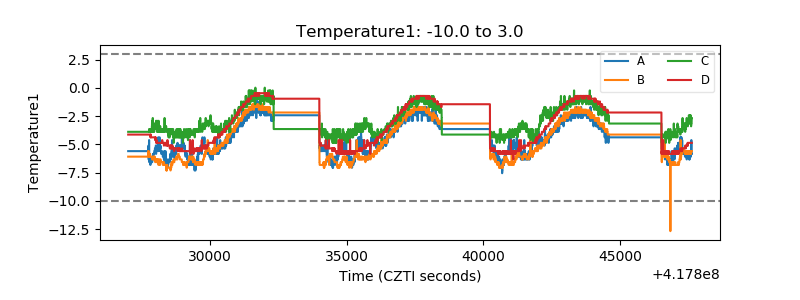 |
| Veto HV Monitor | 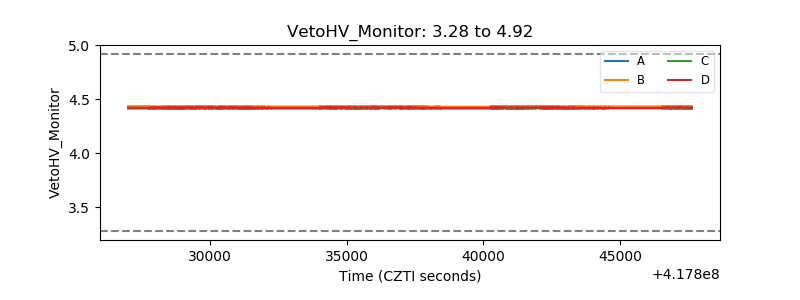 |
| Veto LLD | 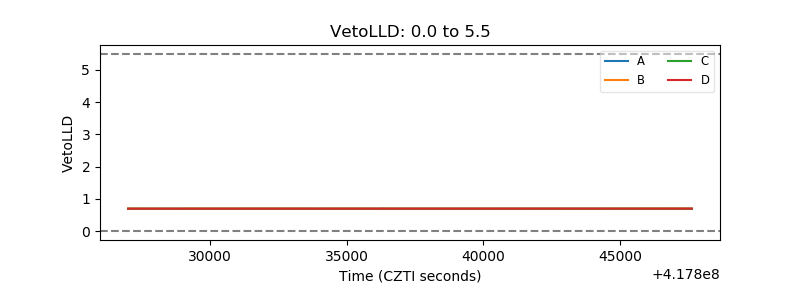 |
| Alpha Counter | 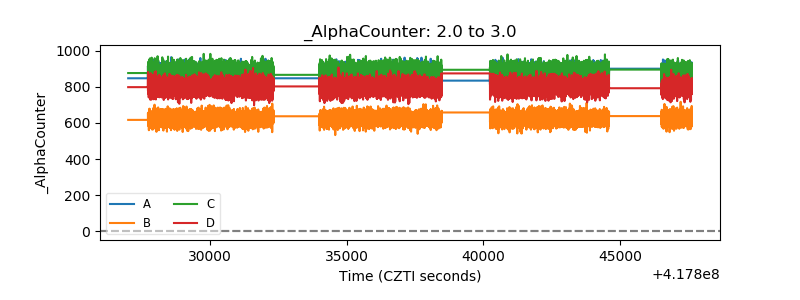 |
| _CPM_Rate | 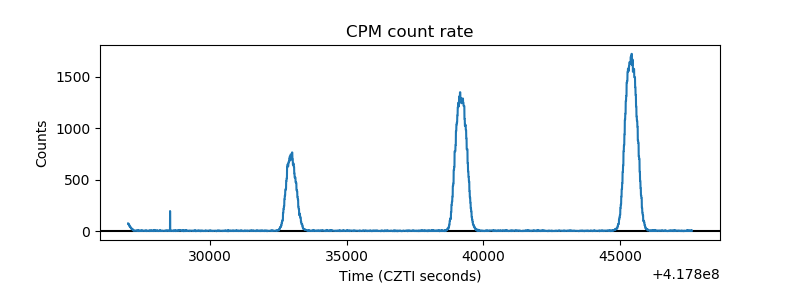 |
| CZT Counter | 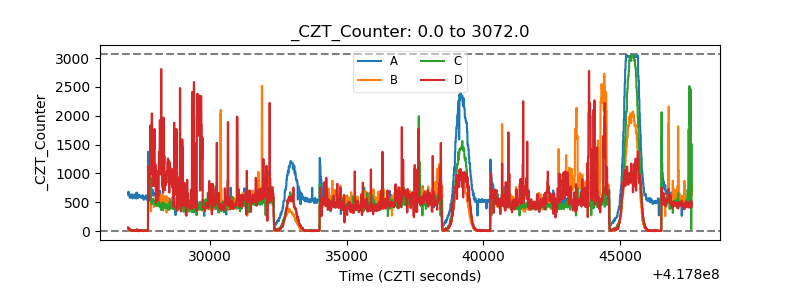 |
| +2.5 Volts monitor | 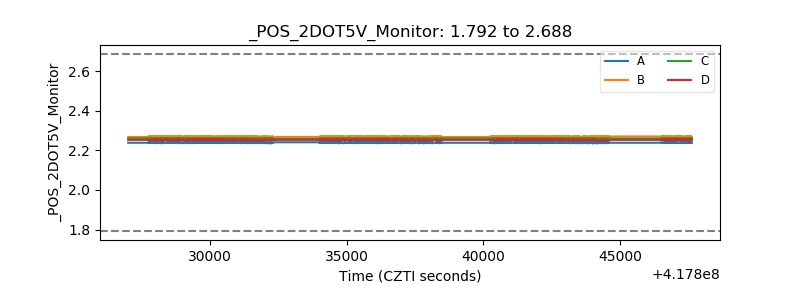 |
| +5 Volts monitor | 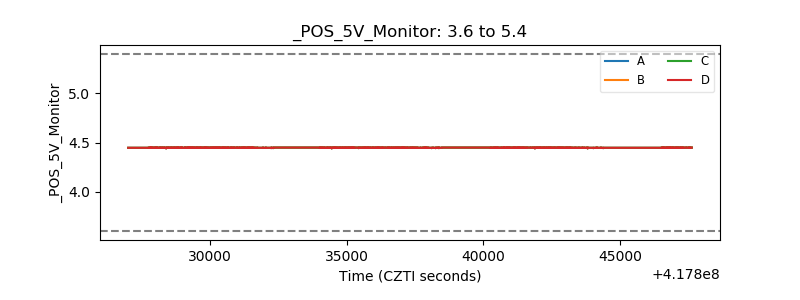 |
| _ROLL_ROT | 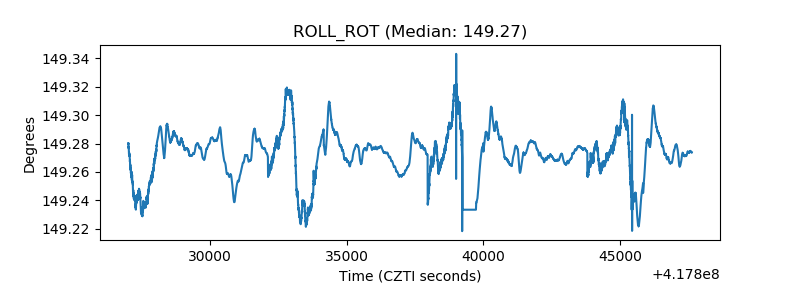 |
| _Roll_DEC | 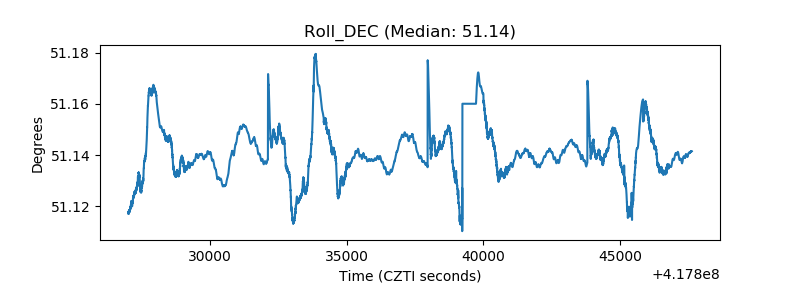 |
| _Roll_RA | 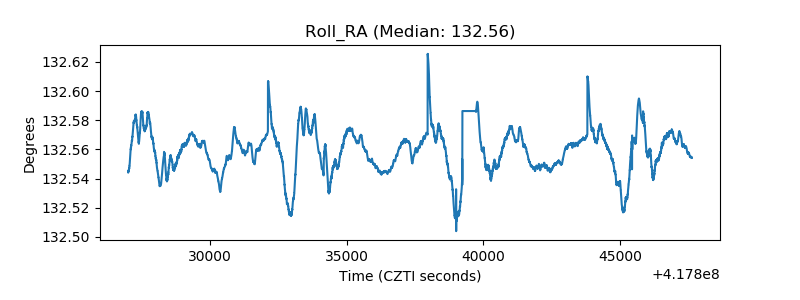 |
| Veto Counter | 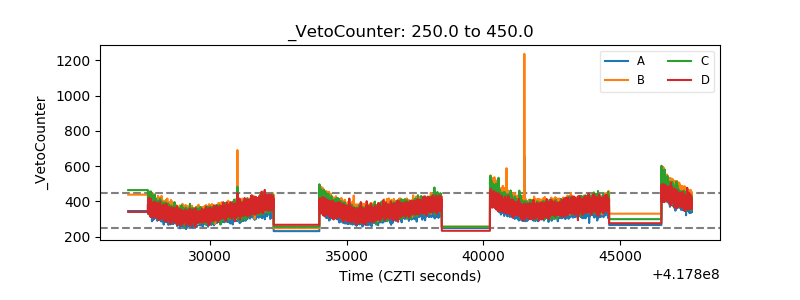 |