| Param | Original file | Final file |
|---|---|---|
| Filename | modeM0/AS1A12_054T02_9000005550_40561cztM0_level2.fits | modeM0/AS1A12_054T02_9000005550_40561cztM0_level2_quad_clean.evt |
| Size (bytes) | 358,871,040 | 84,153,600 |
| Size | 342.2 MB | 80.3 MB |
| Events in quadrant A | 2,818,461 | 618,311 |
| Events in quadrant B | 4,865,407 | 590,256 |
| Events in quadrant C | 2,756,230 | 574,139 |
| Events in quadrant D | 2,450,903 | 412,908 |
| Mode SS | |||
|---|---|---|---|
| Quadrant | BADHDUFLAG | Total packets | Discarded packets |
| A | 0 | 102 | 0 |
| B | 0 | 102 | 0 |
| C | 0 | 102 | 0 |
| D | 0 | 102 | 0 |
| Mode M0 | |||
|---|---|---|---|
| Quadrant | BADHDUFLAG | Total packets | Discarded packets |
| A | 0 | 11281 | 3 |
| B | 0 | 17860 | 2 |
| C | 0 | 11134 | 2 |
| D | 0 | 10734 | 2 |
| Mode M9 | |||
|---|---|---|---|
| Quadrant | BADHDUFLAG | Total packets | Discarded packets |
| A | 0 | 32 | 0 |
| B | 0 | 32 | 0 |
| C | 0 | 32 | 0 |
| D | 0 | 33 | 0 |
| Quadrant | Total seconds | Saturated seconds | Saturation percentage |
|---|---|---|---|
| A | 5031 | 13 | 0.258398% |
| B | 5031 | 473 | 9.401709% |
| C | 5031 | 188 | 3.736832% |
| D | 5031 | 1327 | 26.376466% |
Noise dominated data is calculated using 1-second bins in cleaned event files. If a bin has >2000 counts, and if more than 50% of those come from <1% of pixels, then it is considered to be noise-dominated and hence unusable.
| Quadrant | # 1 sec bins | Bins with >0 counts | Bins with >2000 counts | High rate bins dominated by noise | Noise dominated (total time) | Noise dominated (detector-on time) | Marked lightcurve |
|---|---|---|---|---|---|---|---|
| A | 7064 | 5032 | 3 | 3 | 0.04% | 0.06% | 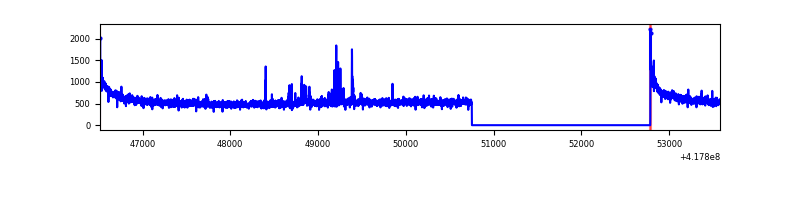 |
| B | 7064 | 5032 | 393 | 393 | 5.56% | 7.81% | 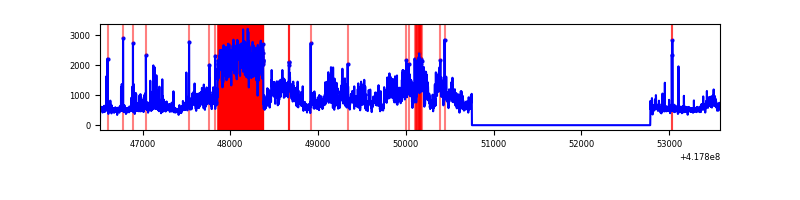 |
| C | 7064 | 5032 | 93 | 93 | 1.32% | 1.85% | 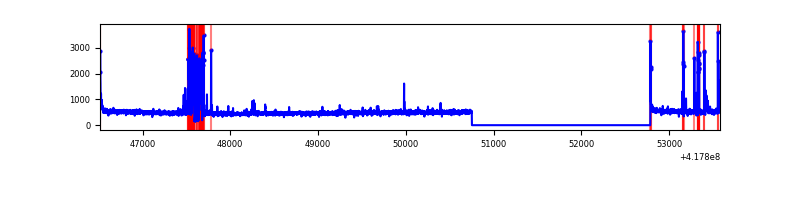 |
| D | 7064 | 5031 | 9 | 9 | 0.13% | 0.18% | 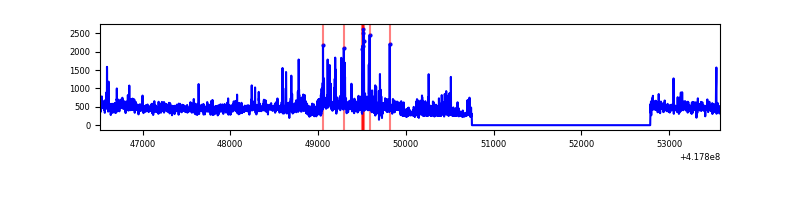 |
Top three noisy pixels from each quadrant. If the there are fewer than three noisy pixels in the level2.evt file, extra rows are filled as -1
| Pixel properties | Quadrant properties | ||||||
|---|---|---|---|---|---|---|---|
| Quadrant | DetID | PixID | Counts | Sigma | Mean | Median | Sigma |
| A | 10 | 83 | 470777 | 3913.38 | 589 | 579 | 120.2 |
| A | 12 | 189 | 65435 | 539.79 | 589 | 579 | 120.2 |
| A | 13 | 254 | 6200 | 46.78 | 589 | 579 | 120.2 |
| B | 3 | 112 | 1671326 | 15537.65 | 571 | 557 | 107.5 |
| B | 7 | 202 | 795685 | 7394.45 | 571 | 557 | 107.5 |
| B | 5 | 255 | 104622 | 967.77 | 571 | 557 | 107.5 |
| C | 14 | 254 | 355771 | 2786.16 | 550 | 553 | 127.5 |
| C | 15 | 214 | 217424 | 1701.03 | 550 | 553 | 127.5 |
| C | 0 | 10 | 30010 | 231.05 | 550 | 553 | 127.5 |
| D | 12 | 191 | 310472 | 2707.12 | 463 | 451 | 114.5 |
| D | 12 | 227 | 95358 | 828.73 | 463 | 451 | 114.5 |
| D | 12 | 79 | 77007 | 668.49 | 463 | 451 | 114.5 |
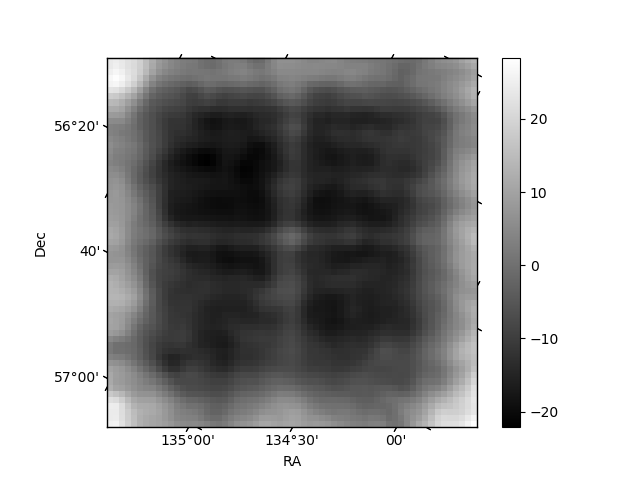
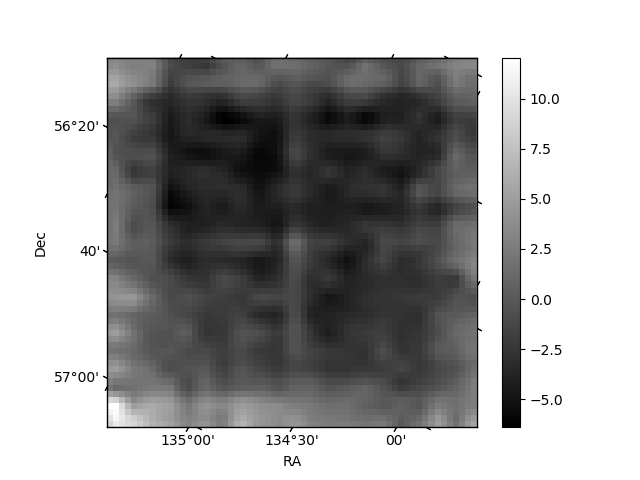
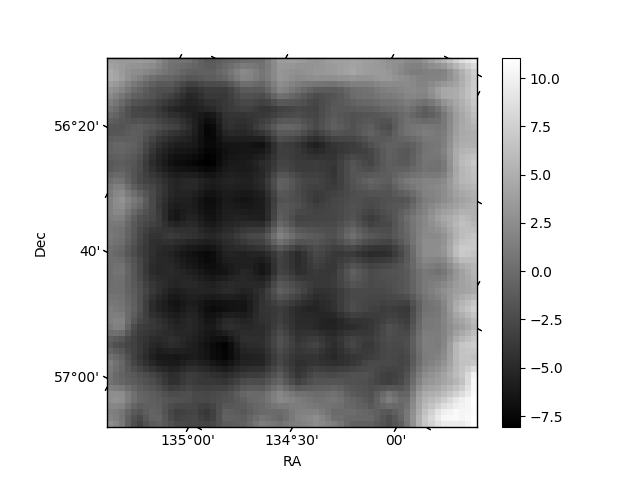
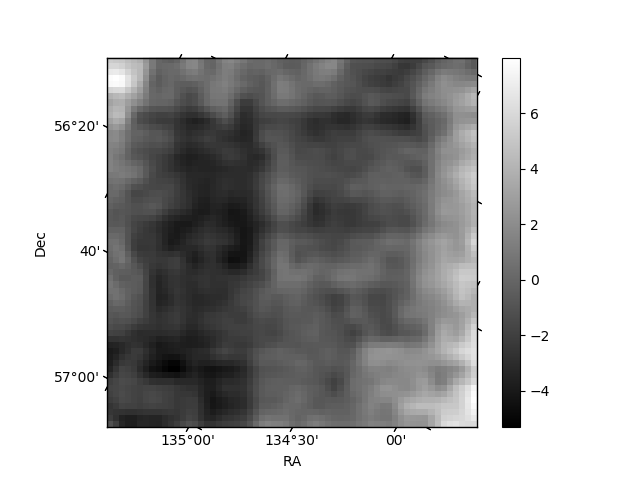
Histogram calculated using DETX and DETY for each event in the final _common_clean file
| Quadrant A | 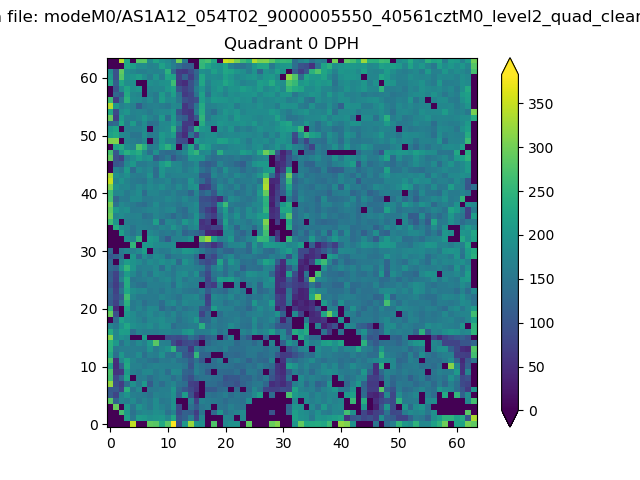 |
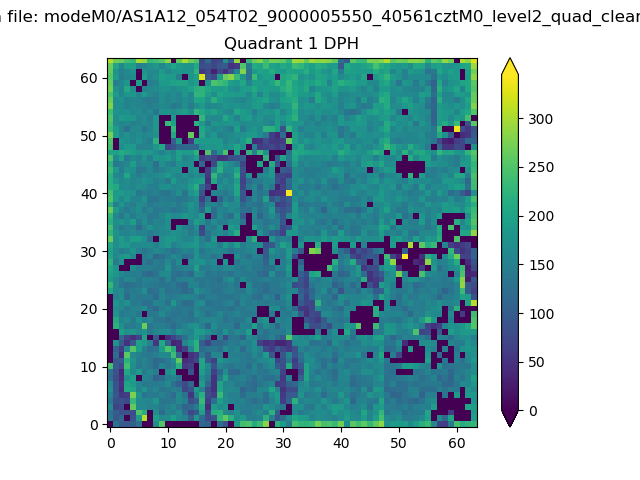 |
Quadrant B |
|---|---|---|---|
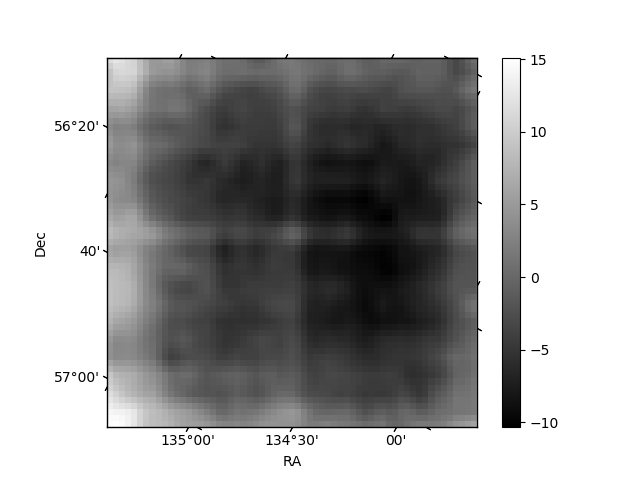
| Quadrant D | 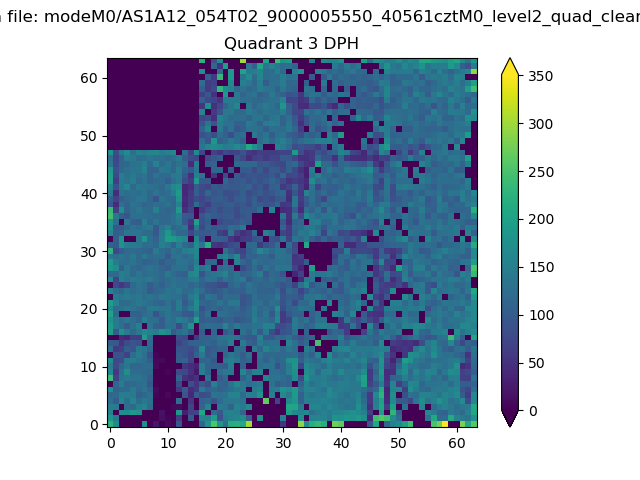 |
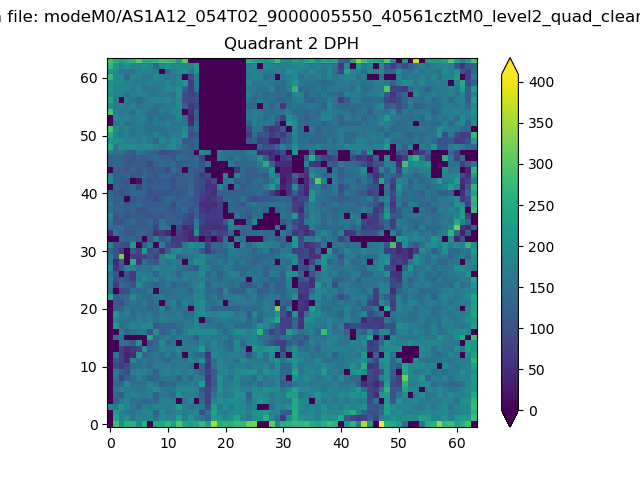 |
Quadrant C |
| Plot type | Count rate plots | Images |
|---|---|---|
| Comparison with Poisson distribution Blue bars denote a histogram of data divided into 1 sec bins. Red curve is a Poisson curve with rate = median count rate of data. |
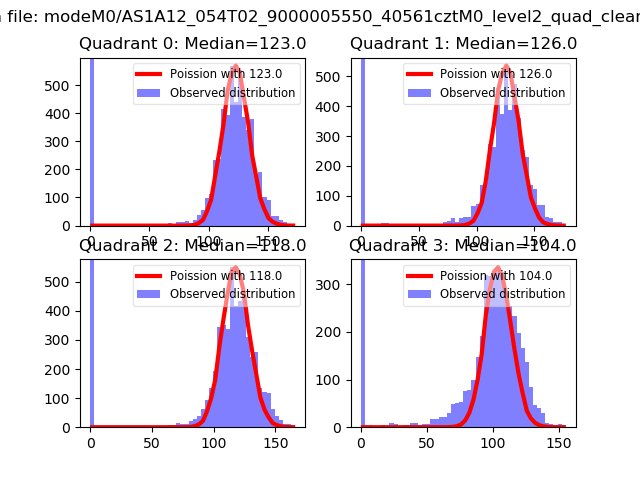 |
 |
| Quadrant-wise count rates Data is divided into 100 sec bins |
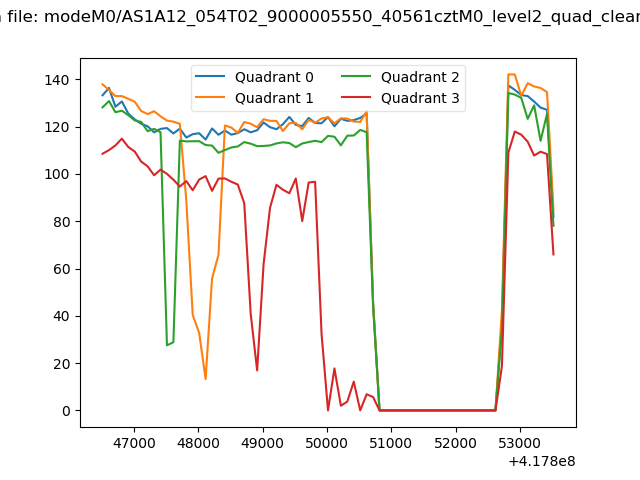 |
|
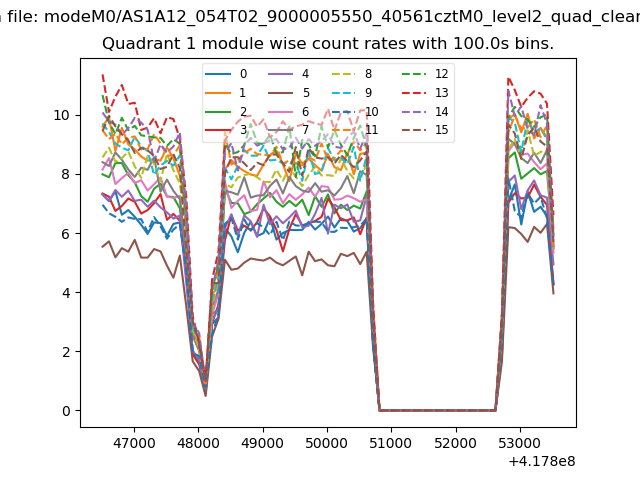
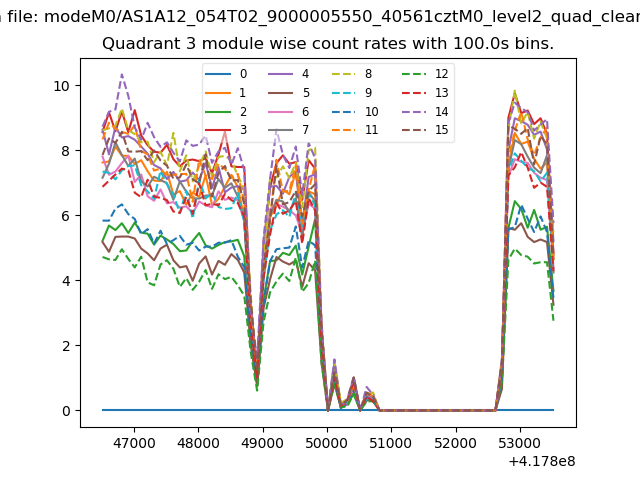
| Module-wise count rates for Quadrant A Data is divided into 100 sec bins |
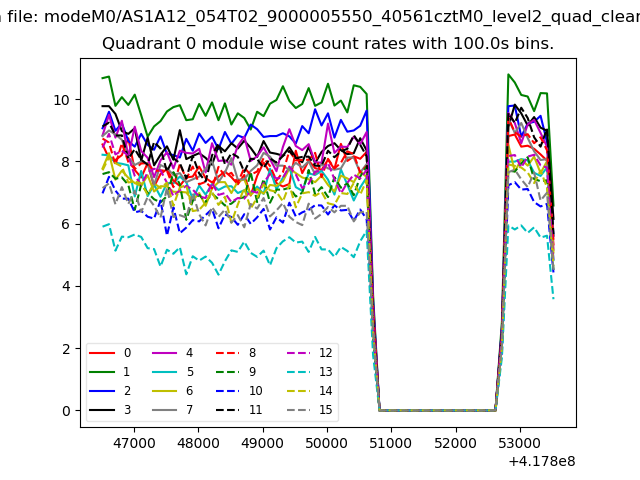 |
 |
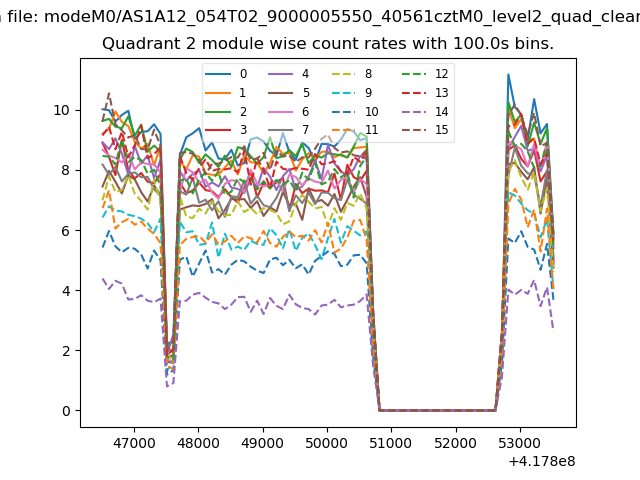
| Module-wise count rates for Quadrant B Data is divided into 100 sec bins |
 |
 |
| Module-wise count rates for Quadrant C Data is divided into 100 sec bins |
 |
 |
| Module-wise count rates for Quadrant D Data is divided into 100 sec bins |
 |
 |
| Parameter | Plot |
|---|---|
| CZT HV Monitor | 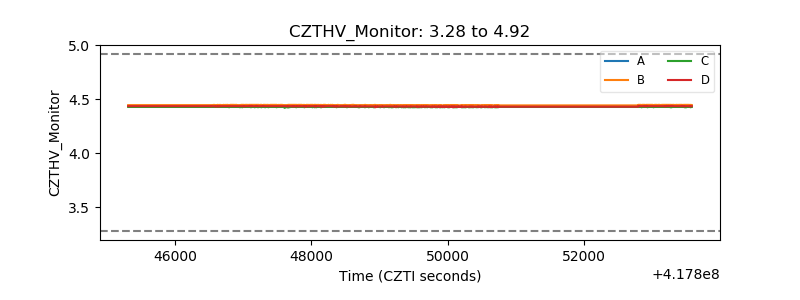 |
| D_VDD | 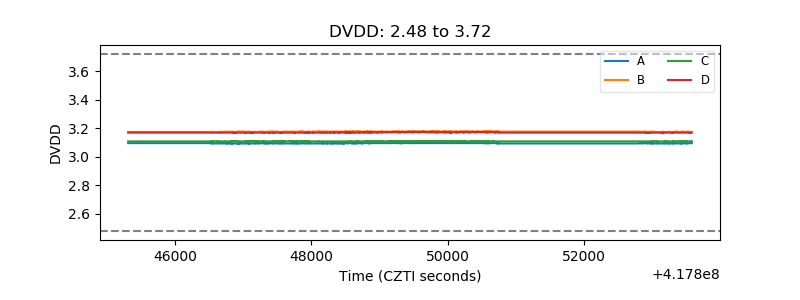 |
| Temperature 1 | 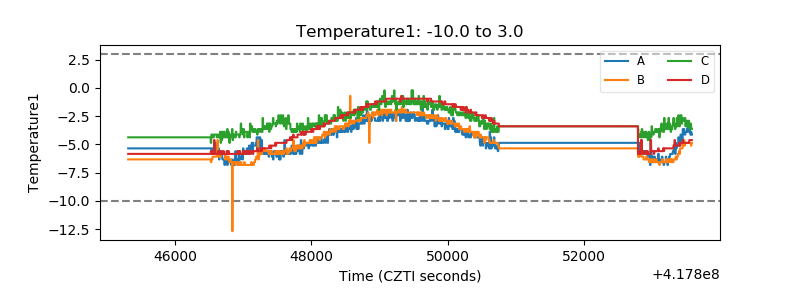 |
| Veto HV Monitor | 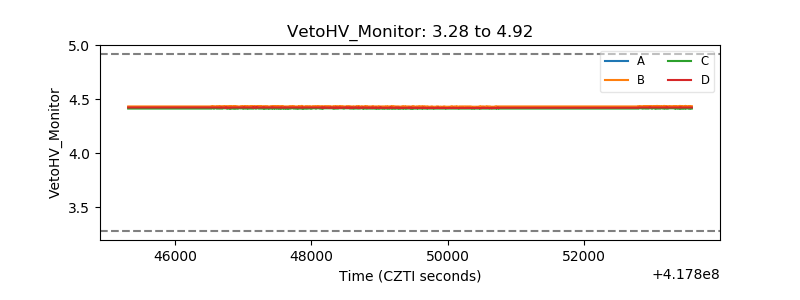 |
| Veto LLD | 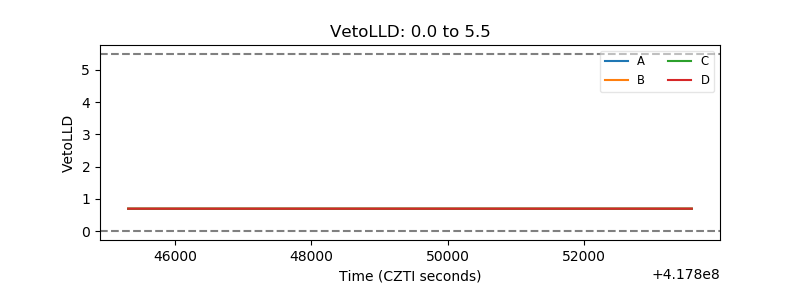 |
| Alpha Counter | 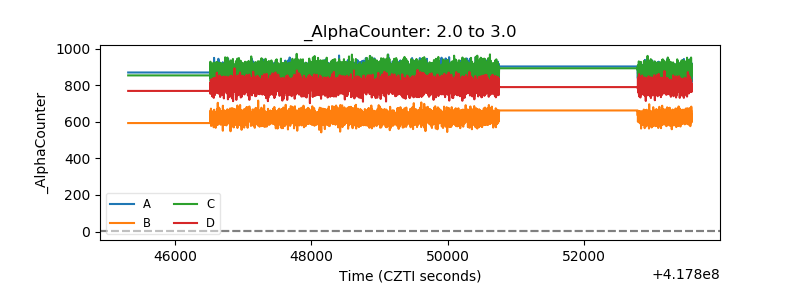 |
| _CPM_Rate | 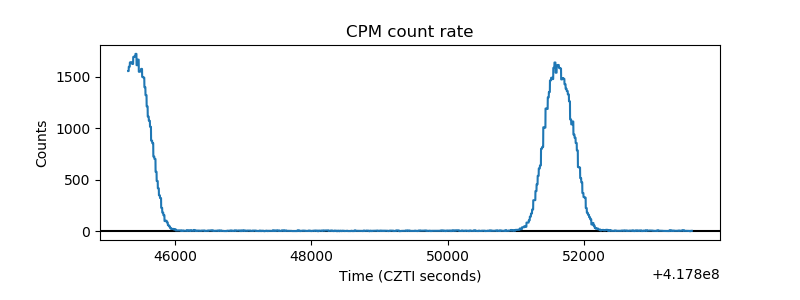 |
| CZT Counter | 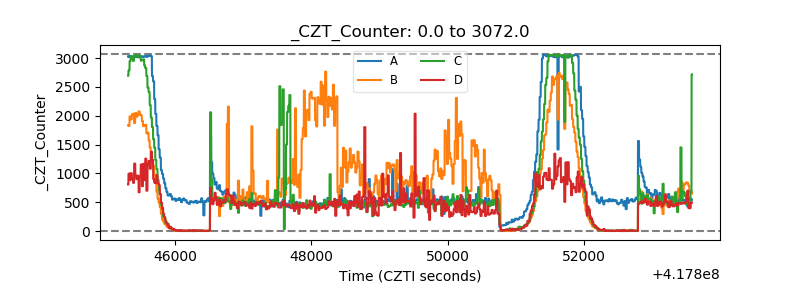 |
| +2.5 Volts monitor |  |
| +5 Volts monitor | 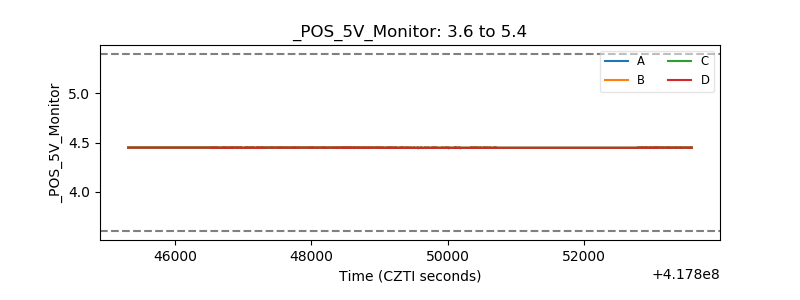 |
| _ROLL_ROT | 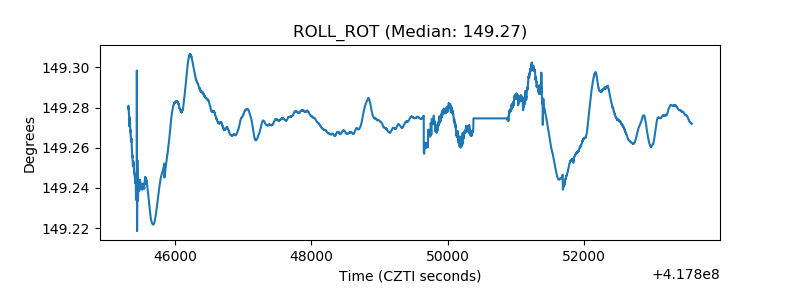 |
| _Roll_DEC | 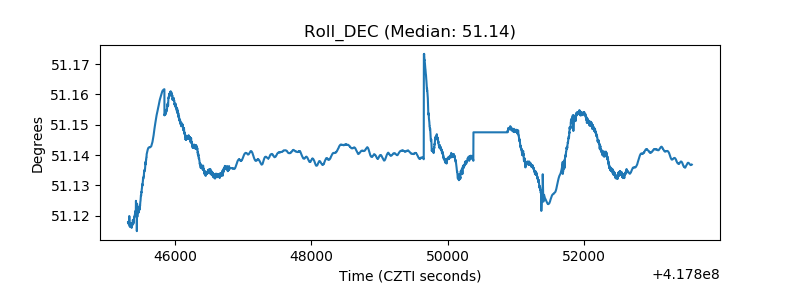 |
| _Roll_RA | 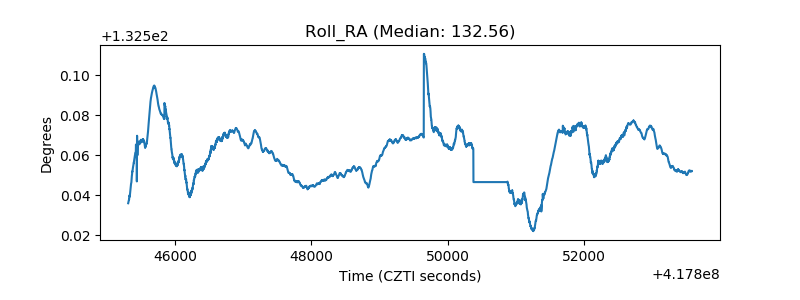 |
| Veto Counter | 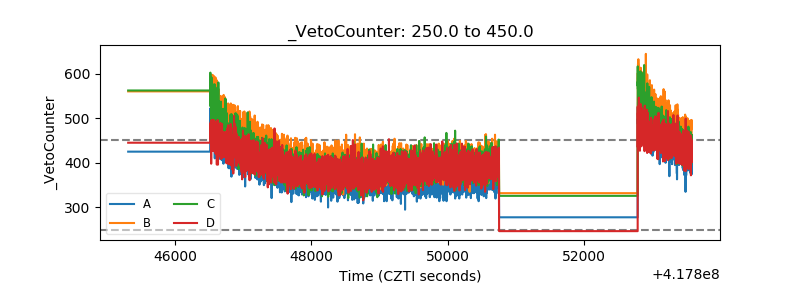 |