| Param | Original file | Final file |
|---|---|---|
| Filename | modeM0/AS1A12_054T02_9000005550_40562cztM0_level2.fits | modeM0/AS1A12_054T02_9000005550_40562cztM0_level2_quad_clean.evt |
| Size (bytes) | 327,127,680 | 87,157,440 |
| Size | 312.0 MB | 83.1 MB |
| Events in quadrant A | 2,770,937 | 619,989 |
| Events in quadrant B | 3,237,501 | 631,647 |
| Events in quadrant C | 2,870,417 | 588,617 |
| Events in quadrant D | 2,845,318 | 452,759 |
| Mode SS | |||
|---|---|---|---|
| Quadrant | BADHDUFLAG | Total packets | Discarded packets |
| A | 0 | 102 | 0 |
| B | 0 | 102 | 0 |
| C | 0 | 102 | 0 |
| D | 0 | 102 | 0 |
| Mode M0 | |||
|---|---|---|---|
| Quadrant | BADHDUFLAG | Total packets | Discarded packets |
| A | 0 | 10988 | 3 |
| B | 0 | 12872 | 2 |
| C | 0 | 11413 | 2 |
| D | 0 | 11644 | 2 |
| Mode M9 | |||
|---|---|---|---|
| Quadrant | BADHDUFLAG | Total packets | Discarded packets |
| A | 0 | 39 | 0 |
| B | 0 | 39 | 0 |
| C | 0 | 39 | 0 |
| D | 0 | 40 | 0 |
| Quadrant | Total seconds | Saturated seconds | Saturation percentage |
|---|---|---|---|
| A | 4931 | 13 | 0.263638% |
| B | 4931 | 64 | 1.297911% |
| C | 4931 | 63 | 1.277631% |
| D | 4931 | 1106 | 22.429527% |
Noise dominated data is calculated using 1-second bins in cleaned event files. If a bin has >2000 counts, and if more than 50% of those come from <1% of pixels, then it is considered to be noise-dominated and hence unusable.
| Quadrant | # 1 sec bins | Bins with >0 counts | Bins with >2000 counts | High rate bins dominated by noise | Noise dominated (total time) | Noise dominated (detector-on time) | Marked lightcurve |
|---|---|---|---|---|---|---|---|
| A | 7055 | 4932 | 5 | 5 | 0.07% | 0.10% | 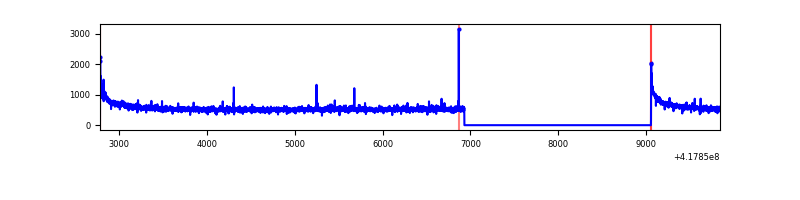 |
| B | 7055 | 4932 | 35 | 35 | 0.50% | 0.71% | 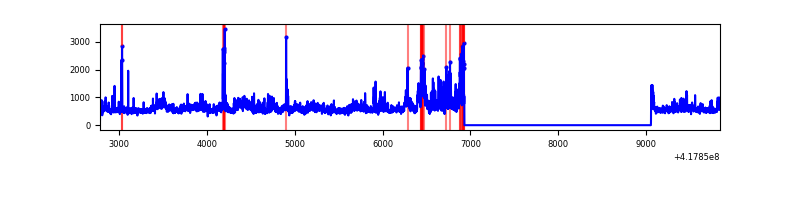 |
| C | 7055 | 4932 | 67 | 67 | 0.95% | 1.36% | 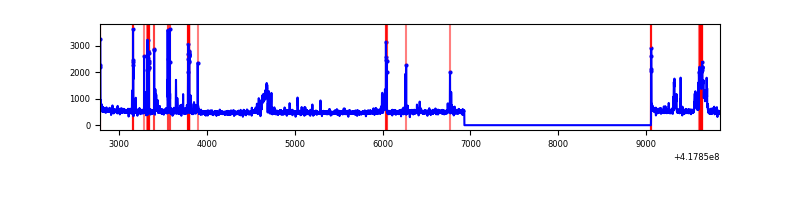 |
| D | 7055 | 4932 | 42 | 42 | 0.60% | 0.85% | 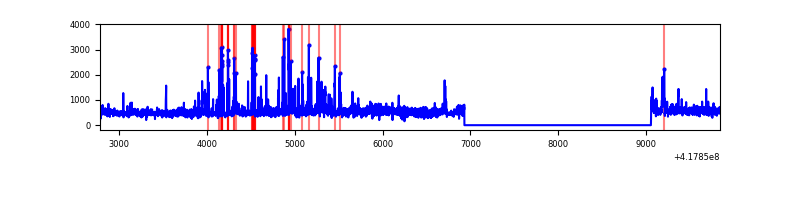 |
Top three noisy pixels from each quadrant. If the there are fewer than three noisy pixels in the level2.evt file, extra rows are filled as -1
| Pixel properties | Quadrant properties | ||||||
|---|---|---|---|---|---|---|---|
| Quadrant | DetID | PixID | Counts | Sigma | Mean | Median | Sigma |
| A | 10 | 83 | 484434 | 4082.34 | 583 | 573 | 118.5 |
| A | 2 | 79 | 13873 | 112.21 | 583 | 573 | 118.5 |
| A | 12 | 189 | 9823 | 78.04 | 583 | 573 | 118.5 |
| B | 3 | 112 | 845426 | 7764.04 | 574 | 559 | 108.8 |
| B | 5 | 255 | 49793 | 452.44 | 574 | 559 | 108.8 |
| B | 4 | 171 | 40699 | 368.87 | 574 | 559 | 108.8 |
| C | 14 | 254 | 457220 | 3602.77 | 555 | 559 | 126.8 |
| C | 15 | 214 | 218117 | 1716.4 | 555 | 559 | 126.8 |
| C | 0 | 10 | 26992 | 208.54 | 555 | 559 | 126.8 |
| D | 12 | 191 | 277539 | 2220.94 | 512 | 498 | 124.7 |
| D | 12 | 227 | 187758 | 1501.2 | 512 | 498 | 124.7 |
| D | 12 | 79 | 178745 | 1428.95 | 512 | 498 | 124.7 |
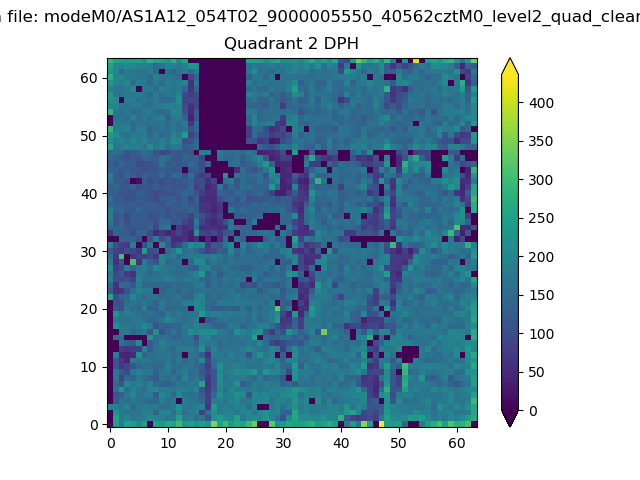
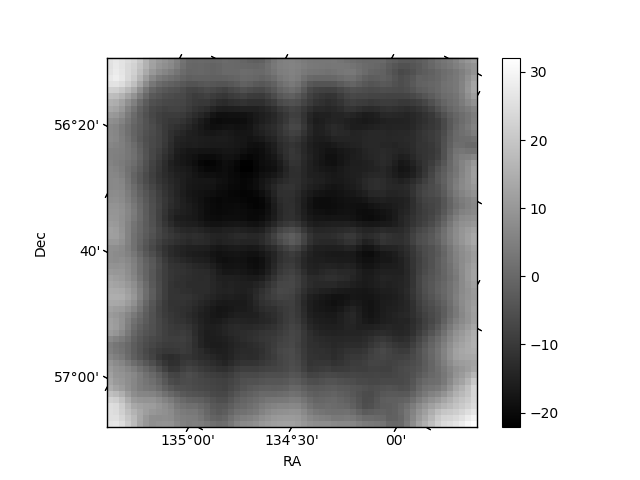
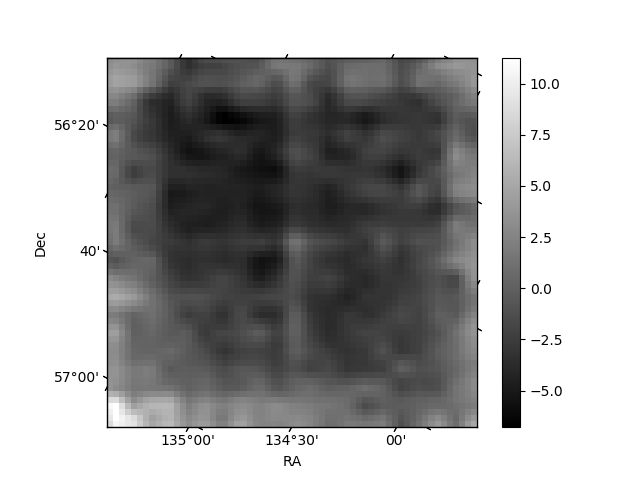
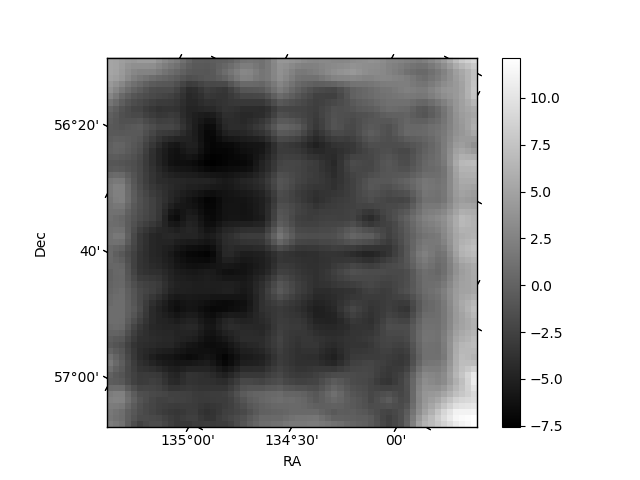
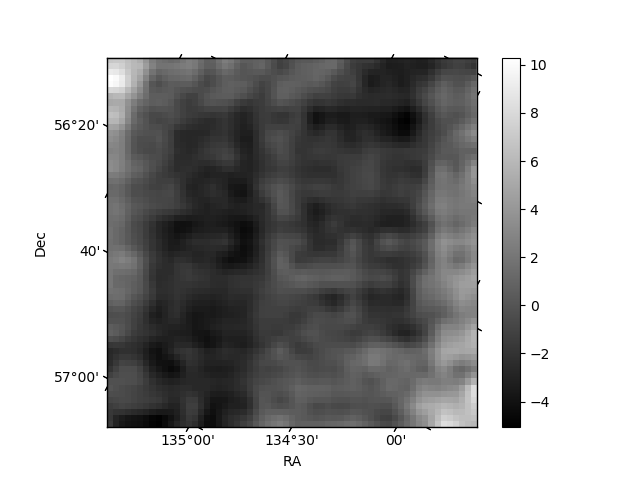
Histogram calculated using DETX and DETY for each event in the final _common_clean file
| Quadrant A | 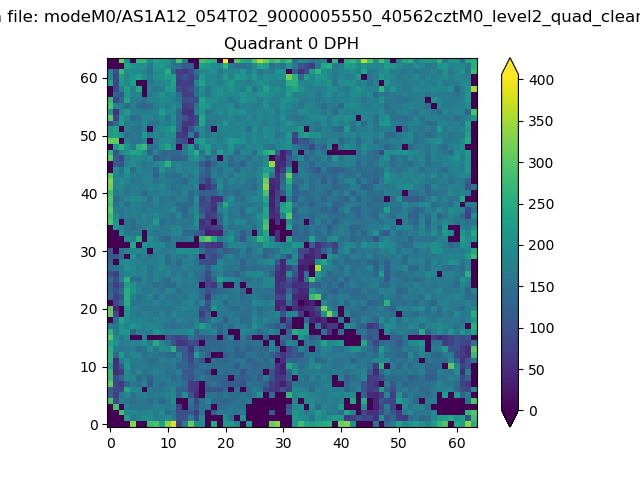 |
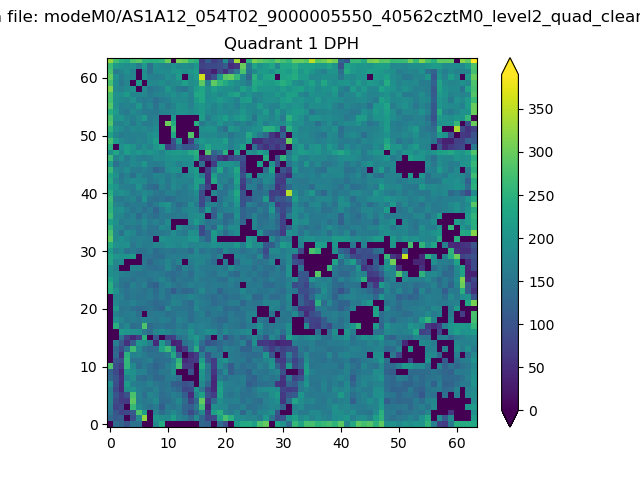 |
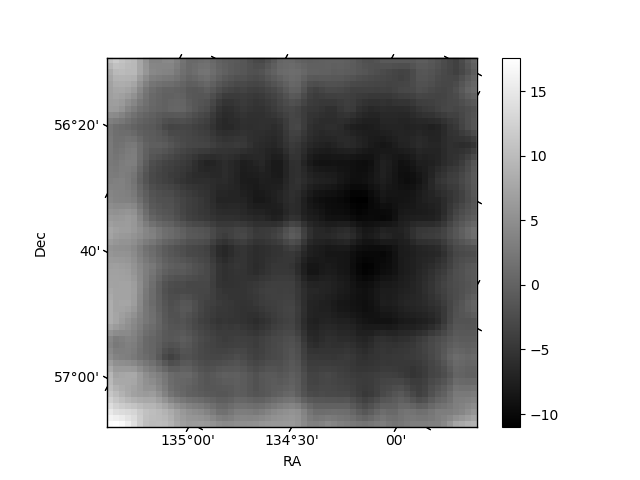
Quadrant B |
|---|---|---|---|
| Quadrant D | 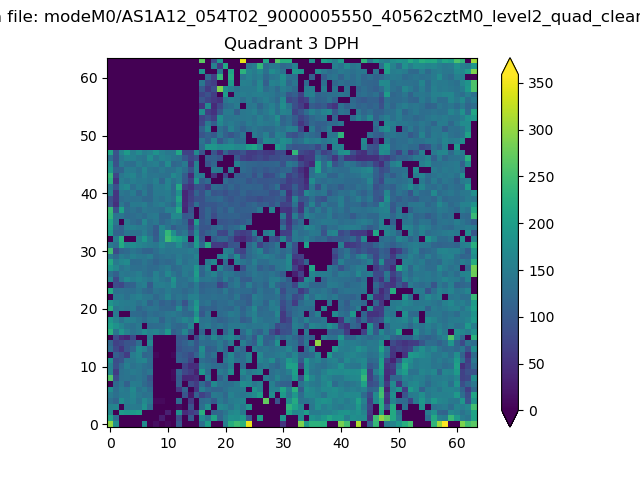 |
 |
Quadrant C |
| Plot type | Count rate plots | Images |
|---|---|---|
| Comparison with Poisson distribution Blue bars denote a histogram of data divided into 1 sec bins. Red curve is a Poisson curve with rate = median count rate of data. |
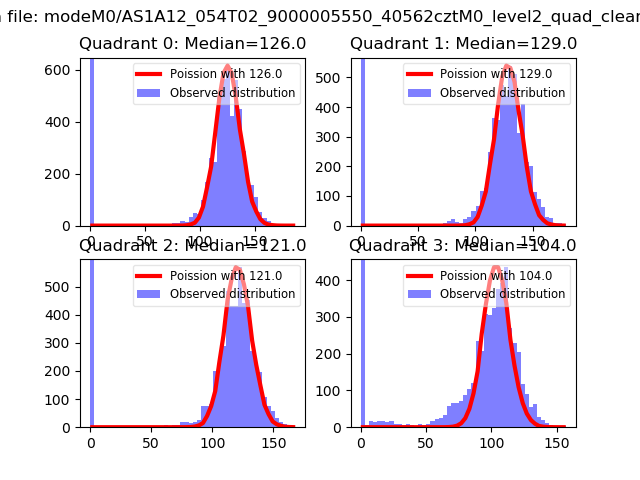 |
 |
| Quadrant-wise count rates Data is divided into 100 sec bins |
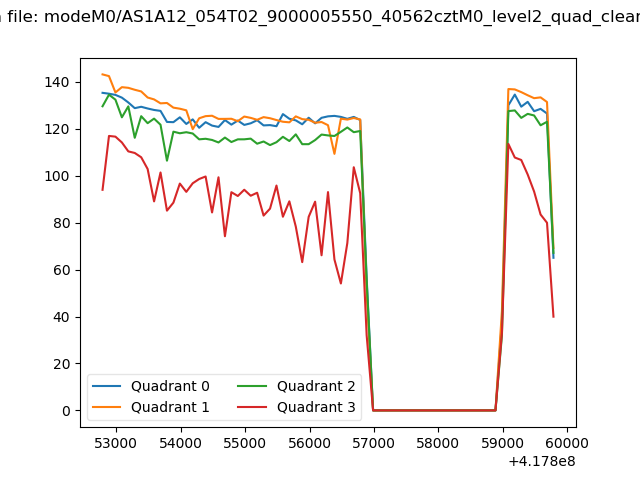 |
|
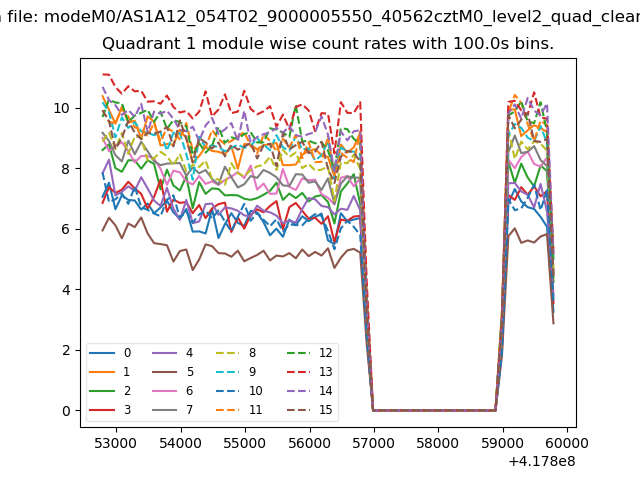
| Module-wise count rates for Quadrant A Data is divided into 100 sec bins |
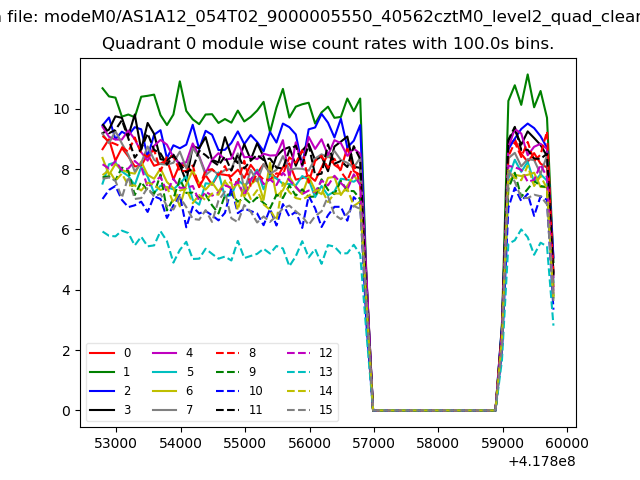 |
 |
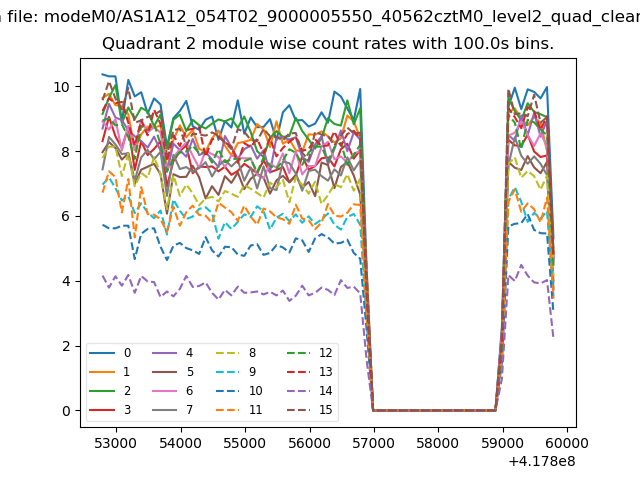
| Module-wise count rates for Quadrant B Data is divided into 100 sec bins |
 |
 |
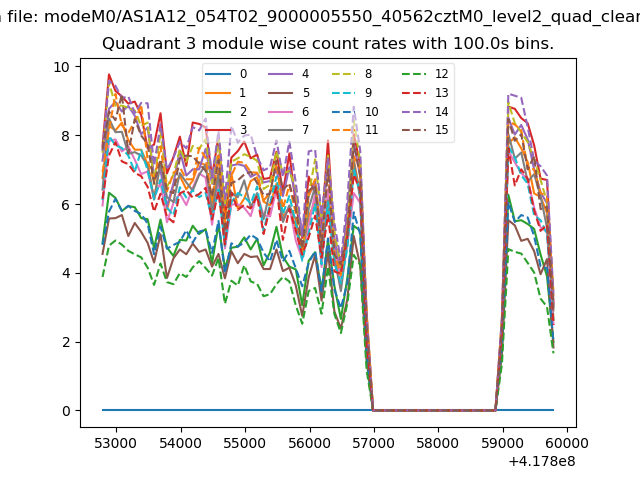
| Module-wise count rates for Quadrant C Data is divided into 100 sec bins |
 |
 |
| Module-wise count rates for Quadrant D Data is divided into 100 sec bins |
 |
 |
| Parameter | Plot |
|---|---|
| CZT HV Monitor | 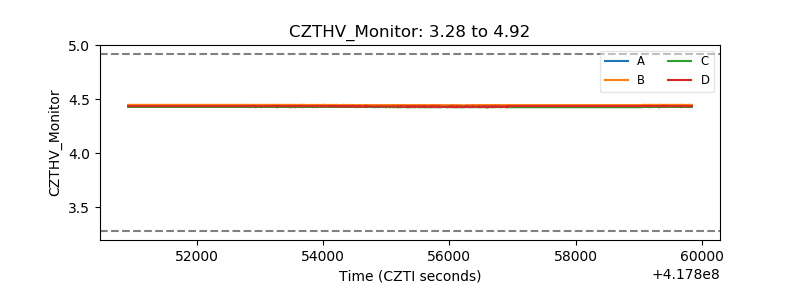 |
| D_VDD | 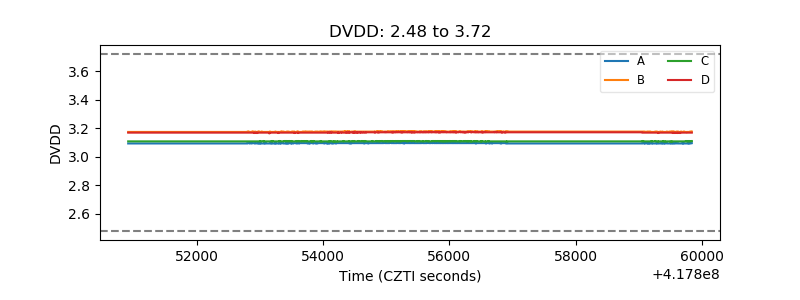 |
| Temperature 1 | 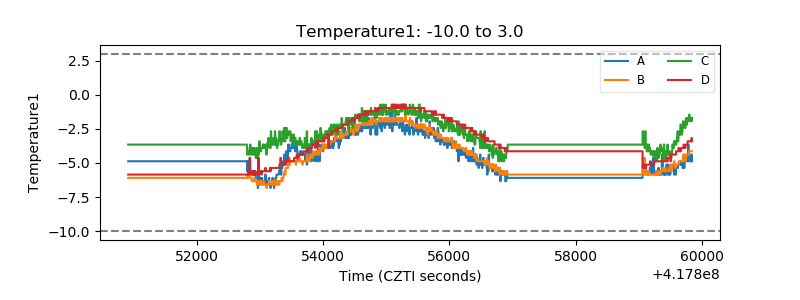 |
| Veto HV Monitor | 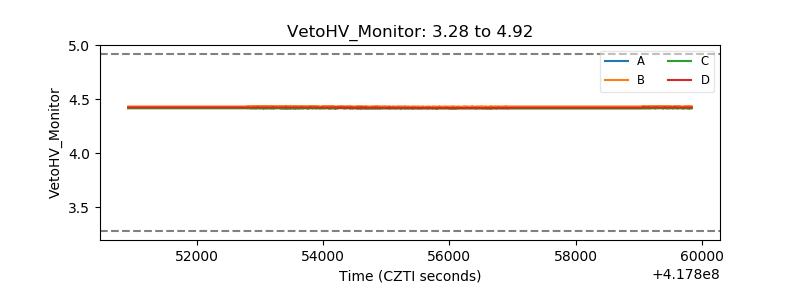 |
| Veto LLD | 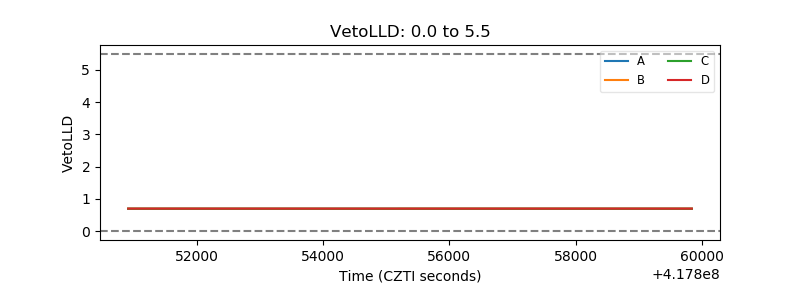 |
| Alpha Counter | 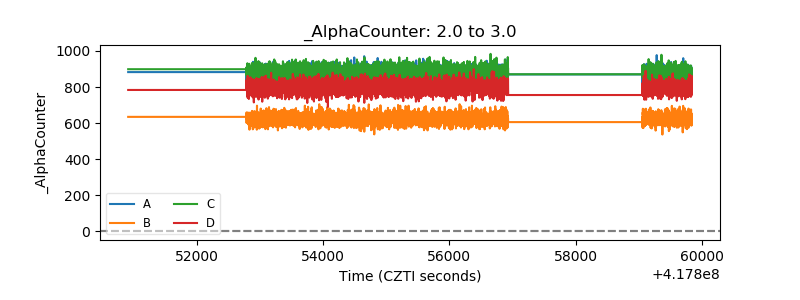 |
| _CPM_Rate | 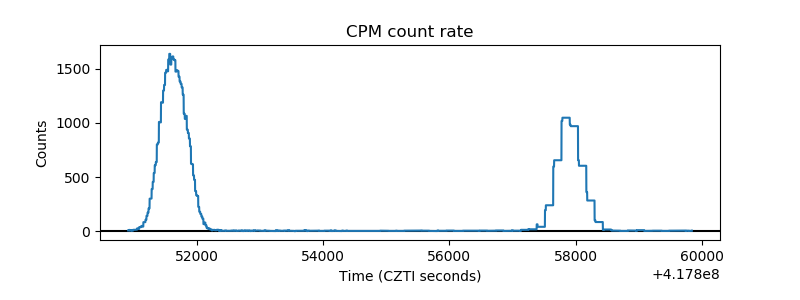 |
| CZT Counter | 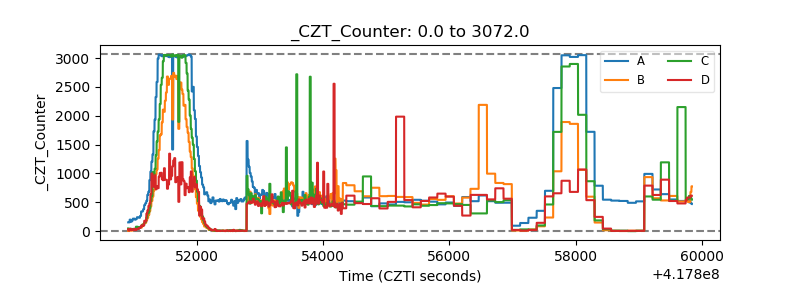 |
| +2.5 Volts monitor | 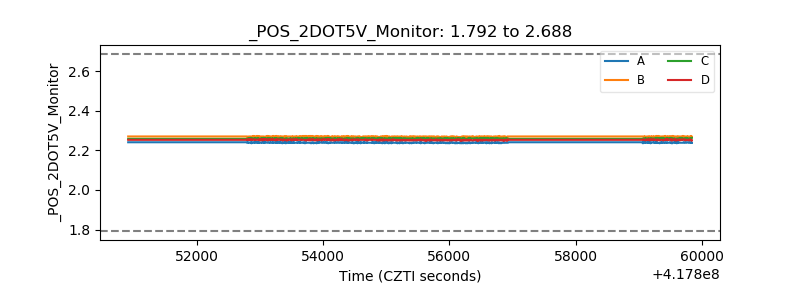 |
| +5 Volts monitor | 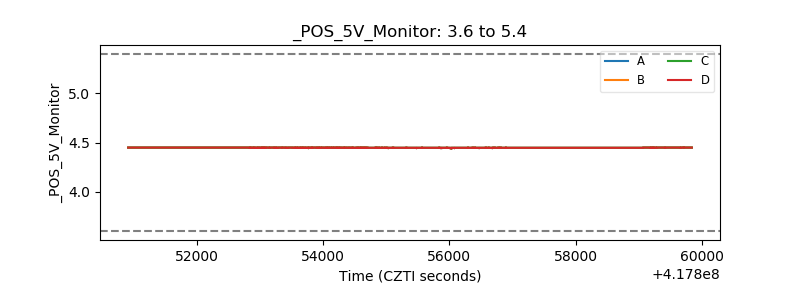 |
| _ROLL_ROT | 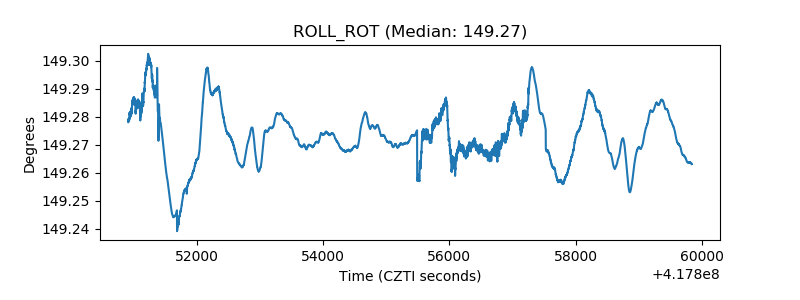 |
| _Roll_DEC | 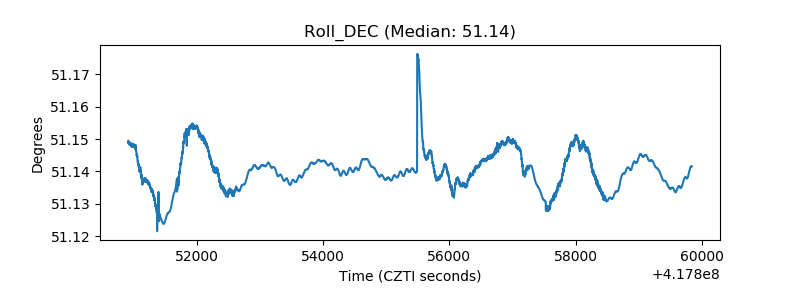 |
| _Roll_RA | 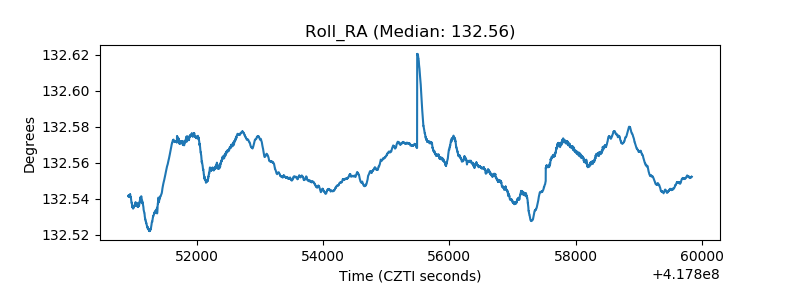 |
| Veto Counter | 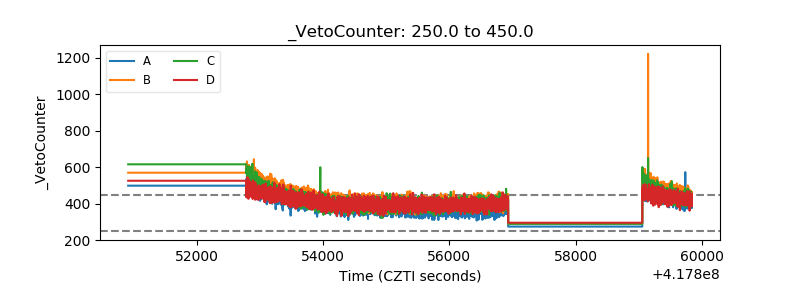 |