| Param | Original file | Final file |
|---|---|---|
| Filename | modeM0/AS1A12_054T02_9000005550_40563cztM0_level2.fits | modeM0/AS1A12_054T02_9000005550_40563cztM0_level2_quad_clean.evt |
| Size (bytes) | 335,485,440 | 81,437,760 |
| Size | 319.9 MB | 77.7 MB |
| Events in quadrant A | 2,721,726 | 601,733 |
| Events in quadrant B | 3,295,369 | 609,445 |
| Events in quadrant C | 2,735,530 | 568,494 |
| Events in quadrant D | 3,282,334 | 342,894 |
| Mode SS | |||
|---|---|---|---|
| Quadrant | BADHDUFLAG | Total packets | Discarded packets |
| A | 0 | 98 | 0 |
| B | 0 | 98 | 0 |
| C | 0 | 98 | 0 |
| D | 0 | 98 | 0 |
| Mode M0 | |||
|---|---|---|---|
| Quadrant | BADHDUFLAG | Total packets | Discarded packets |
| A | 0 | 10916 | 3 |
| B | 0 | 12964 | 2 |
| C | 0 | 11097 | 2 |
| D | 0 | 13108 | 2 |
| Mode M9 | |||
|---|---|---|---|
| Quadrant | BADHDUFLAG | Total packets | Discarded packets |
| A | 0 | 29 | 0 |
| B | 0 | 29 | 0 |
| C | 0 | 29 | 0 |
| D | 0 | 30 | 0 |
| Quadrant | Total seconds | Saturated seconds | Saturation percentage |
|---|---|---|---|
| A | 4899 | 14 | 0.285773% |
| B | 4899 | 59 | 1.204327% |
| C | 4899 | 47 | 0.959379% |
| D | 4899 | 2091 | 42.682180% |
Noise dominated data is calculated using 1-second bins in cleaned event files. If a bin has >2000 counts, and if more than 50% of those come from <1% of pixels, then it is considered to be noise-dominated and hence unusable.
| Quadrant | # 1 sec bins | Bins with >0 counts | Bins with >2000 counts | High rate bins dominated by noise | Noise dominated (total time) | Noise dominated (detector-on time) | Marked lightcurve |
|---|---|---|---|---|---|---|---|
| A | 7052 | 4900 | 6 | 6 | 0.09% | 0.12% | 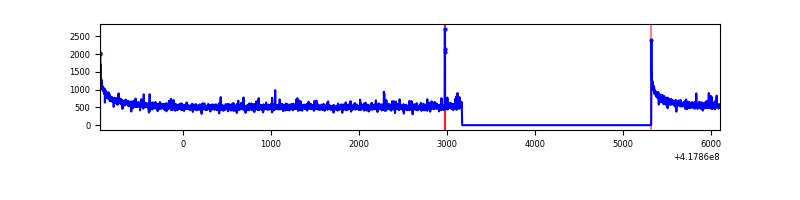 |
| B | 7052 | 4900 | 38 | 38 | 0.54% | 0.78% | 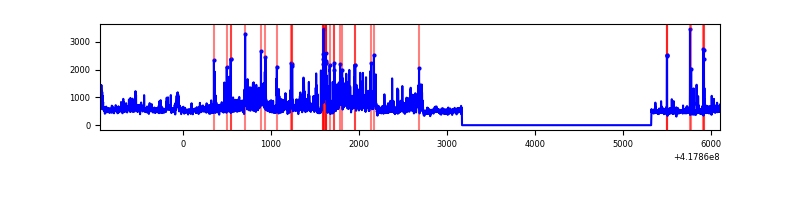 |
| C | 7052 | 4900 | 48 | 48 | 0.68% | 0.98% | 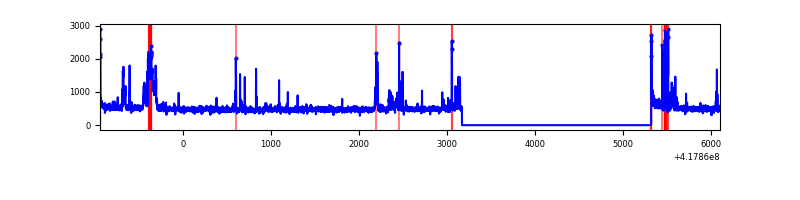 |
| D | 7051 | 4898 | 107 | 107 | 1.52% | 2.18% | 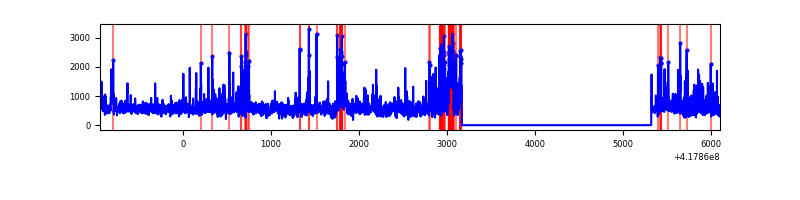 |
Top three noisy pixels from each quadrant. If the there are fewer than three noisy pixels in the level2.evt file, extra rows are filled as -1
| Pixel properties | Quadrant properties | ||||||
|---|---|---|---|---|---|---|---|
| Quadrant | DetID | PixID | Counts | Sigma | Mean | Median | Sigma |
| A | 10 | 83 | 467120 | 4045.66 | 567 | 557 | 115.3 |
| A | 2 | 79 | 32761 | 279.25 | 567 | 557 | 115.3 |
| A | 12 | 189 | 13618 | 113.25 | 567 | 557 | 115.3 |
| B | 3 | 112 | 650643 | 6016.26 | 557 | 542 | 108.1 |
| B | 4 | 171 | 260966 | 2410.05 | 557 | 542 | 108.1 |
| B | 5 | 255 | 108311 | 997.33 | 557 | 542 | 108.1 |
| C | 14 | 254 | 372632 | 2970.49 | 541 | 543 | 125.3 |
| C | 15 | 214 | 218342 | 1738.75 | 541 | 543 | 125.3 |
| C | 0 | 10 | 26980 | 211.05 | 541 | 543 | 125.3 |
| D | 12 | 191 | 354802 | 3105.53 | 465 | 452 | 114.1 |
| D | 12 | 0 | 298854 | 2615.2 | 465 | 452 | 114.1 |
| D | 12 | 79 | 285704 | 2499.95 | 465 | 452 | 114.1 |
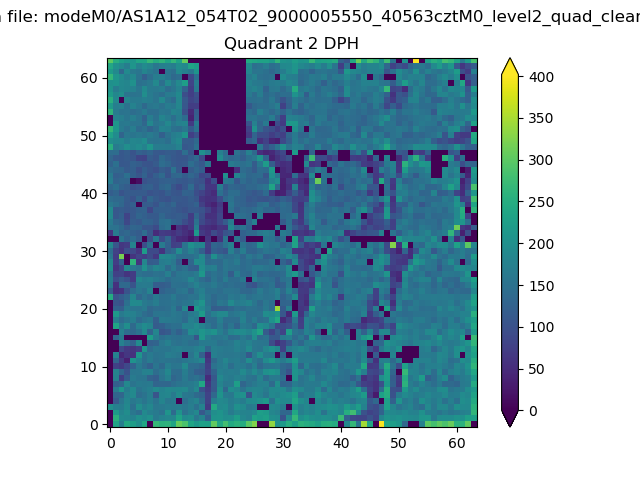
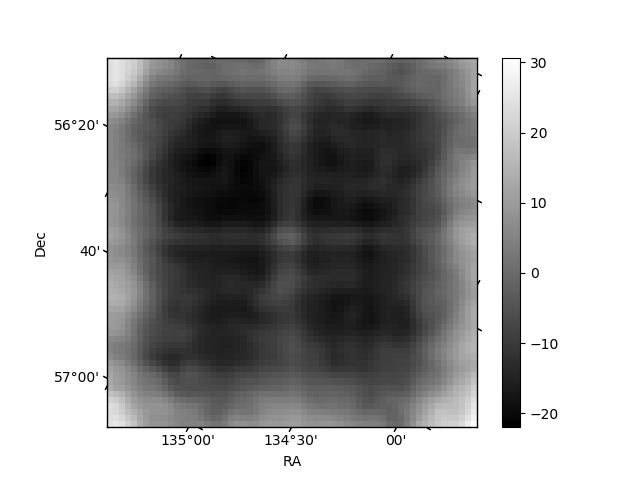
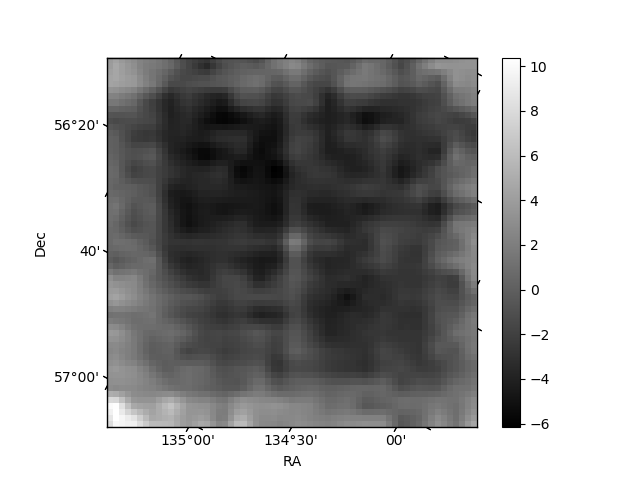
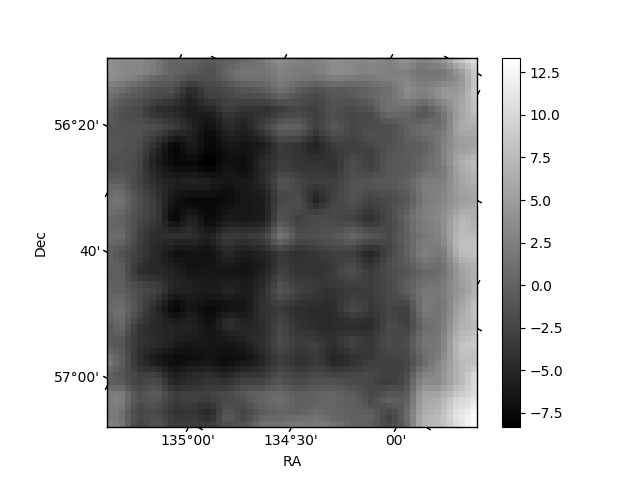
Histogram calculated using DETX and DETY for each event in the final _common_clean file
| Quadrant A | 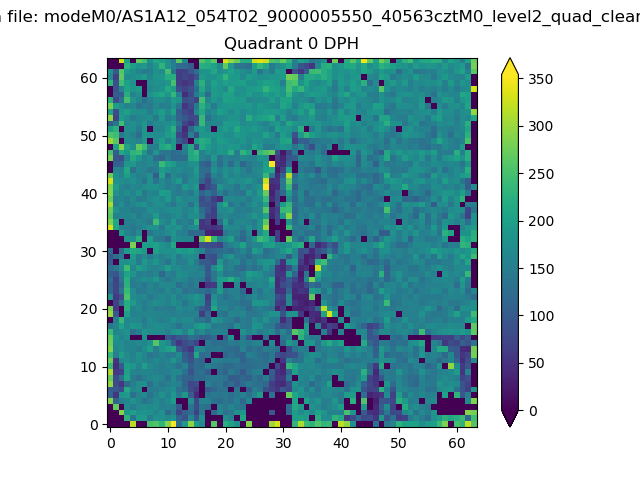 |
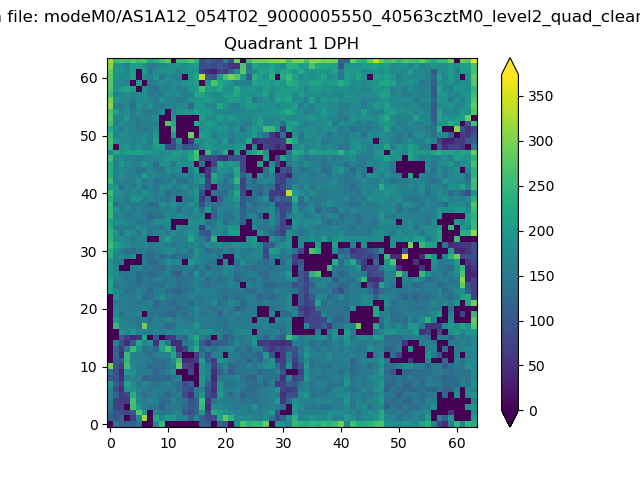 |
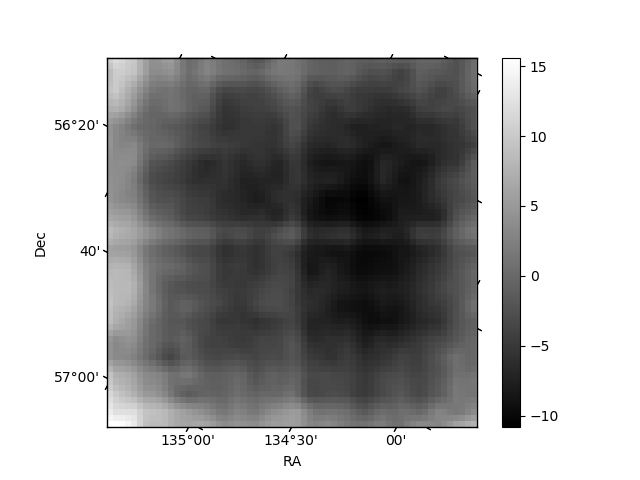
Quadrant B |
|---|---|---|---|
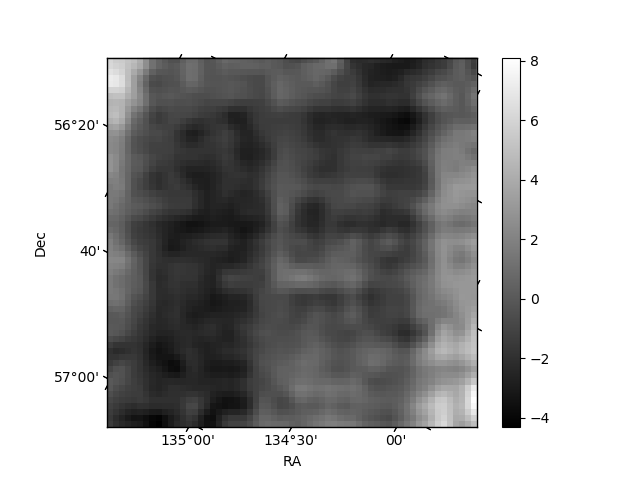
| Quadrant D | 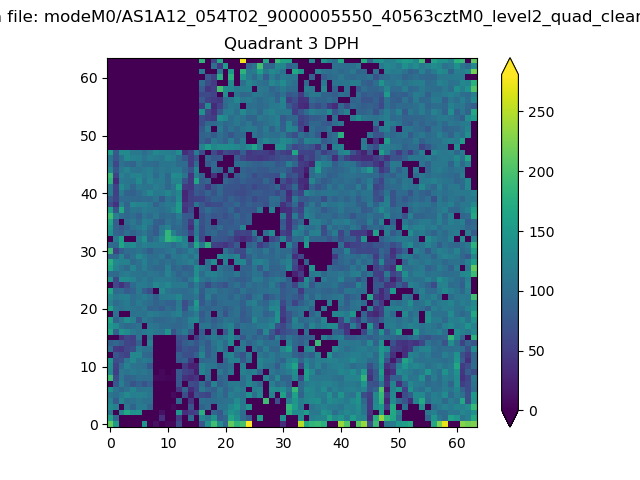 |
 |
Quadrant C |
| Plot type | Count rate plots | Images |
|---|---|---|
| Comparison with Poisson distribution Blue bars denote a histogram of data divided into 1 sec bins. Red curve is a Poisson curve with rate = median count rate of data. |
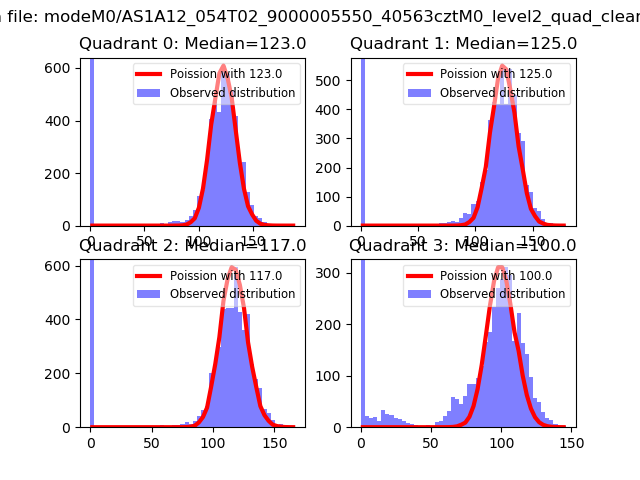 |
 |
| Quadrant-wise count rates Data is divided into 100 sec bins |
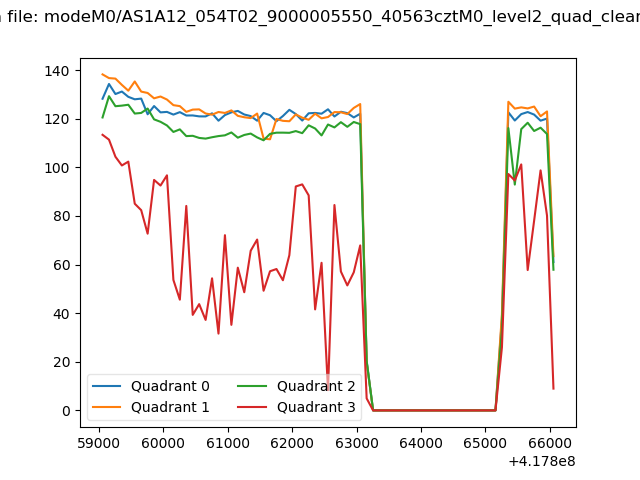 |
|
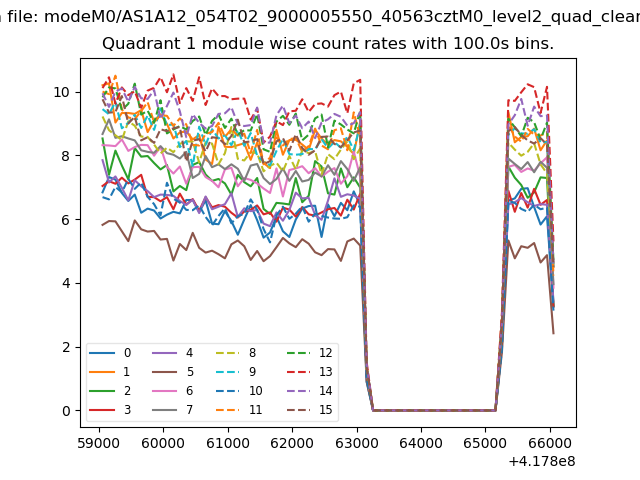
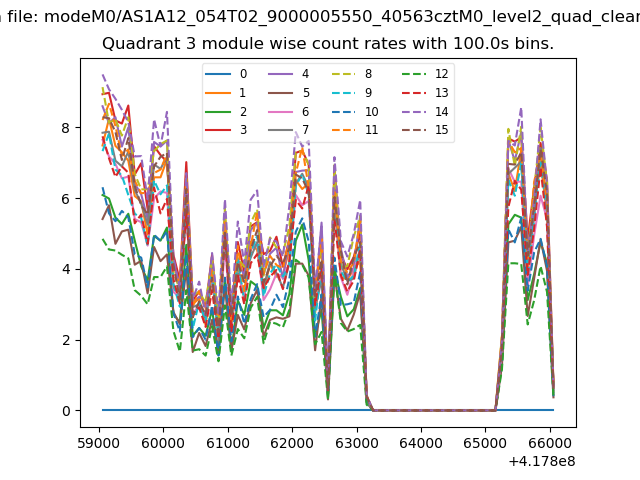
| Module-wise count rates for Quadrant A Data is divided into 100 sec bins |
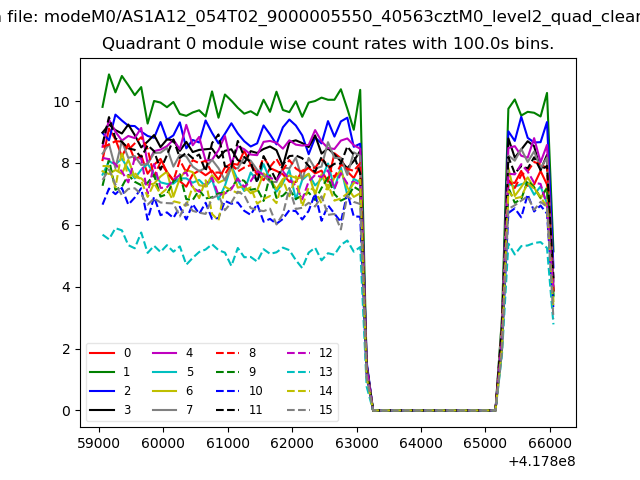 |
 |
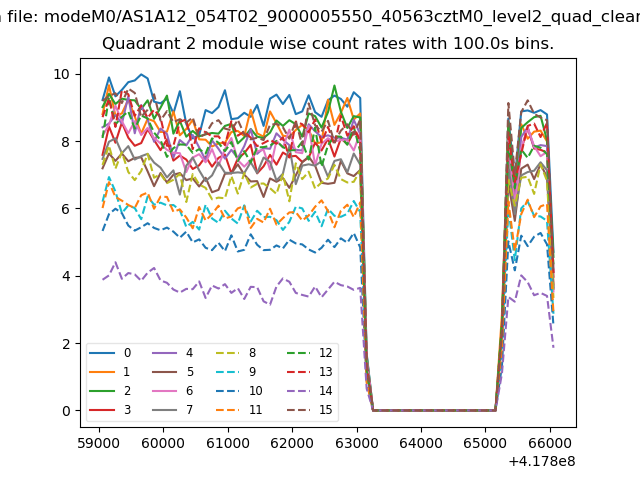
| Module-wise count rates for Quadrant B Data is divided into 100 sec bins |
 |
 |
| Module-wise count rates for Quadrant C Data is divided into 100 sec bins |
 |
 |
| Module-wise count rates for Quadrant D Data is divided into 100 sec bins |
 |
 |
| Parameter | Plot |
|---|---|
| CZT HV Monitor | 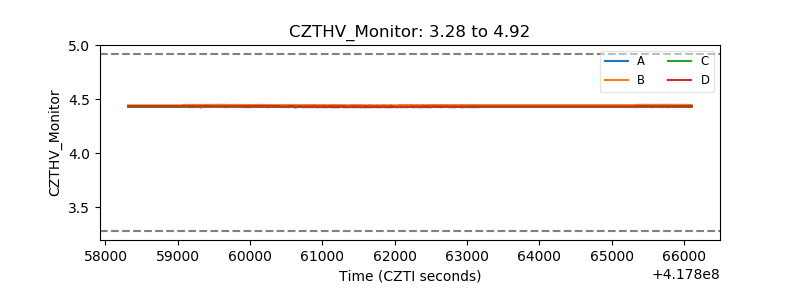 |
| D_VDD | 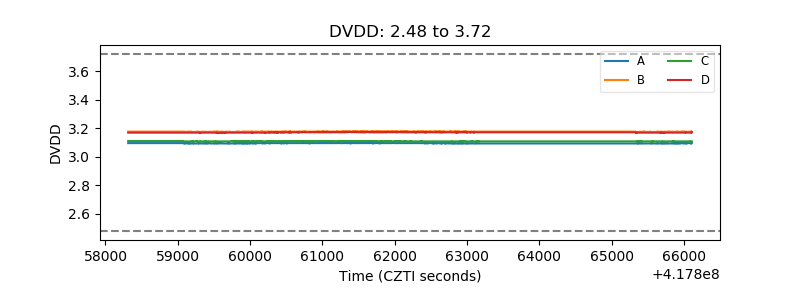 |
| Temperature 1 | 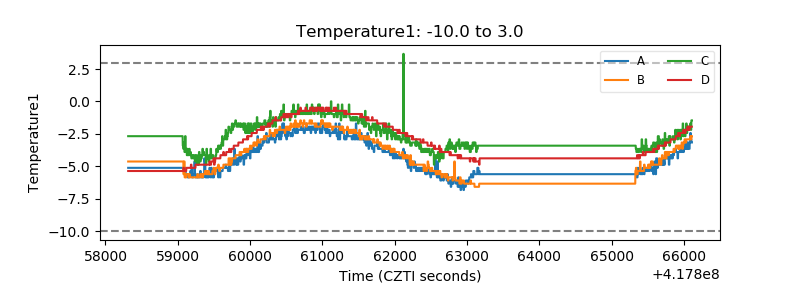 |
| Veto HV Monitor | 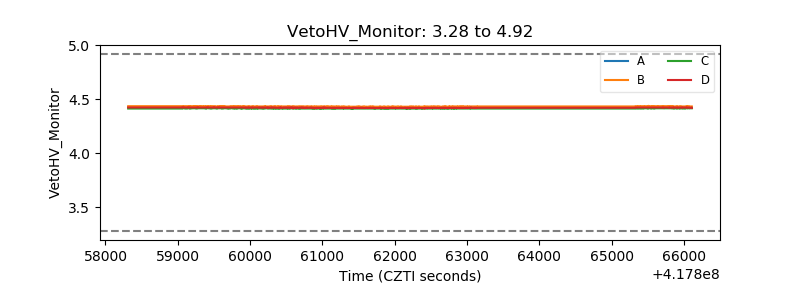 |
| Veto LLD | 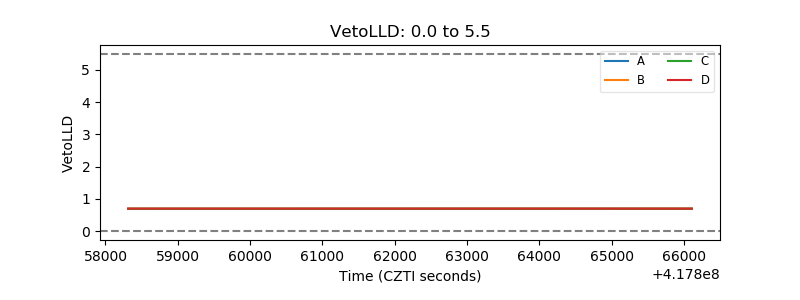 |
| Alpha Counter | 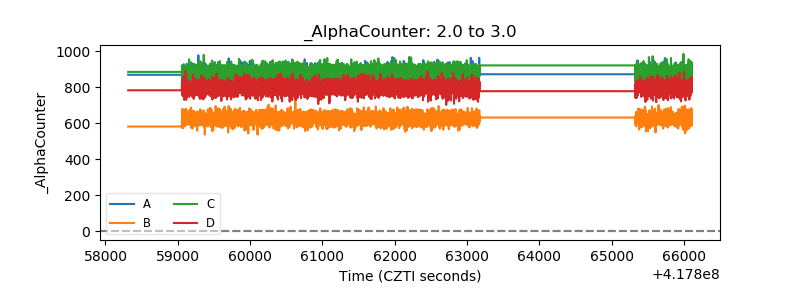 |
| _CPM_Rate | 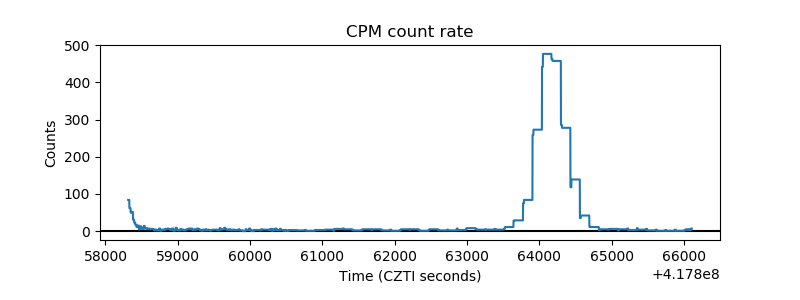 |
| CZT Counter | 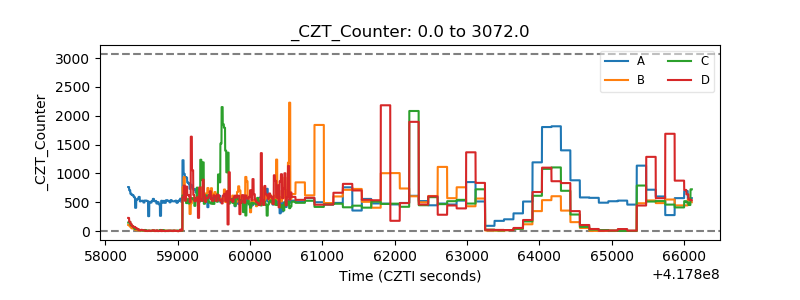 |
| +2.5 Volts monitor | 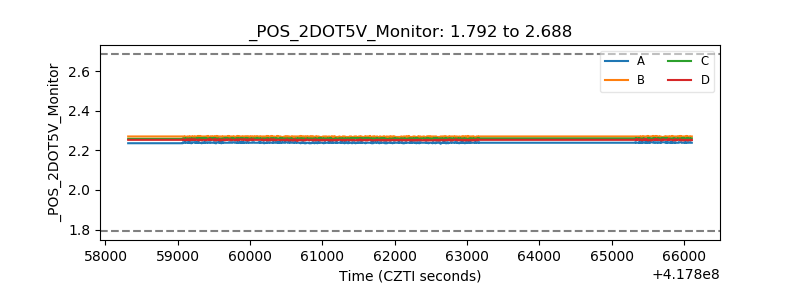 |
| +5 Volts monitor | 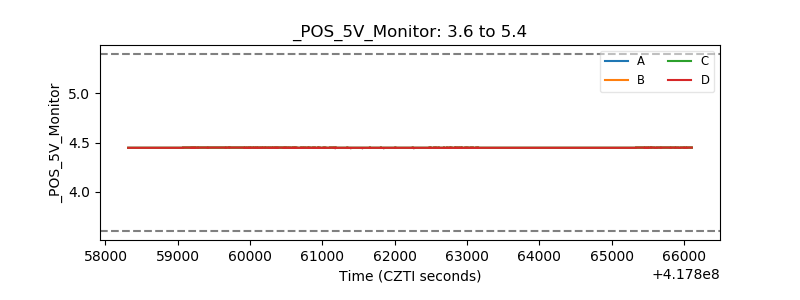 |
| _ROLL_ROT | 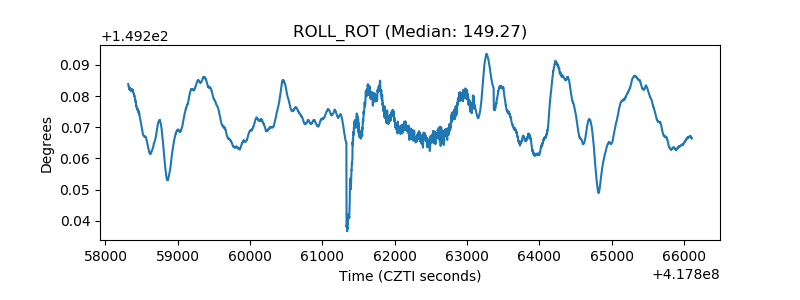 |
| _Roll_DEC | 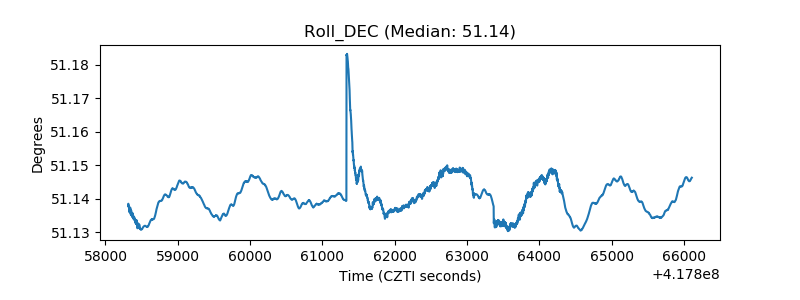 |
| _Roll_RA | 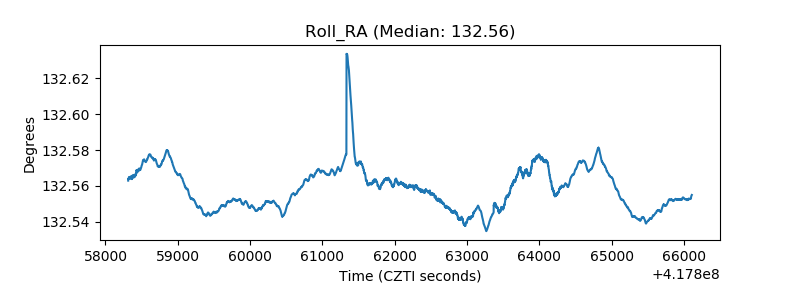 |
| Veto Counter | 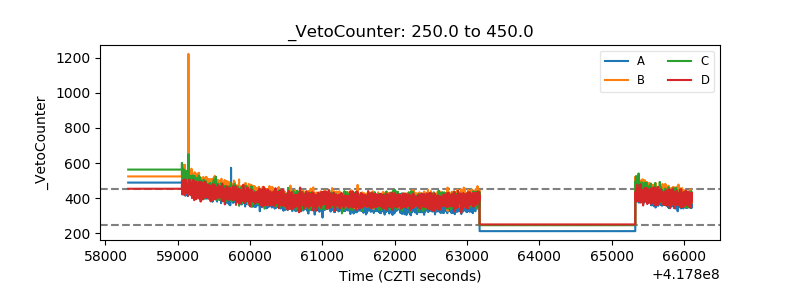 |