| Param | Original file | Final file |
|---|---|---|
| Filename | modeM0/AS1A12_054T02_9000005550_40564cztM0_level2.fits | modeM0/AS1A12_054T02_9000005550_40564cztM0_level2_quad_clean.evt |
| Size (bytes) | 338,497,920 | 77,598,720 |
| Size | 322.8 MB | 74.0 MB |
| Events in quadrant A | 2,738,241 | 589,446 |
| Events in quadrant B | 2,783,689 | 590,640 |
| Events in quadrant C | 2,512,325 | 557,865 |
| Events in quadrant D | 4,101,320 | 258,738 |
| Mode SS | |||
|---|---|---|---|
| Quadrant | BADHDUFLAG | Total packets | Discarded packets |
| A | 0 | 104 | 0 |
| B | 0 | 104 | 0 |
| C | 0 | 104 | 0 |
| D | 0 | 104 | 0 |
| Mode M0 | |||
|---|---|---|---|
| Quadrant | BADHDUFLAG | Total packets | Discarded packets |
| A | 0 | 11129 | 3 |
| B | 0 | 11483 | 2 |
| C | 0 | 10604 | 2 |
| D | 0 | 15750 | 2 |
| Mode M9 | |||
|---|---|---|---|
| Quadrant | BADHDUFLAG | Total packets | Discarded packets |
| A | 0 | 27 | 0 |
| B | 0 | 27 | 0 |
| C | 0 | 27 | 0 |
| D | 0 | 28 | 0 |
| Quadrant | Total seconds | Saturated seconds | Saturation percentage |
|---|---|---|---|
| A | 5027 | 13 | 0.258604% |
| B | 5027 | 79 | 1.571514% |
| C | 5027 | 33 | 0.656455% |
| D | 5027 | 2809 | 55.878257% |
Noise dominated data is calculated using 1-second bins in cleaned event files. If a bin has >2000 counts, and if more than 50% of those come from <1% of pixels, then it is considered to be noise-dominated and hence unusable.
| Quadrant | # 1 sec bins | Bins with >0 counts | Bins with >2000 counts | High rate bins dominated by noise | Noise dominated (total time) | Noise dominated (detector-on time) | Marked lightcurve |
|---|---|---|---|---|---|---|---|
| A | 7090 | 5028 | 3 | 3 | 0.04% | 0.06% | 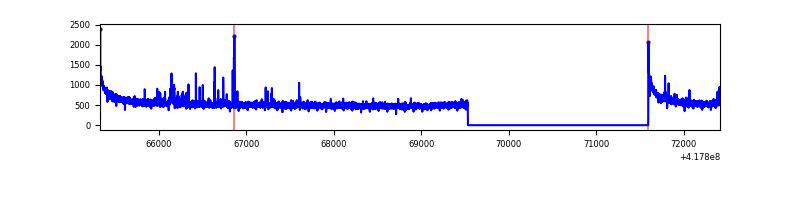 |
| B | 7090 | 5028 | 70 | 70 | 0.99% | 1.39% | 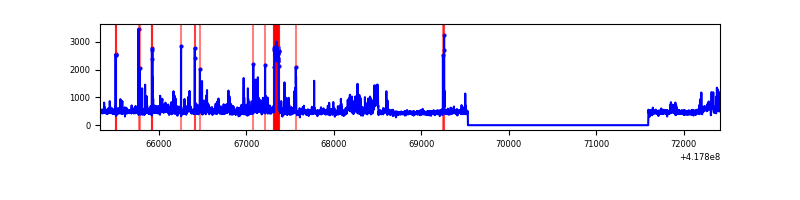 |
| C | 7090 | 5028 | 28 | 28 | 0.39% | 0.56% | 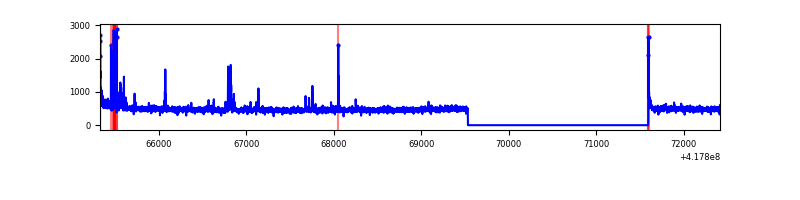 |
| D | 7089 | 5027 | 311 | 311 | 4.39% | 6.19% | 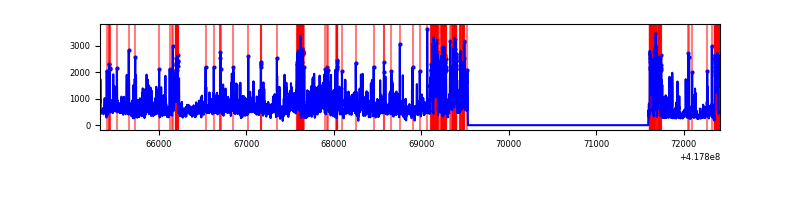 |
Top three noisy pixels from each quadrant. If the there are fewer than three noisy pixels in the level2.evt file, extra rows are filled as -1
| Pixel properties | Quadrant properties | ||||||
|---|---|---|---|---|---|---|---|
| Quadrant | DetID | PixID | Counts | Sigma | Mean | Median | Sigma |
| A | 10 | 83 | 474129 | 4161.48 | 562 | 551 | 113.8 |
| A | 2 | 79 | 70179 | 611.84 | 562 | 551 | 113.8 |
| A | 12 | 189 | 7662 | 62.49 | 562 | 551 | 113.8 |
| B | 3 | 112 | 185637 | 1749.02 | 550 | 535 | 105.8 |
| B | 4 | 171 | 150451 | 1416.55 | 550 | 535 | 105.8 |
| B | 7 | 202 | 126256 | 1187.93 | 550 | 535 | 105.8 |
| C | 15 | 214 | 221324 | 1755.09 | 541 | 544 | 125.8 |
| C | 14 | 254 | 147261 | 1166.32 | 541 | 544 | 125.8 |
| C | 0 | 10 | 26825 | 208.92 | 541 | 544 | 125.8 |
| D | 12 | 227 | 1296923 | 13086.44 | 403 | 390 | 99.1 |
| D | 12 | 191 | 387474 | 3907.0 | 403 | 390 | 99.1 |
| D | 12 | 0 | 319717 | 3223.1 | 403 | 390 | 99.1 |
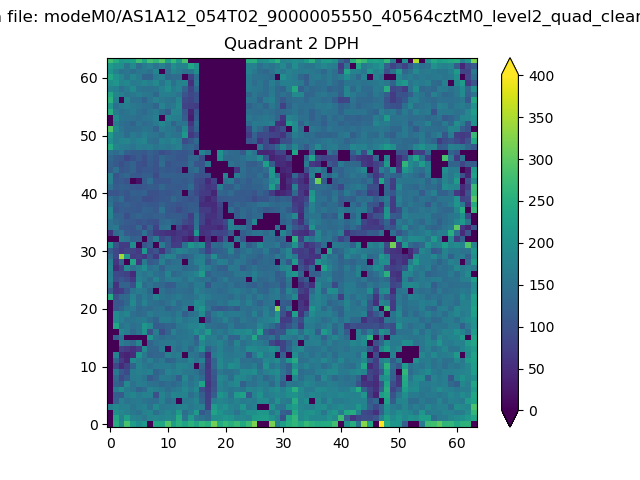
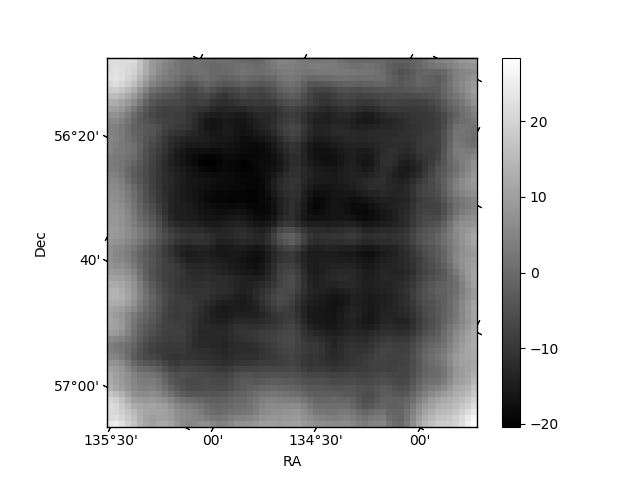
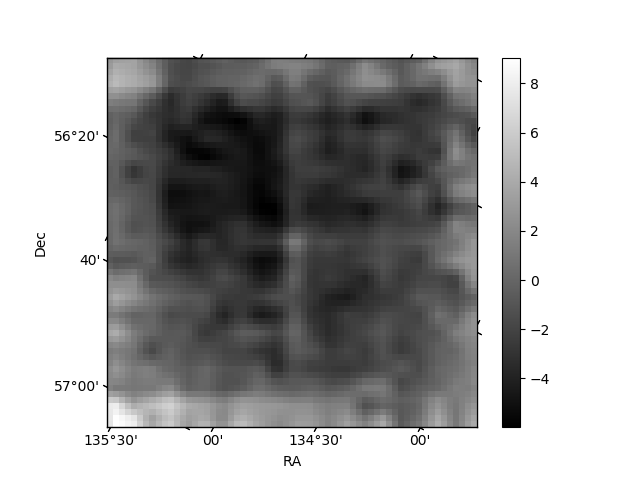
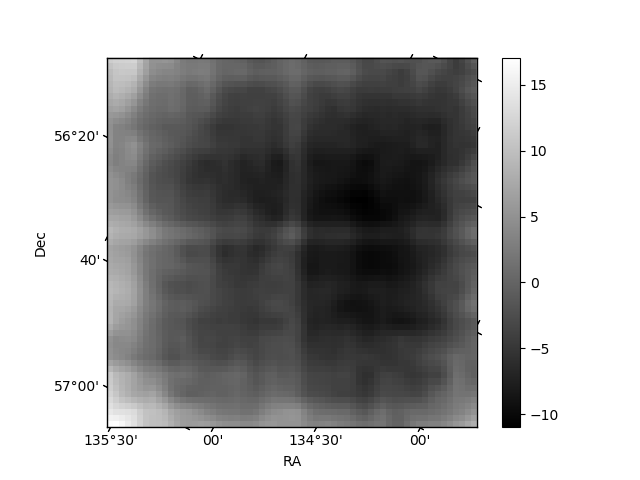
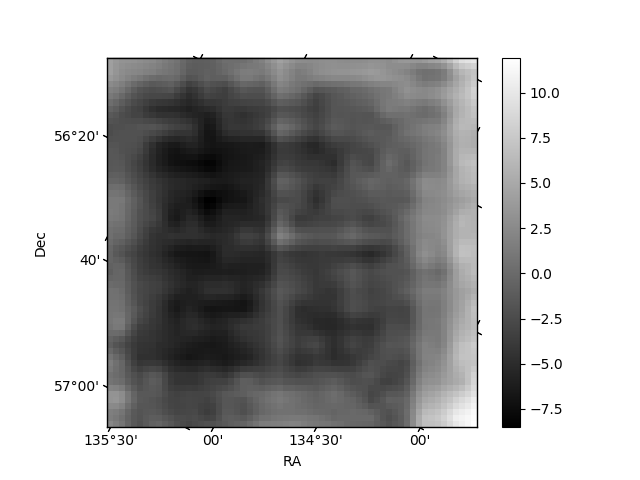
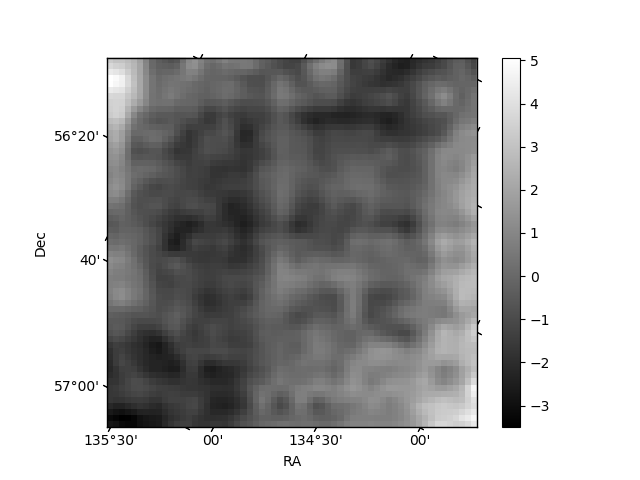
Histogram calculated using DETX and DETY for each event in the final _common_clean file
| Quadrant A | 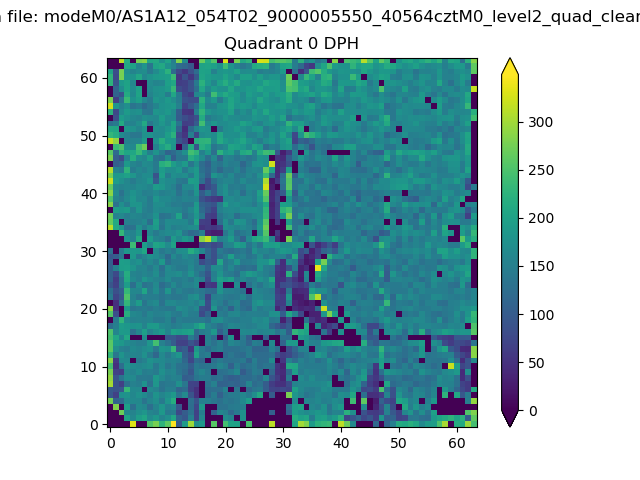 |
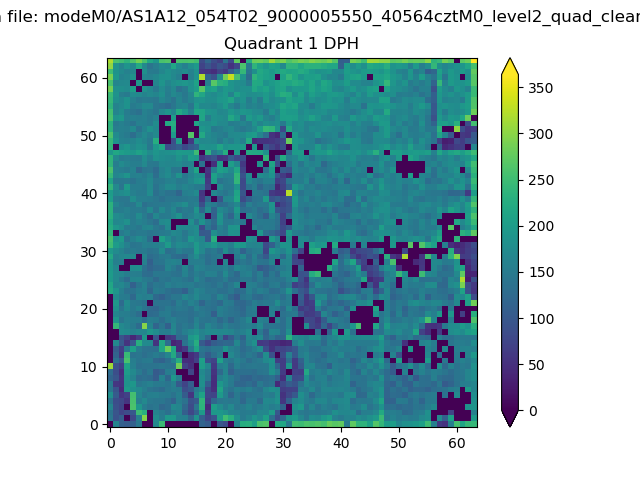 |
Quadrant B |
|---|---|---|---|
| Quadrant D | 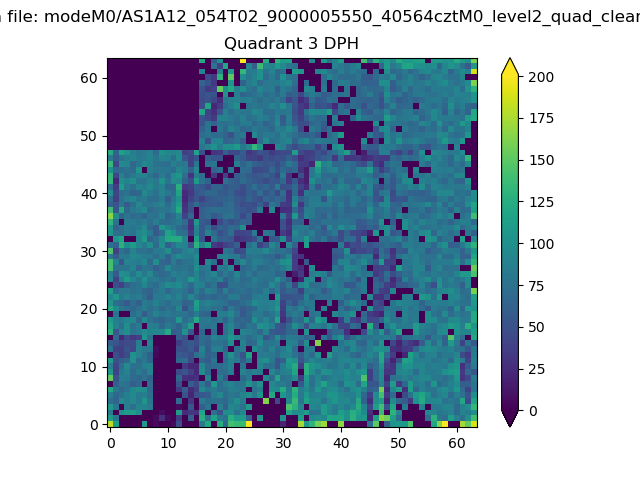 |
 |
Quadrant C |
| Plot type | Count rate plots | Images |
|---|---|---|
| Comparison with Poisson distribution Blue bars denote a histogram of data divided into 1 sec bins. Red curve is a Poisson curve with rate = median count rate of data. |
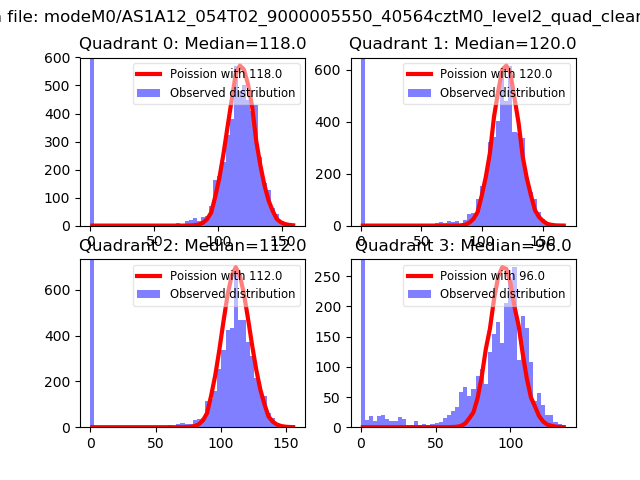 |
 |
| Quadrant-wise count rates Data is divided into 100 sec bins |
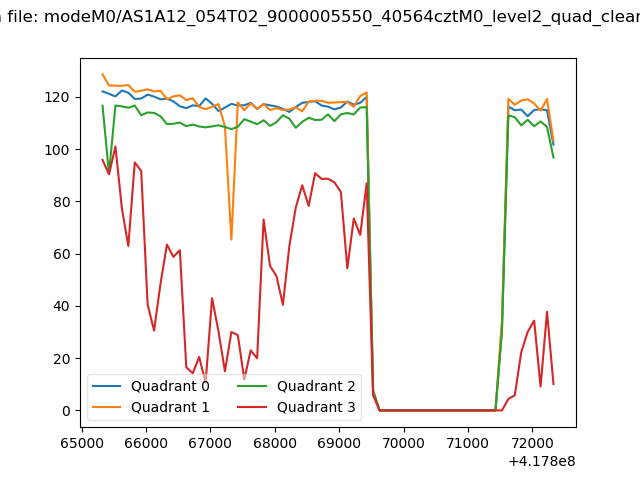 |
|
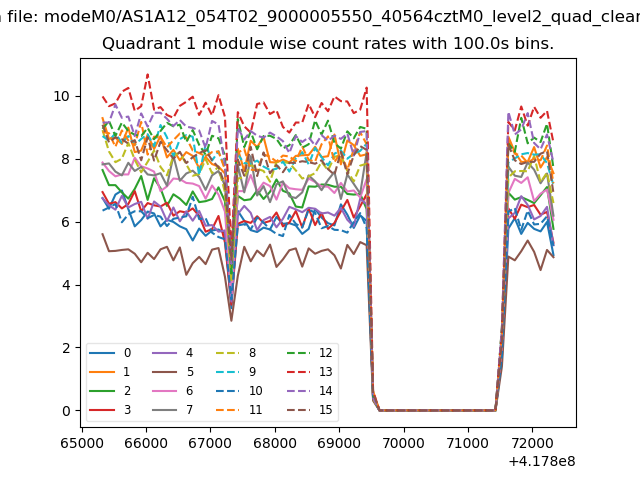
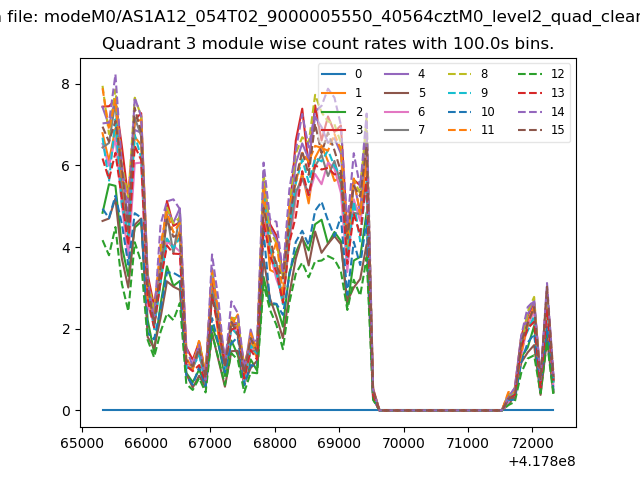
| Module-wise count rates for Quadrant A Data is divided into 100 sec bins |
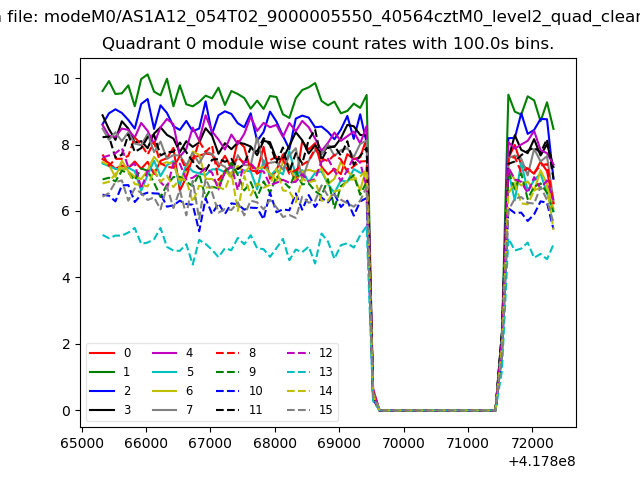 |
 |
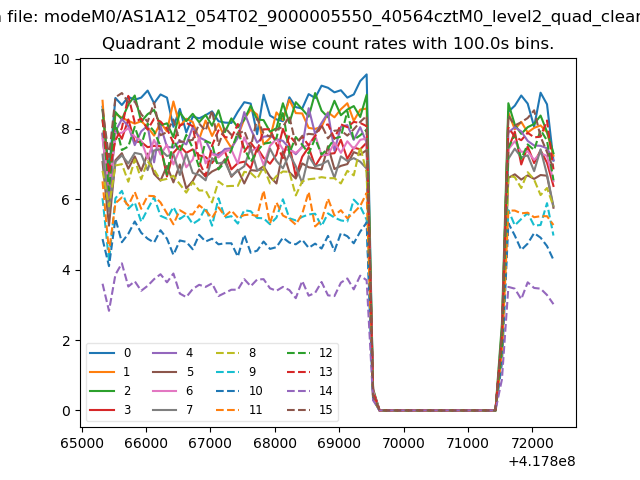
| Module-wise count rates for Quadrant B Data is divided into 100 sec bins |
 |
 |
| Module-wise count rates for Quadrant C Data is divided into 100 sec bins |
 |
 |
| Module-wise count rates for Quadrant D Data is divided into 100 sec bins |
 |
 |
| Parameter | Plot |
|---|---|
| CZT HV Monitor |  |
| D_VDD | 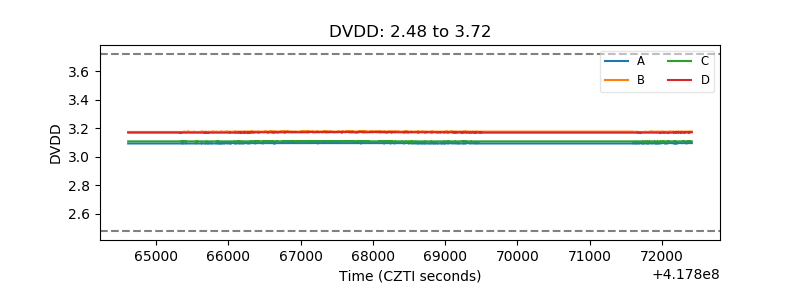 |
| Temperature 1 | 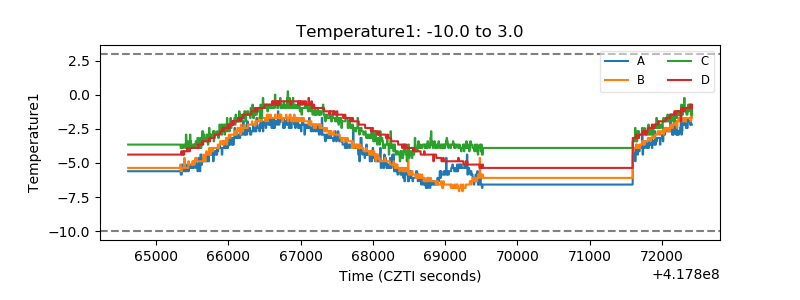 |
| Veto HV Monitor | 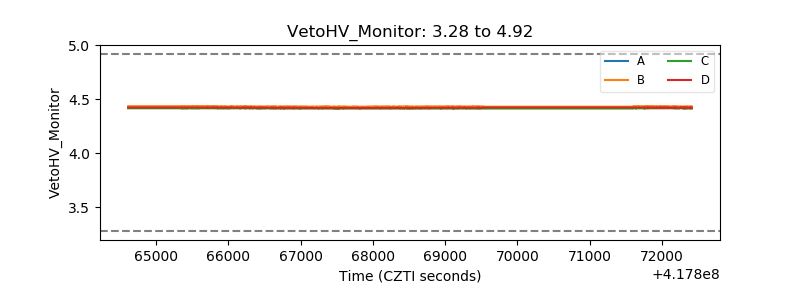 |
| Veto LLD | 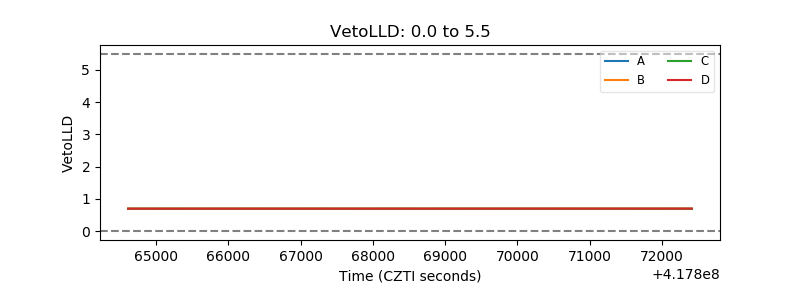 |
| Alpha Counter | 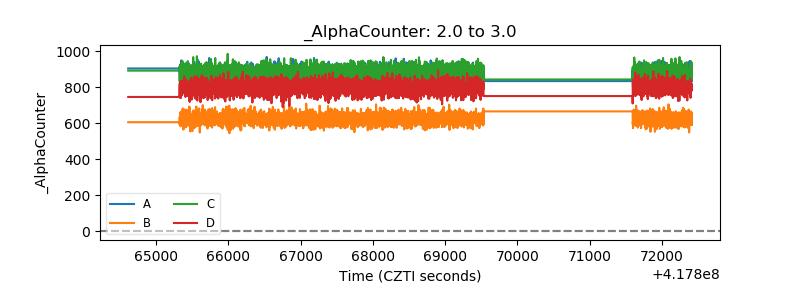 |
| _CPM_Rate | 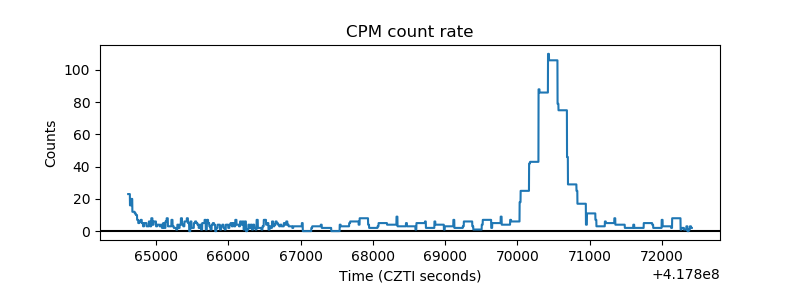 |
| CZT Counter | 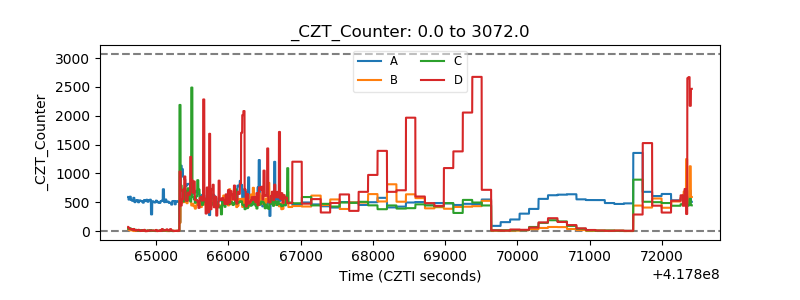 |
| +2.5 Volts monitor | 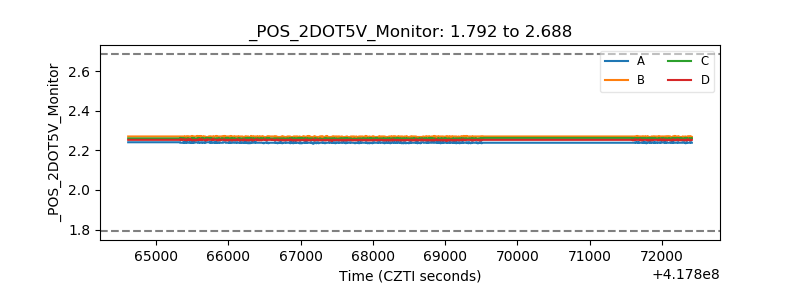 |
| +5 Volts monitor | 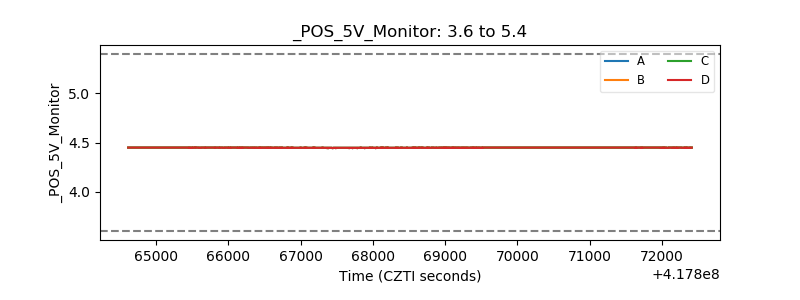 |
| _ROLL_ROT | 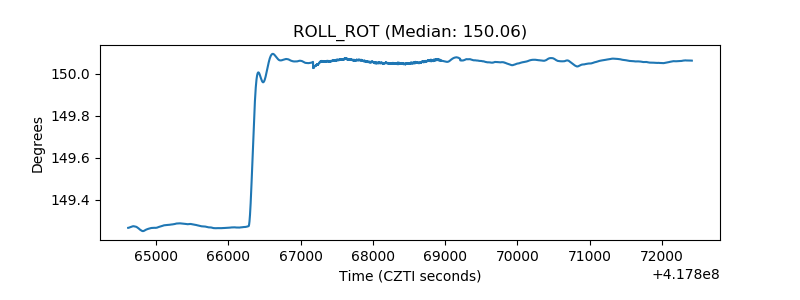 |
| _Roll_DEC | 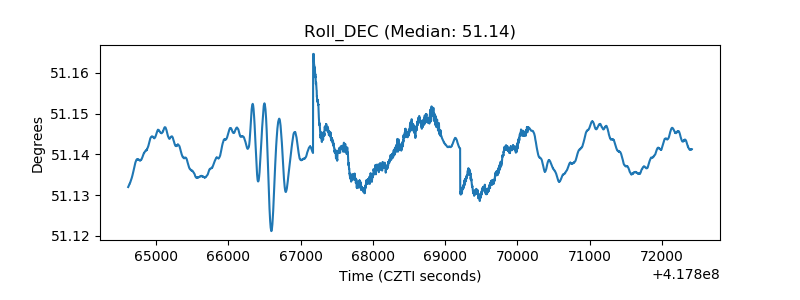 |
| _Roll_RA | 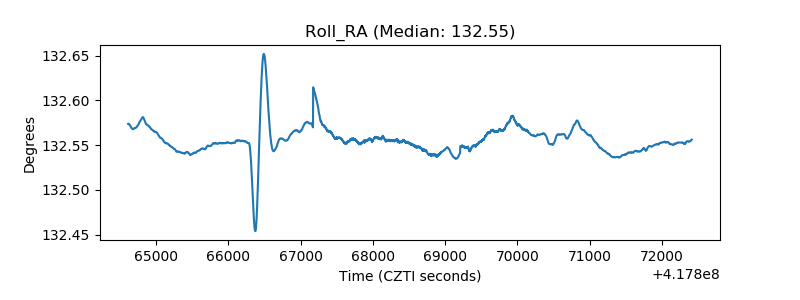 |
| Veto Counter | 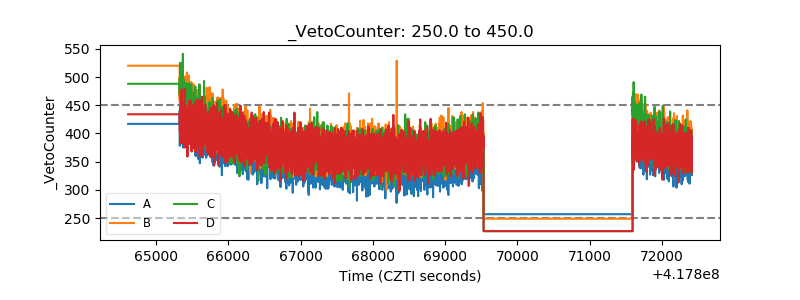 |