| Param | Original file | Final file |
|---|---|---|
| Filename | modeM0/AS1A12_054T02_9000005550_40565cztM0_level2.fits | modeM0/AS1A12_054T02_9000005550_40565cztM0_level2_quad_clean.evt |
| Size (bytes) | 347,137,920 | 79,551,360 |
| Size | 331.1 MB | 75.9 MB |
| Events in quadrant A | 2,870,353 | 613,102 |
| Events in quadrant B | 2,756,291 | 620,450 |
| Events in quadrant C | 2,530,519 | 587,491 |
| Events in quadrant D | 4,263,967 | 205,371 |
| Mode SS | |||
|---|---|---|---|
| Quadrant | BADHDUFLAG | Total packets | Discarded packets |
| A | 0 | 112 | 0 |
| B | 0 | 112 | 0 |
| C | 0 | 112 | 0 |
| D | 0 | 112 | 0 |
| Mode M0 | |||
|---|---|---|---|
| Quadrant | BADHDUFLAG | Total packets | Discarded packets |
| A | 0 | 11827 | 3 |
| B | 0 | 11778 | 2 |
| C | 0 | 11048 | 2 |
| D | 0 | 16587 | 2 |
| Mode M9 | |||
|---|---|---|---|
| Quadrant | BADHDUFLAG | Total packets | Discarded packets |
| A | 0 | 18 | 0 |
| B | 0 | 18 | 0 |
| C | 0 | 18 | 0 |
| D | 0 | 19 | 0 |
| Quadrant | Total seconds | Saturated seconds | Saturation percentage |
|---|---|---|---|
| A | 5456 | 16 | 0.293255% |
| B | 5456 | 24 | 0.439883% |
| C | 5456 | 11 | 0.201613% |
| D | 5456 | 3648 | 66.862170% |
Noise dominated data is calculated using 1-second bins in cleaned event files. If a bin has >2000 counts, and if more than 50% of those come from <1% of pixels, then it is considered to be noise-dominated and hence unusable.
| Quadrant | # 1 sec bins | Bins with >0 counts | Bins with >2000 counts | High rate bins dominated by noise | Noise dominated (total time) | Noise dominated (detector-on time) | Marked lightcurve |
|---|---|---|---|---|---|---|---|
| A | 7279 | 5457 | 2 | 2 | 0.03% | 0.04% | 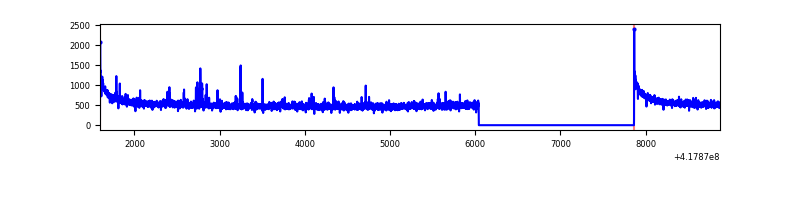 |
| B | 7279 | 5457 | 11 | 11 | 0.15% | 0.20% | 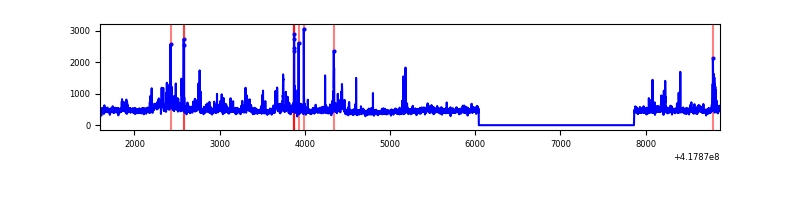 |
| C | 7279 | 5457 | 7 | 7 | 0.10% | 0.13% | 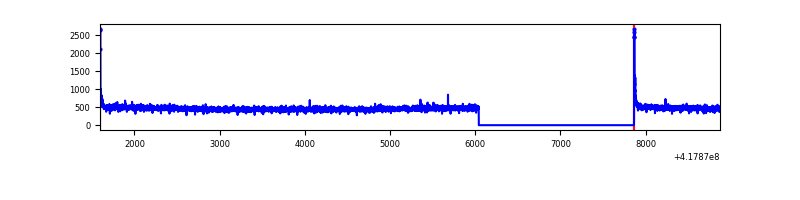 |
| D | 7278 | 5456 | 414 | 414 | 5.69% | 7.59% | 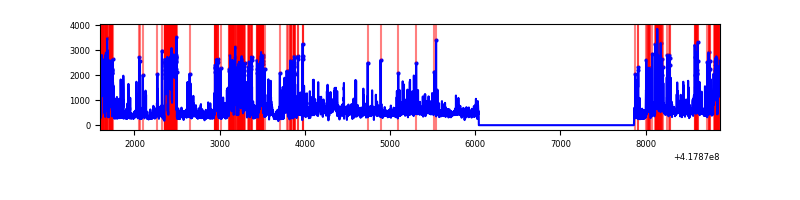 |
Top three noisy pixels from each quadrant. If the there are fewer than three noisy pixels in the level2.evt file, extra rows are filled as -1
| Pixel properties | Quadrant properties | ||||||
|---|---|---|---|---|---|---|---|
| Quadrant | DetID | PixID | Counts | Sigma | Mean | Median | Sigma |
| A | 10 | 83 | 507231 | 4184.87 | 594 | 581 | 121.1 |
| A | 12 | 189 | 33026 | 267.99 | 594 | 581 | 121.1 |
| A | 2 | 79 | 22261 | 179.07 | 594 | 581 | 121.1 |
| B | 3 | 112 | 188547 | 1673.5 | 585 | 569 | 112.3 |
| B | 4 | 171 | 89148 | 788.59 | 585 | 569 | 112.3 |
| B | 15 | 85 | 42642 | 374.56 | 585 | 569 | 112.3 |
| C | 15 | 214 | 241417 | 1795.57 | 576 | 579 | 134.1 |
| C | 0 | 10 | 36227 | 265.77 | 576 | 579 | 134.1 |
| C | 13 | 61 | 3965 | 25.24 | 576 | 579 | 134.1 |
| D | 12 | 227 | 1691765 | 18736.23 | 361 | 351 | 90.3 |
| D | 12 | 191 | 499052 | 5524.24 | 361 | 351 | 90.3 |
| D | 12 | 79 | 260777 | 2884.8 | 361 | 351 | 90.3 |
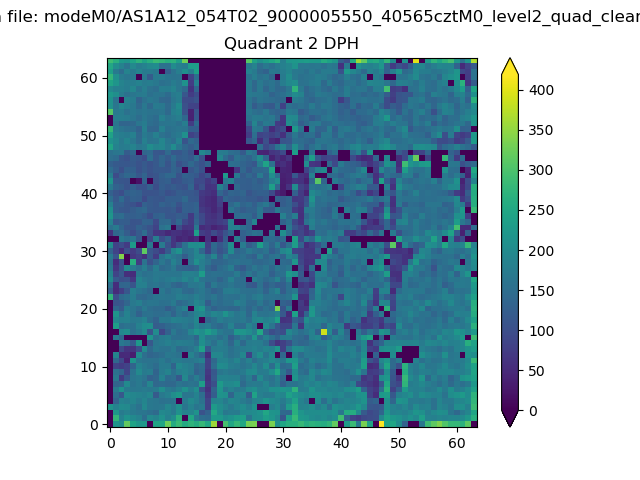
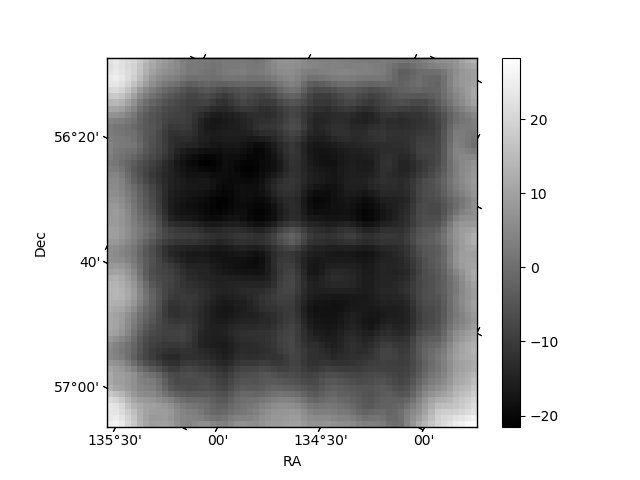
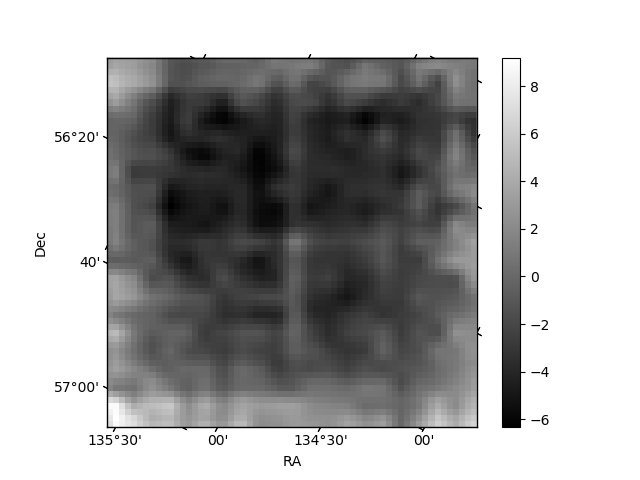
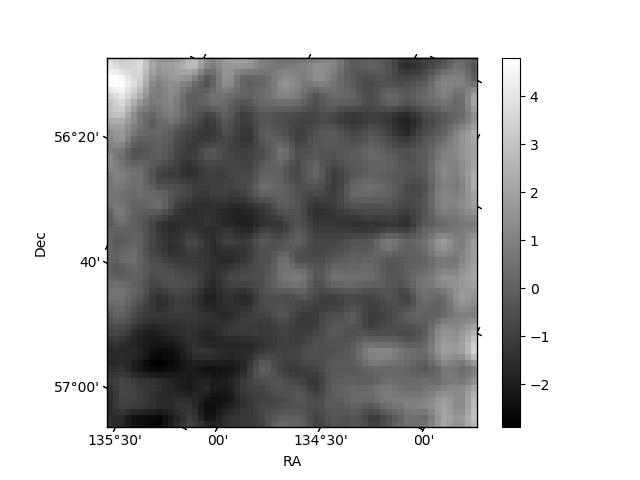
Histogram calculated using DETX and DETY for each event in the final _common_clean file
| Quadrant A | 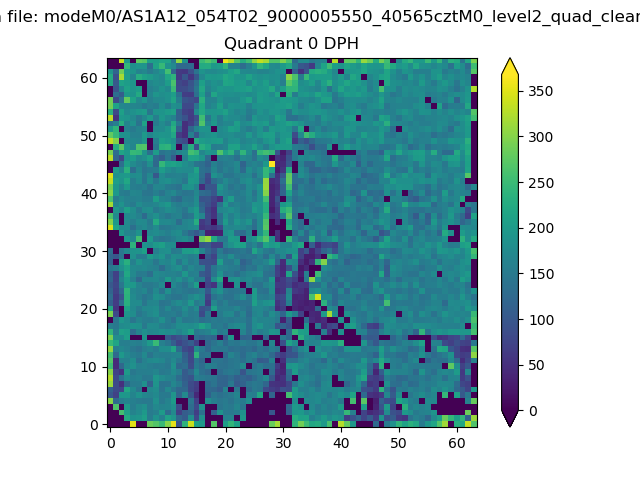 |
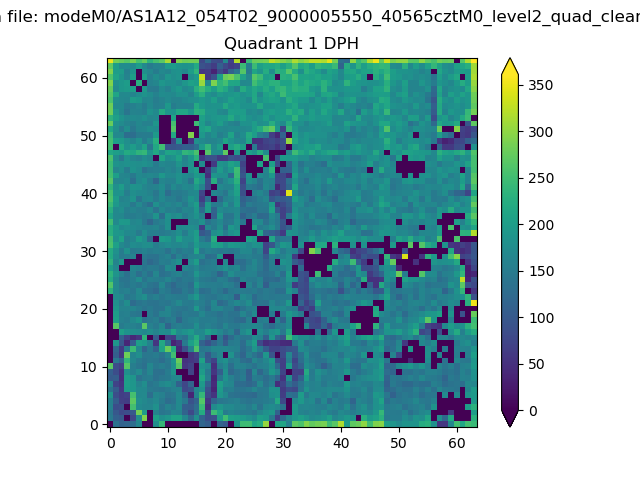 |
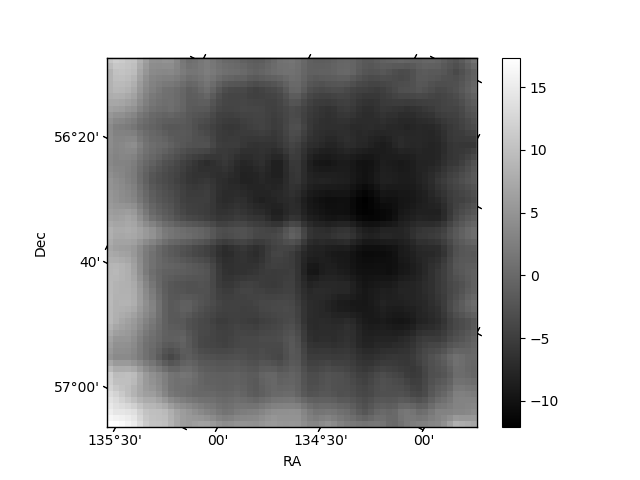
Quadrant B |
|---|---|---|---|
| Quadrant D | 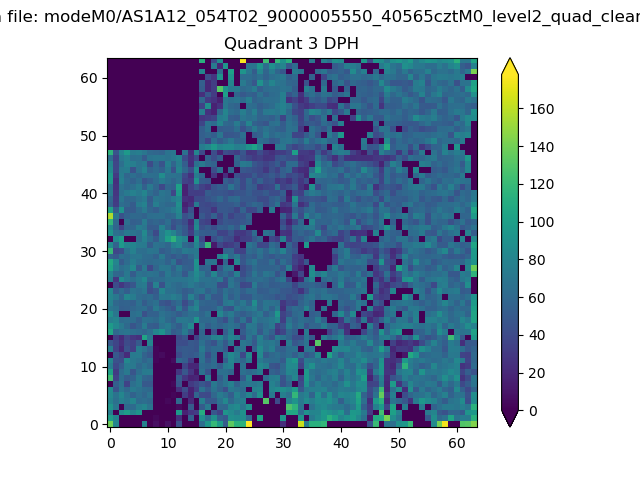 |
 |
Quadrant C |
| Plot type | Count rate plots | Images |
|---|---|---|
| Comparison with Poisson distribution Blue bars denote a histogram of data divided into 1 sec bins. Red curve is a Poisson curve with rate = median count rate of data. |
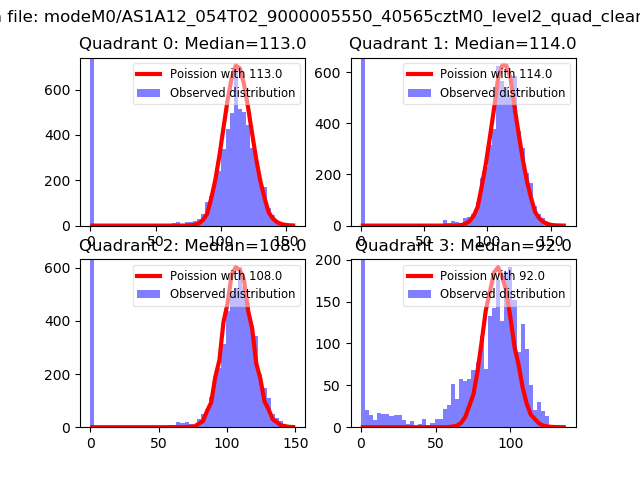 |
 |
| Quadrant-wise count rates Data is divided into 100 sec bins |
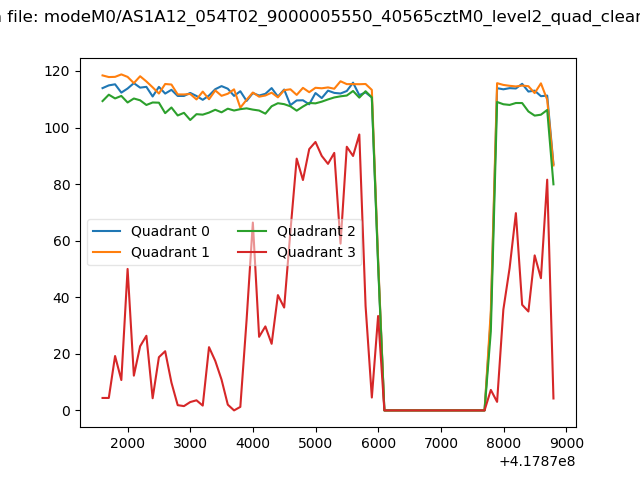 |
|
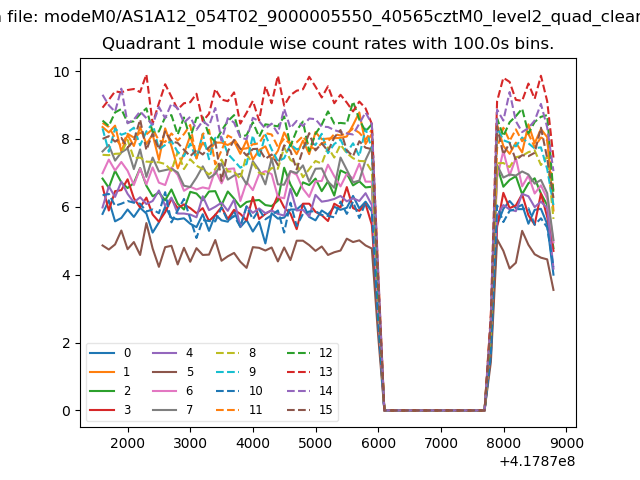
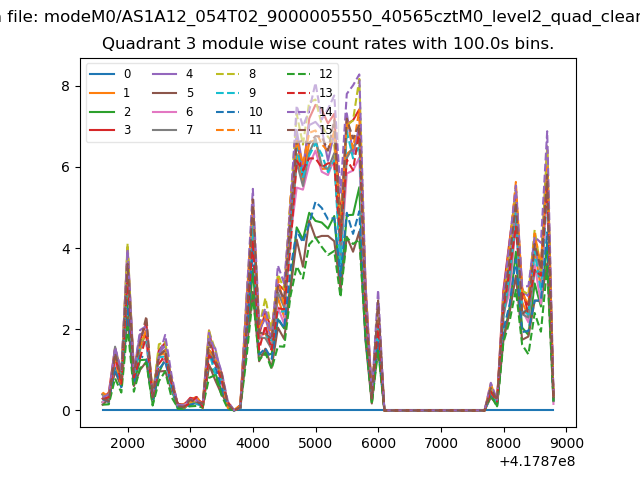
| Module-wise count rates for Quadrant A Data is divided into 100 sec bins |
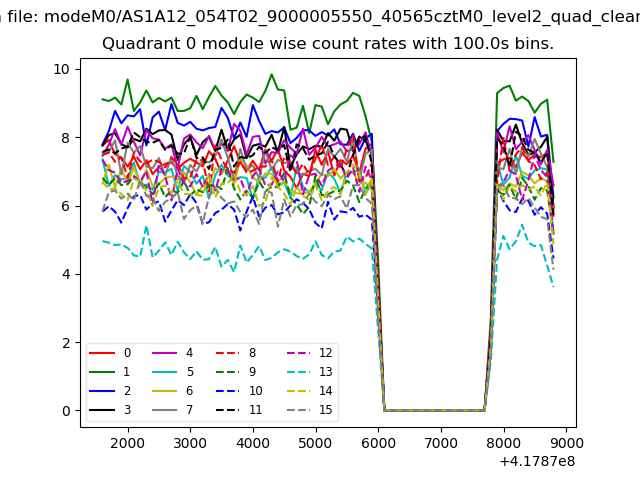 |
 |
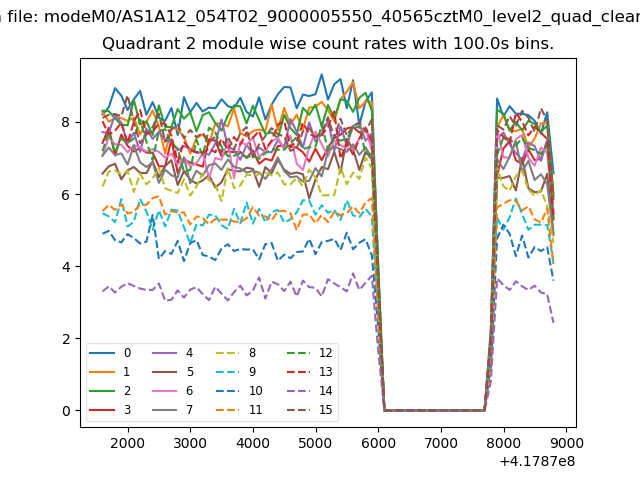
| Module-wise count rates for Quadrant B Data is divided into 100 sec bins |
 |
 |
| Module-wise count rates for Quadrant C Data is divided into 100 sec bins |
 |
 |
| Module-wise count rates for Quadrant D Data is divided into 100 sec bins |
 |
 |
| Parameter | Plot |
|---|---|
| CZT HV Monitor |  |
| D_VDD | 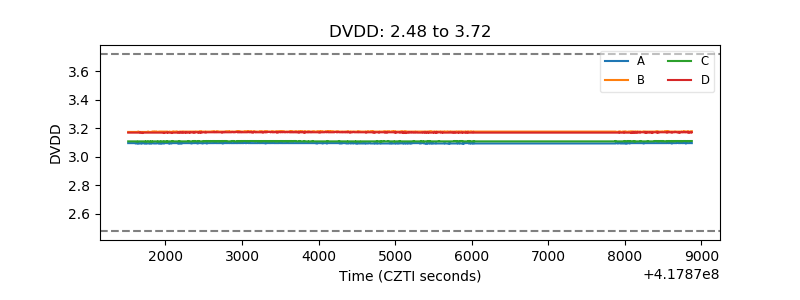 |
| Temperature 1 | 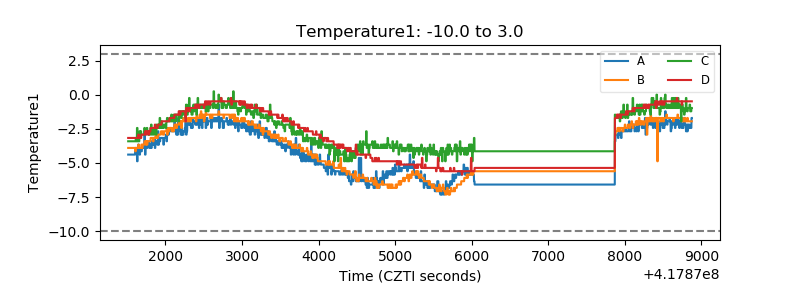 |
| Veto HV Monitor | 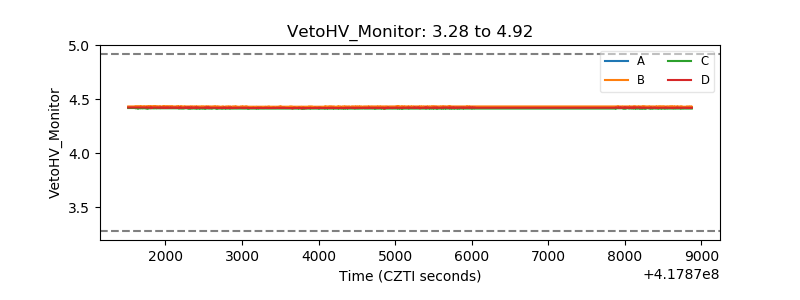 |
| Veto LLD | 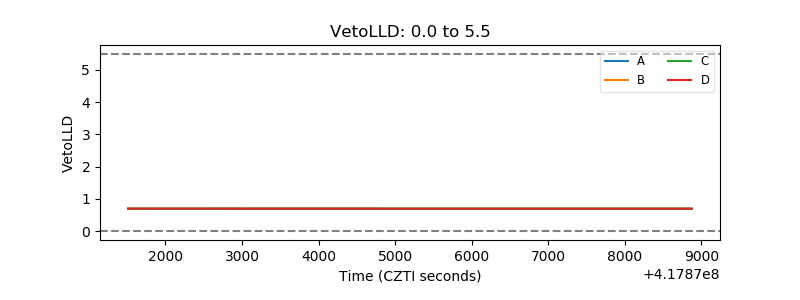 |
| Alpha Counter | 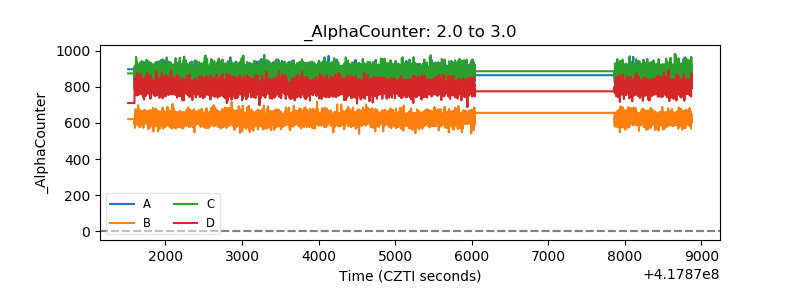 |
| _CPM_Rate | 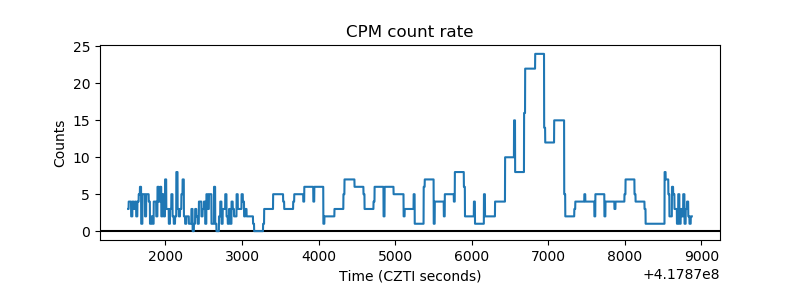 |
| CZT Counter | 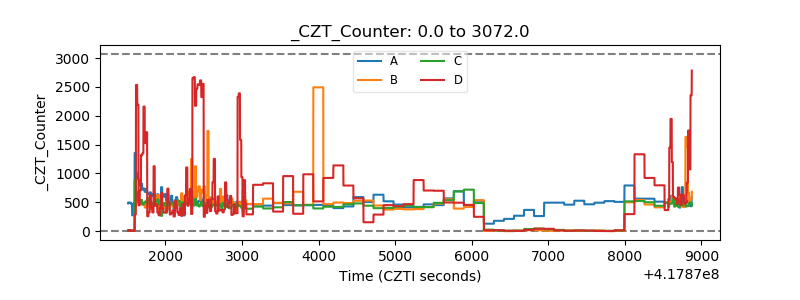 |
| +2.5 Volts monitor |  |
| +5 Volts monitor | 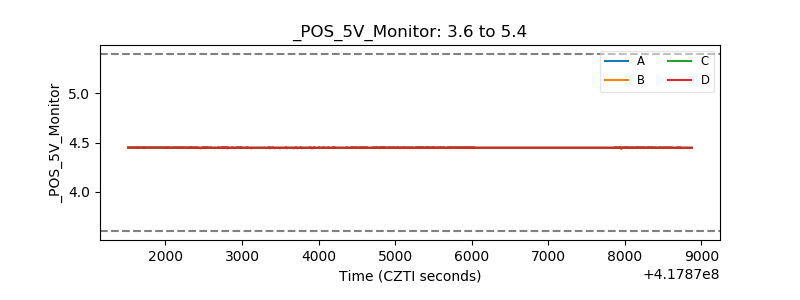 |
| _ROLL_ROT | 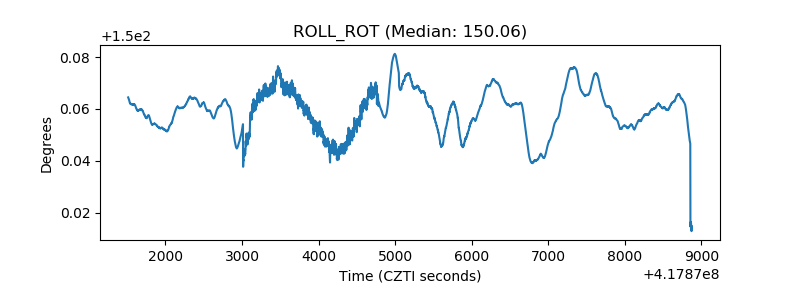 |
| _Roll_DEC | 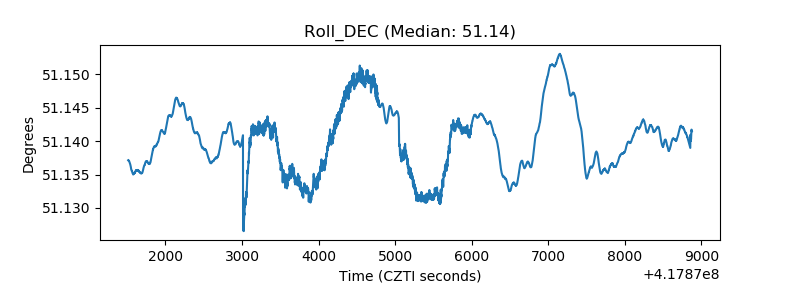 |
| _Roll_RA | 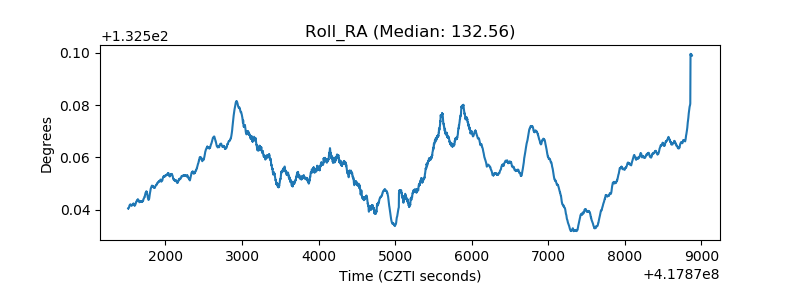 |
| Veto Counter | 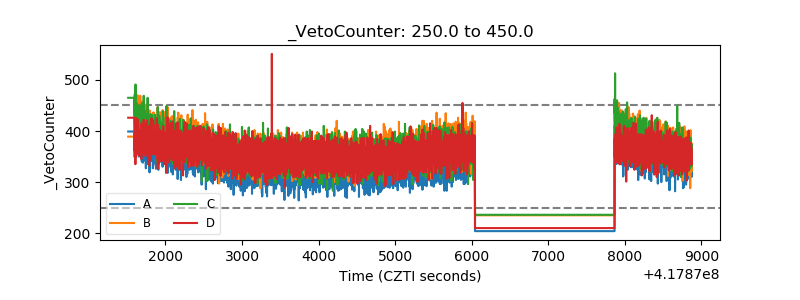 |