| Param | Original file | Final file |
|---|---|---|
| Filename | modeM0/AS1A12_054T02_9000005550_40566cztM0_level2.fits | modeM0/AS1A12_054T02_9000005550_40566cztM0_level2_quad_clean.evt |
| Size (bytes) | 378,993,600 | 82,601,280 |
| Size | 361.4 MB | 78.8 MB |
| Events in quadrant A | 3,023,179 | 636,138 |
| Events in quadrant B | 2,858,200 | 642,569 |
| Events in quadrant C | 2,719,912 | 610,808 |
| Events in quadrant D | 4,976,558 | 209,495 |
| Mode SS | |||
|---|---|---|---|
| Quadrant | BADHDUFLAG | Total packets | Discarded packets |
| A | 0 | 118 | 0 |
| B | 0 | 118 | 0 |
| C | 0 | 118 | 0 |
| D | 0 | 118 | 0 |
| Mode M0 | |||
|---|---|---|---|
| Quadrant | BADHDUFLAG | Total packets | Discarded packets |
| A | 0 | 12655 | 3 |
| B | 0 | 12265 | 2 |
| C | 0 | 11843 | 2 |
| D | 0 | 18887 | 2 |
| Mode M9 | |||
|---|---|---|---|
| Quadrant | BADHDUFLAG | Total packets | Discarded packets |
| A | 0 | 16 | 0 |
| B | 0 | 16 | 0 |
| C | 0 | 16 | 0 |
| D | 0 | 17 | 0 |
| Quadrant | Total seconds | Saturated seconds | Saturation percentage |
|---|---|---|---|
| A | 5745 | 12 | 0.208877% |
| B | 5745 | 20 | 0.348129% |
| C | 5745 | 23 | 0.400348% |
| D | 5745 | 3969 | 69.086162% |
Noise dominated data is calculated using 1-second bins in cleaned event files. If a bin has >2000 counts, and if more than 50% of those come from <1% of pixels, then it is considered to be noise-dominated and hence unusable.
| Quadrant | # 1 sec bins | Bins with >0 counts | Bins with >2000 counts | High rate bins dominated by noise | Noise dominated (total time) | Noise dominated (detector-on time) | Marked lightcurve |
|---|---|---|---|---|---|---|---|
| A | 7208 | 5746 | 2 | 2 | 0.03% | 0.03% | 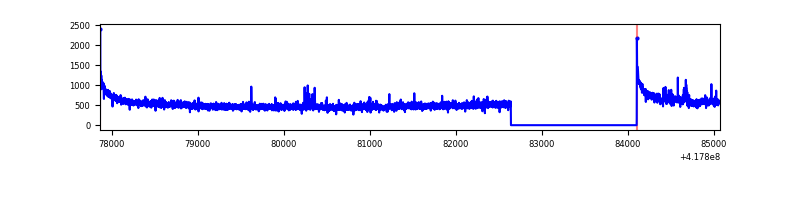 |
| B | 7208 | 5746 | 11 | 11 | 0.15% | 0.19% | 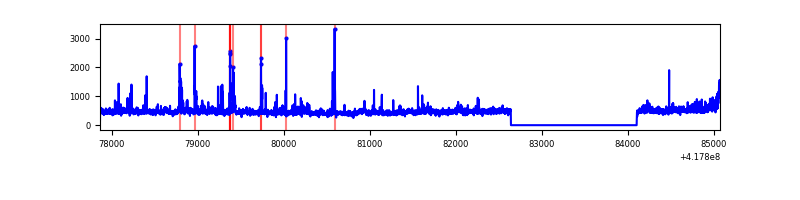 |
| C | 7208 | 5746 | 15 | 15 | 0.21% | 0.26% | 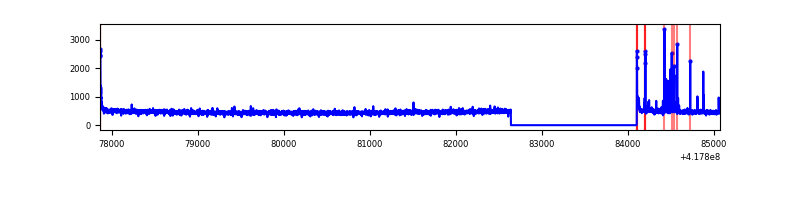 |
| D | 7208 | 5746 | 473 | 473 | 6.56% | 8.23% | 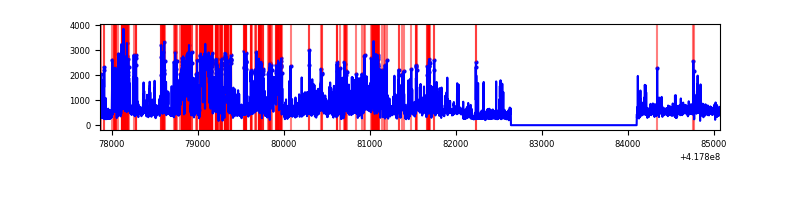 |
Top three noisy pixels from each quadrant. If the there are fewer than three noisy pixels in the level2.evt file, extra rows are filled as -1
| Pixel properties | Quadrant properties | ||||||
|---|---|---|---|---|---|---|---|
| Quadrant | DetID | PixID | Counts | Sigma | Mean | Median | Sigma |
| A | 10 | 83 | 532586 | 4223.81 | 619 | 606 | 125.9 |
| A | 15 | 191 | 55362 | 434.75 | 619 | 606 | 125.9 |
| A | 12 | 189 | 18644 | 143.22 | 619 | 606 | 125.9 |
| B | 3 | 112 | 176768 | 1491.51 | 612 | 595 | 118.1 |
| B | 15 | 85 | 92980 | 782.15 | 612 | 595 | 118.1 |
| B | 7 | 202 | 69955 | 587.21 | 612 | 595 | 118.1 |
| C | 15 | 214 | 251623 | 1778.91 | 604 | 608 | 141.1 |
| C | 14 | 254 | 64485 | 452.69 | 604 | 608 | 141.1 |
| C | 0 | 10 | 38516 | 268.65 | 604 | 608 | 141.1 |
| D | 12 | 227 | 1818929 | 18262.23 | 400 | 389 | 99.6 |
| D | 12 | 191 | 505302 | 5070.46 | 400 | 389 | 99.6 |
| D | 12 | 0 | 437225 | 4386.82 | 400 | 389 | 99.6 |
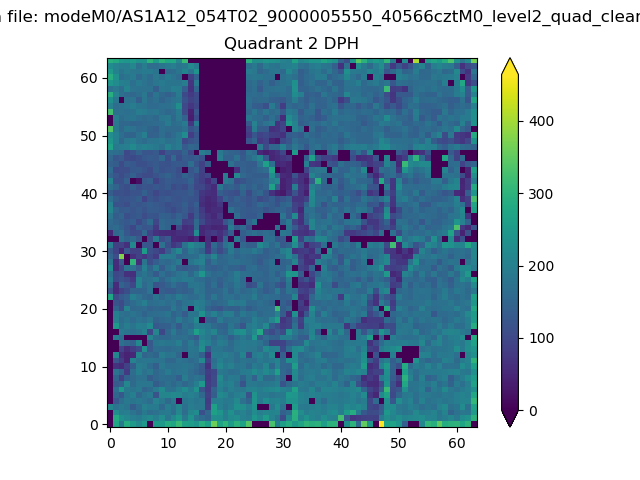
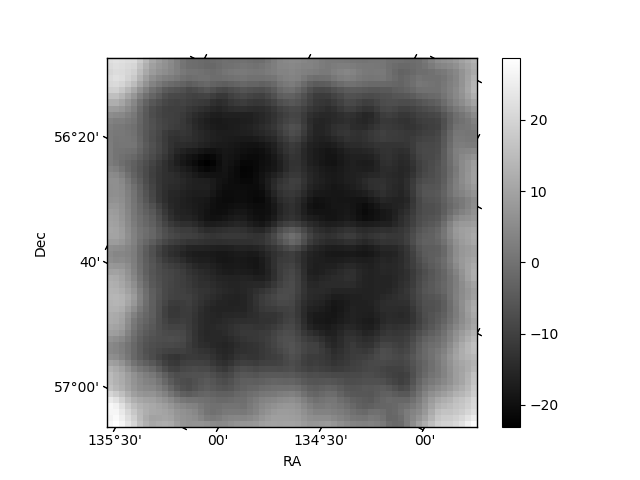
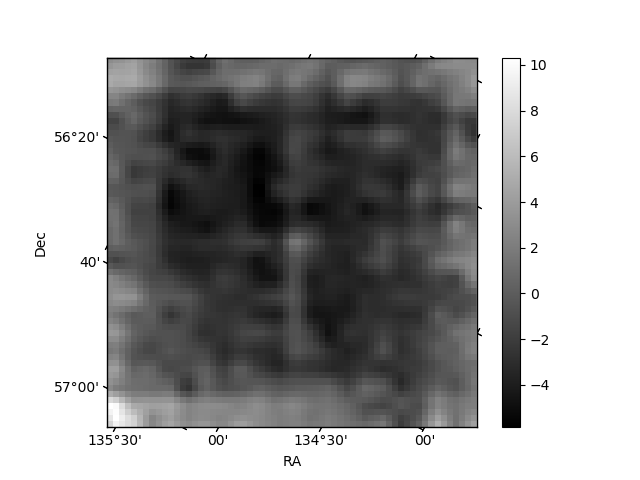
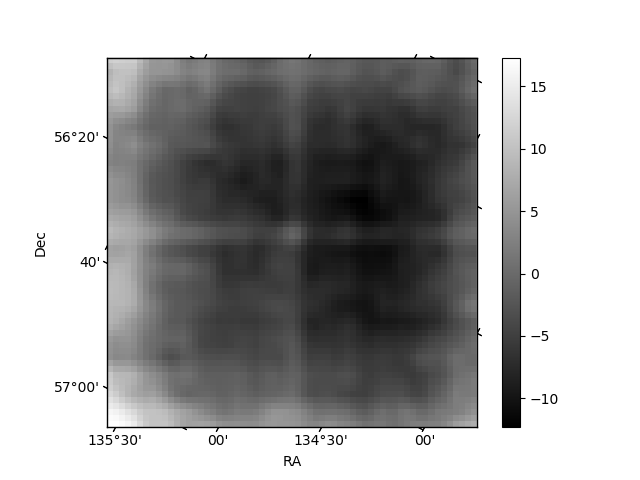
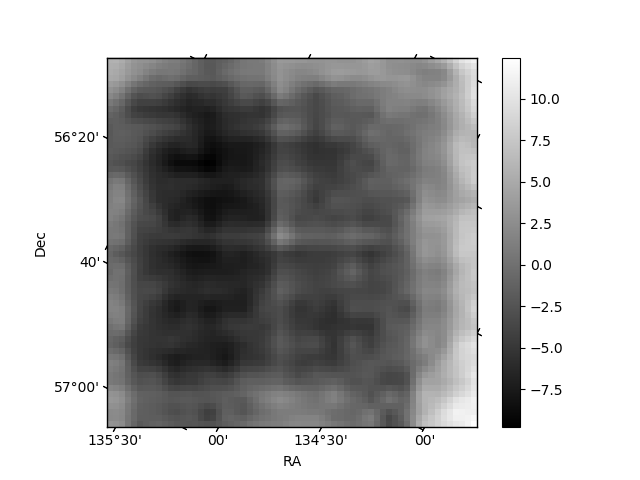
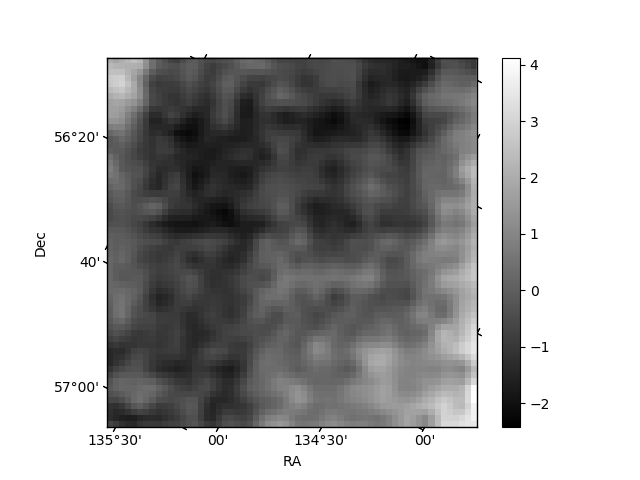
Histogram calculated using DETX and DETY for each event in the final _common_clean file
| Quadrant A | 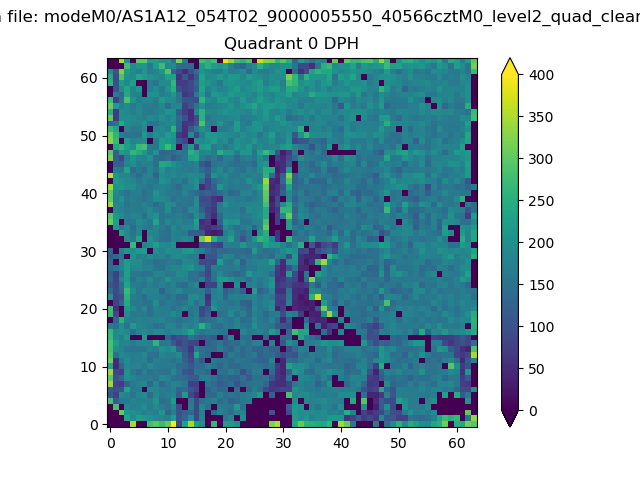 |
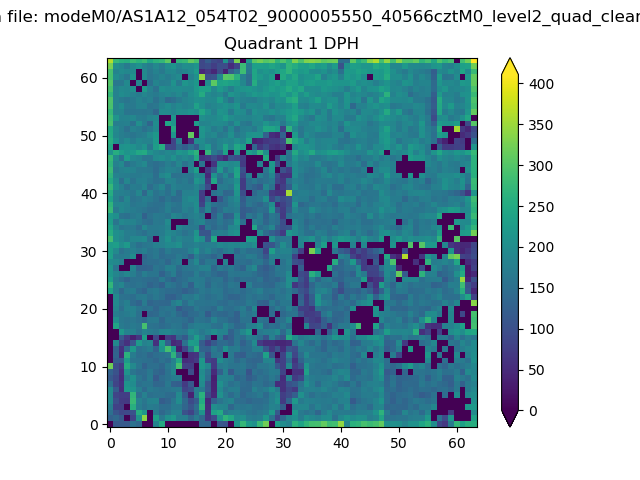 |
Quadrant B |
|---|---|---|---|
| Quadrant D | 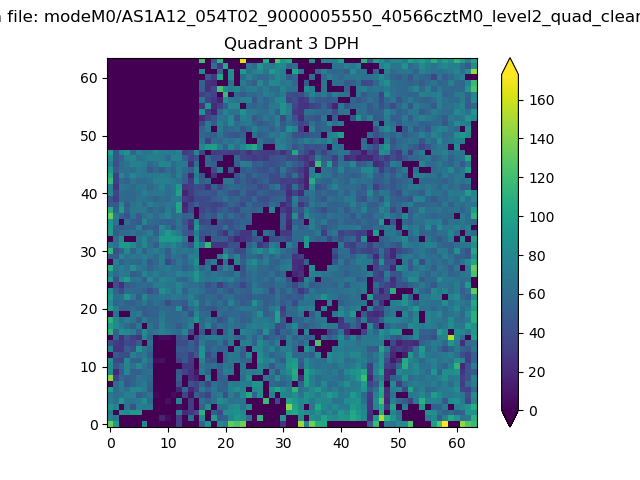 |
 |
Quadrant C |
| Plot type | Count rate plots | Images |
|---|---|---|
| Comparison with Poisson distribution Blue bars denote a histogram of data divided into 1 sec bins. Red curve is a Poisson curve with rate = median count rate of data. |
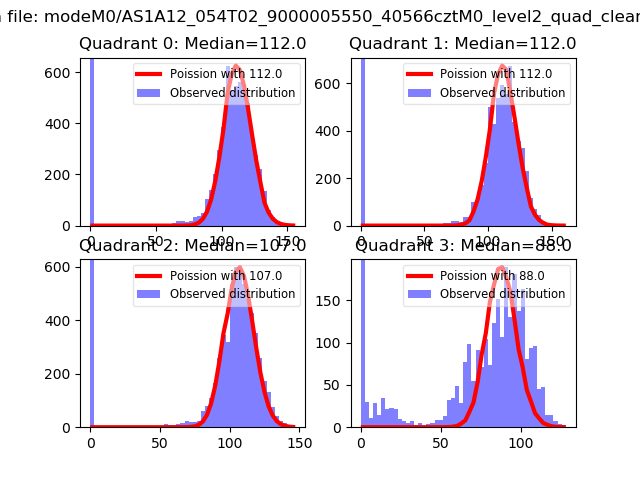 |
 |
| Quadrant-wise count rates Data is divided into 100 sec bins |
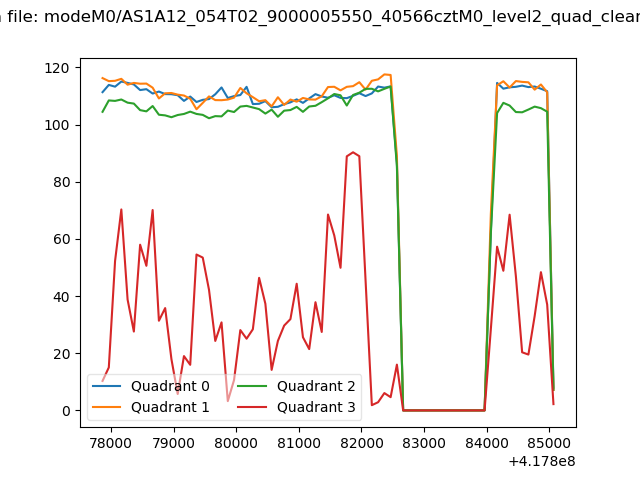 |
|
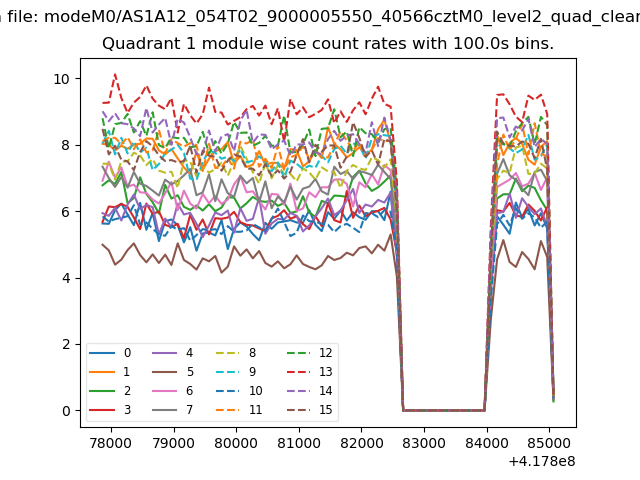
| Module-wise count rates for Quadrant A Data is divided into 100 sec bins |
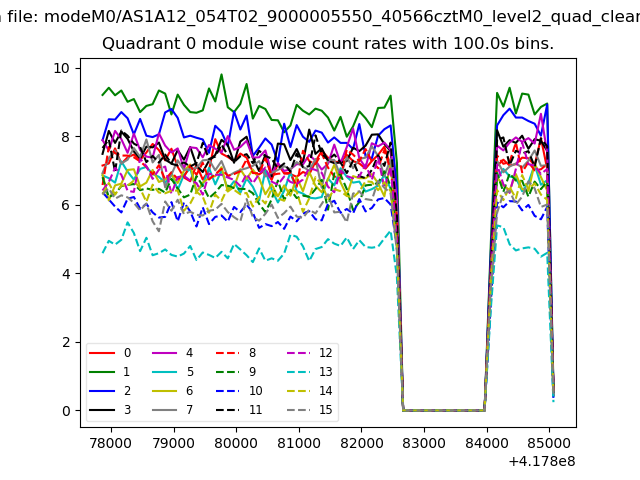 |
 |
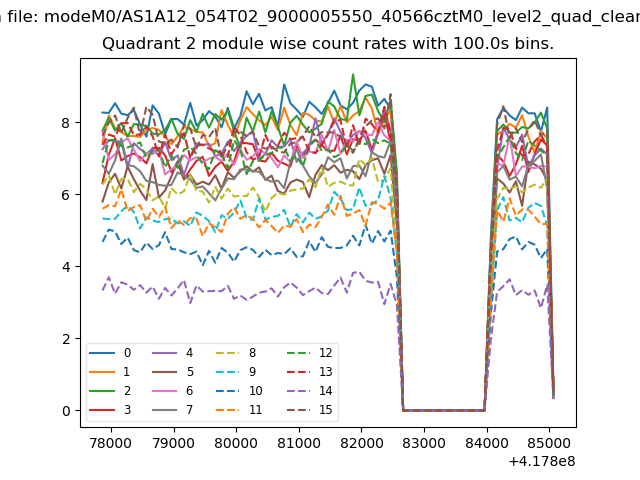
| Module-wise count rates for Quadrant B Data is divided into 100 sec bins |
 |
 |
| Module-wise count rates for Quadrant C Data is divided into 100 sec bins |
 |
 |
| Module-wise count rates for Quadrant D Data is divided into 100 sec bins |
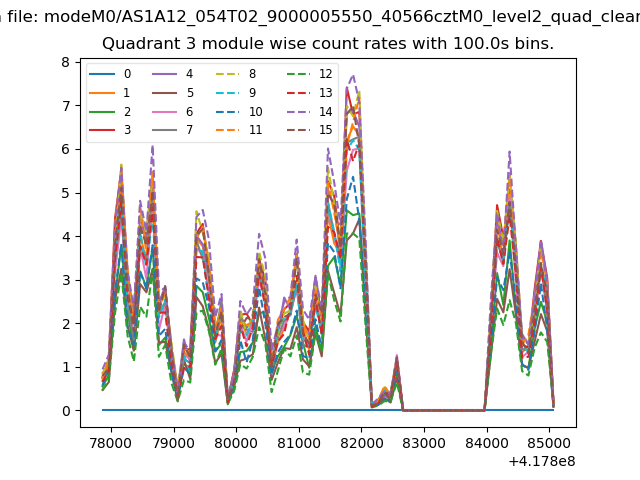 |
 |
| Parameter | Plot |
|---|---|
| CZT HV Monitor | 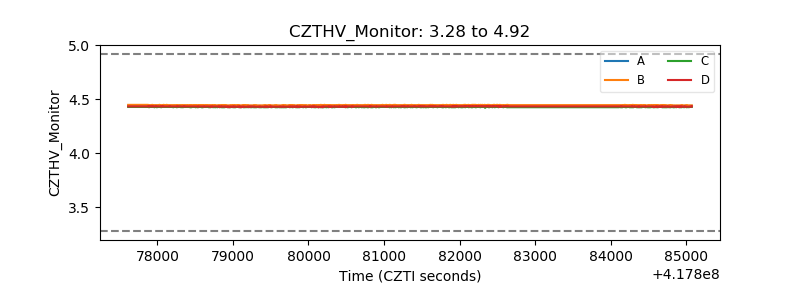 |
| D_VDD | 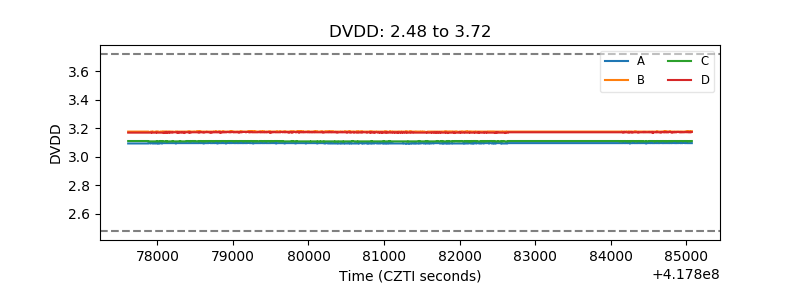 |
| Temperature 1 | 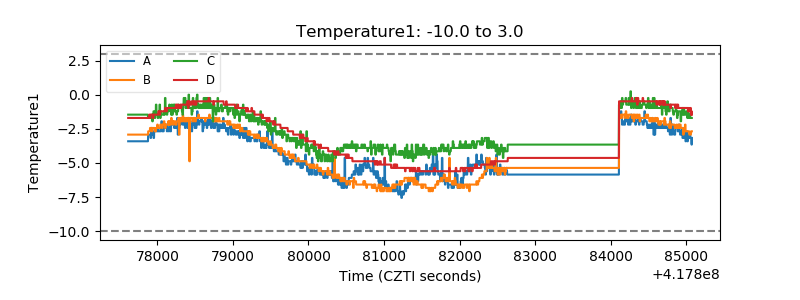 |
| Veto HV Monitor |  |
| Veto LLD | 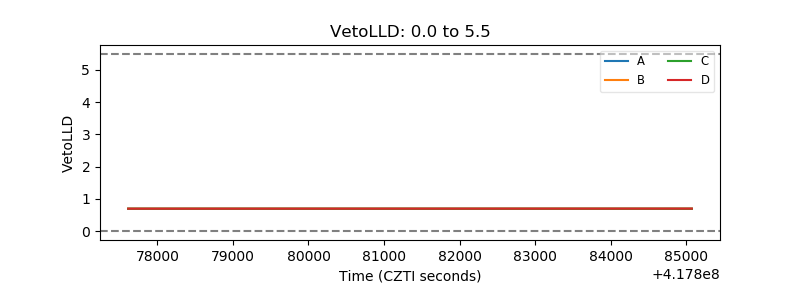 |
| Alpha Counter | 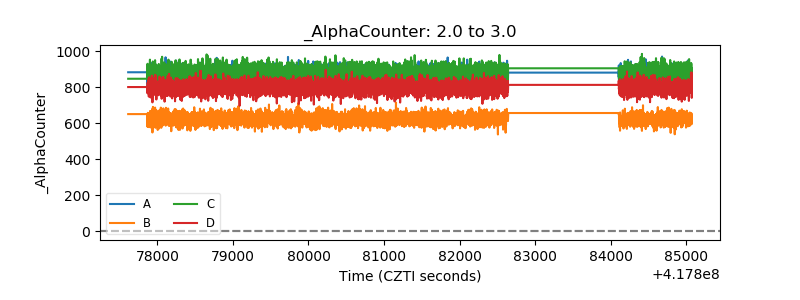 |
| _CPM_Rate | 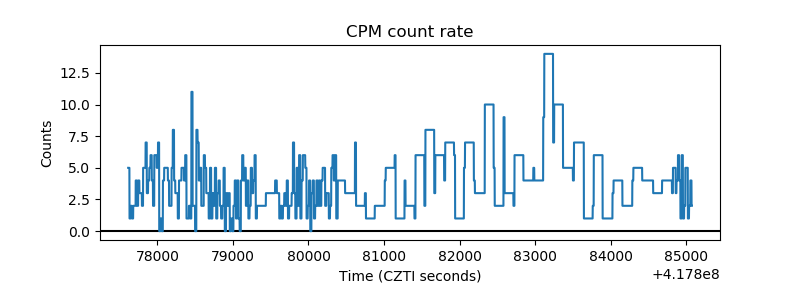 |
| CZT Counter | 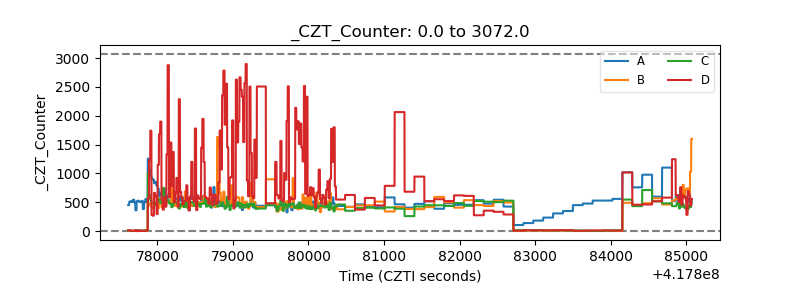 |
| +2.5 Volts monitor | 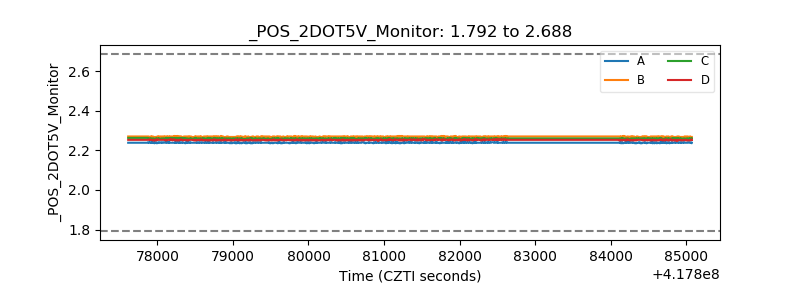 |
| +5 Volts monitor | 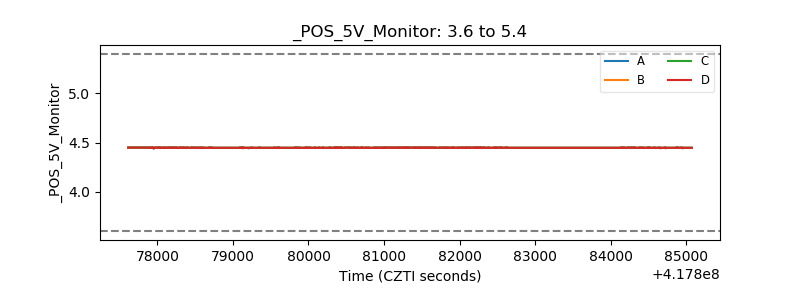 |
| _ROLL_ROT | 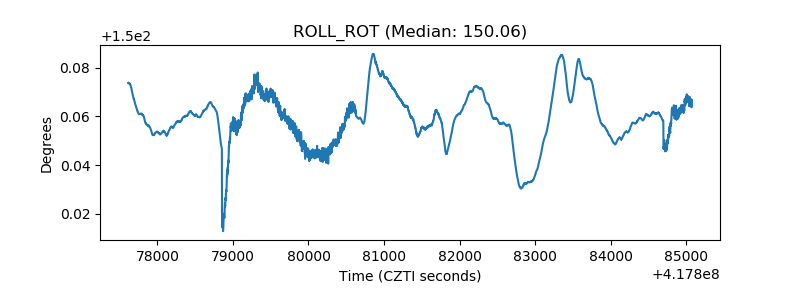 |
| _Roll_DEC | 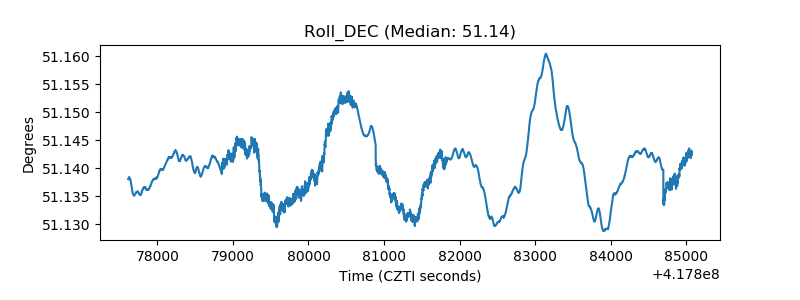 |
| _Roll_RA | 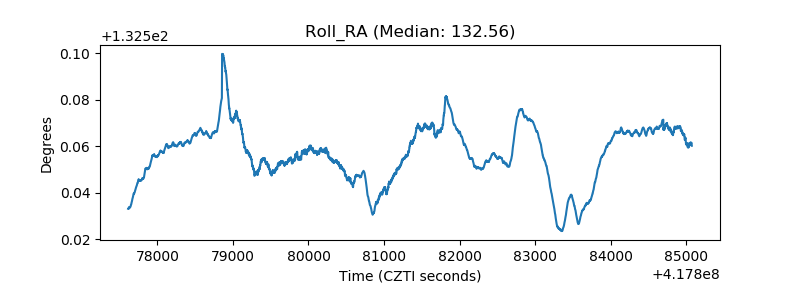 |
| Veto Counter | 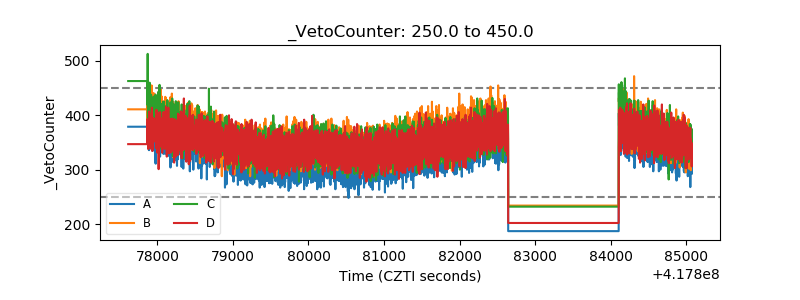 |