| Param | Original file | Final file |
|---|---|---|
| Filename | modeM0/AS1A12_054T02_9000005550_40567cztM0_level2.fits | modeM0/AS1A12_054T02_9000005550_40567cztM0_level2_quad_clean.evt |
| Size (bytes) | 410,713,920 | 89,006,400 |
| Size | 391.7 MB | 84.9 MB |
| Events in quadrant A | 3,283,240 | 639,926 |
| Events in quadrant B | 4,682,461 | 637,605 |
| Events in quadrant C | 2,772,295 | 617,969 |
| Events in quadrant D | 4,008,779 | 390,565 |
| Mode SS | |||
|---|---|---|---|
| Quadrant | BADHDUFLAG | Total packets | Discarded packets |
| A | 0 | 120 | 0 |
| B | 0 | 120 | 0 |
| C | 0 | 120 | 0 |
| D | 0 | 120 | 0 |
| Mode M0 | |||
|---|---|---|---|
| Quadrant | BADHDUFLAG | Total packets | Discarded packets |
| A | 0 | 13479 | 3 |
| B | 0 | 18021 | 2 |
| C | 0 | 12053 | 2 |
| D | 0 | 15963 | 2 |
| Mode M9 | |||
|---|---|---|---|
| Quadrant | BADHDUFLAG | Total packets | Discarded packets |
| A | 0 | 17 | 0 |
| B | 0 | 17 | 0 |
| C | 0 | 17 | 0 |
| D | 0 | 18 | 0 |
| Quadrant | Total seconds | Saturated seconds | Saturation percentage |
|---|---|---|---|
| A | 5845 | 13 | 0.222412% |
| B | 5845 | 156 | 2.668948% |
| C | 5845 | 22 | 0.376390% |
| D | 5845 | 2147 | 36.732250% |
Noise dominated data is calculated using 1-second bins in cleaned event files. If a bin has >2000 counts, and if more than 50% of those come from <1% of pixels, then it is considered to be noise-dominated and hence unusable.
| Quadrant | # 1 sec bins | Bins with >0 counts | Bins with >2000 counts | High rate bins dominated by noise | Noise dominated (total time) | Noise dominated (detector-on time) | Marked lightcurve |
|---|---|---|---|---|---|---|---|
| A | 7157 | 5846 | 4 | 4 | 0.06% | 0.07% | 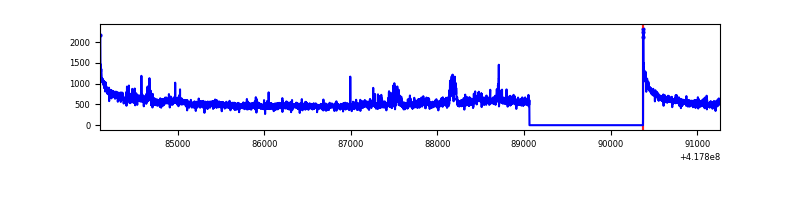 |
| B | 7157 | 5846 | 81 | 81 | 1.13% | 1.39% | 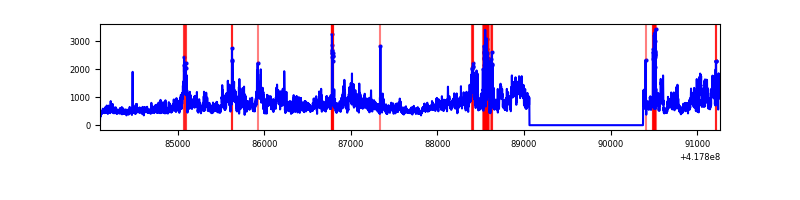 |
| C | 7157 | 5846 | 14 | 14 | 0.20% | 0.24% | 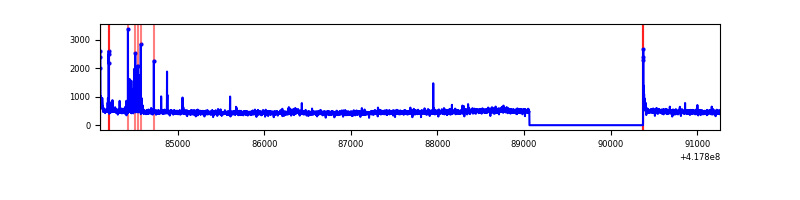 |
| D | 7156 | 5845 | 103 | 103 | 1.44% | 1.76% | 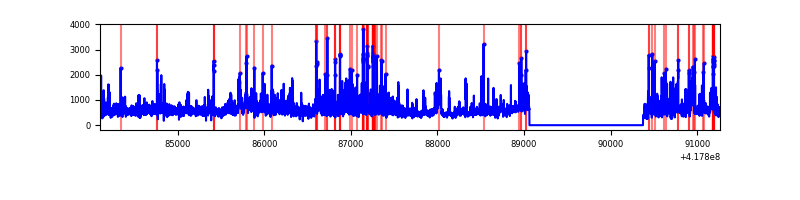 |
Top three noisy pixels from each quadrant. If the there are fewer than three noisy pixels in the level2.evt file, extra rows are filled as -1
| Pixel properties | Quadrant properties | ||||||
|---|---|---|---|---|---|---|---|
| Quadrant | DetID | PixID | Counts | Sigma | Mean | Median | Sigma |
| A | 10 | 83 | 547856 | 4262.47 | 630 | 617 | 128.4 |
| A | 12 | 189 | 142948 | 1108.62 | 630 | 617 | 128.4 |
| A | 15 | 191 | 137031 | 1062.53 | 630 | 617 | 128.4 |
| B | 3 | 112 | 2045479 | 17295.49 | 618 | 600 | 118.2 |
| B | 7 | 202 | 70111 | 587.92 | 618 | 600 | 118.2 |
| B | 0 | 230 | 46733 | 390.19 | 618 | 600 | 118.2 |
| C | 15 | 214 | 255342 | 1781.35 | 614 | 616 | 143.0 |
| C | 14 | 254 | 68753 | 476.5 | 614 | 616 | 143.0 |
| C | 0 | 10 | 31434 | 215.52 | 614 | 616 | 143.0 |
| D | 12 | 227 | 819008 | 6377.67 | 524 | 510 | 128.3 |
| D | 12 | 191 | 357387 | 2780.75 | 524 | 510 | 128.3 |
| D | 12 | 79 | 331298 | 2577.47 | 524 | 510 | 128.3 |
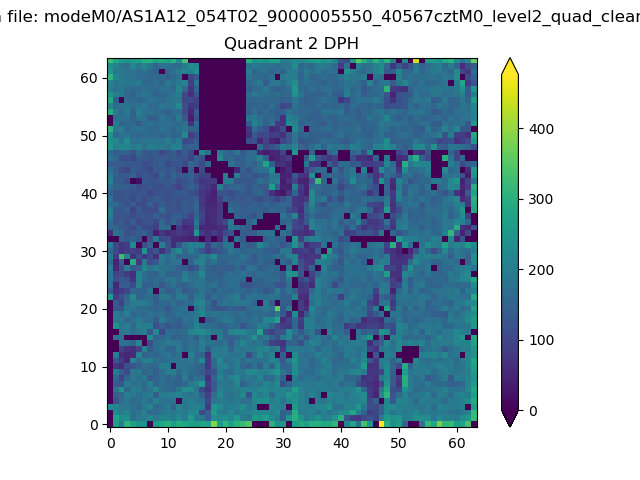
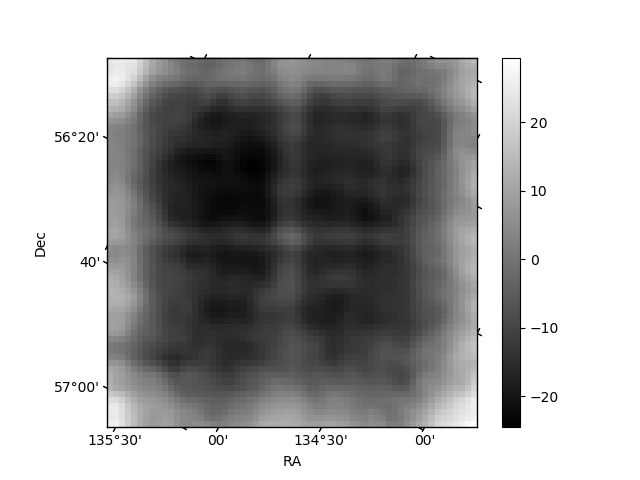
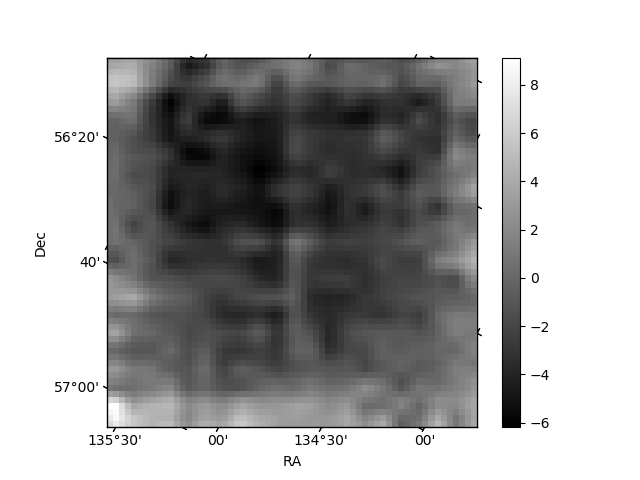
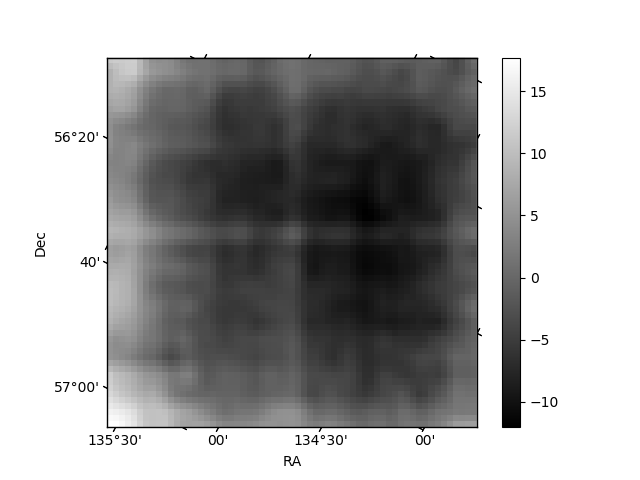
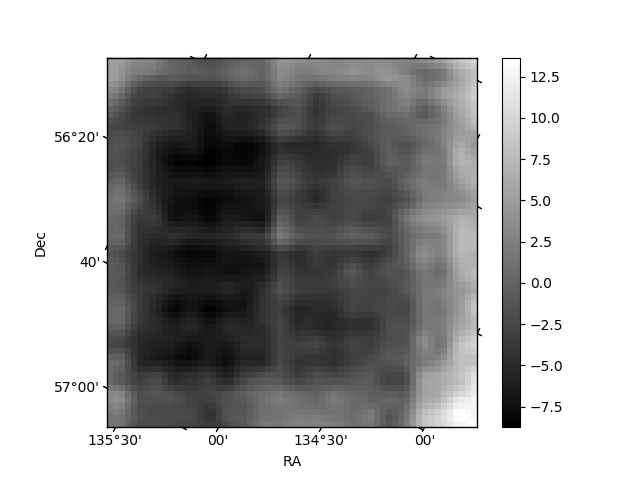
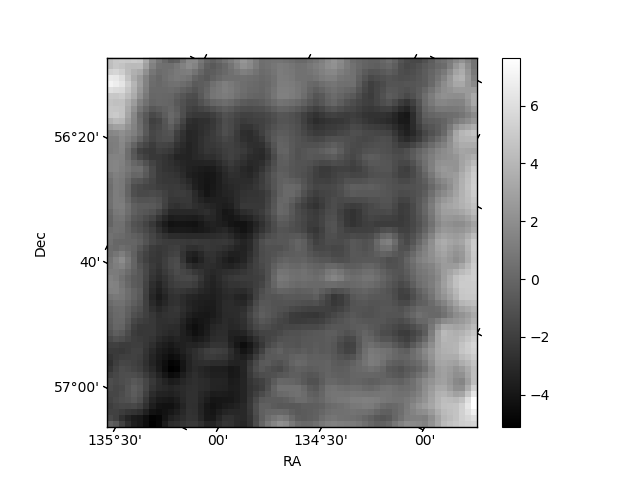
Histogram calculated using DETX and DETY for each event in the final _common_clean file
| Quadrant A | 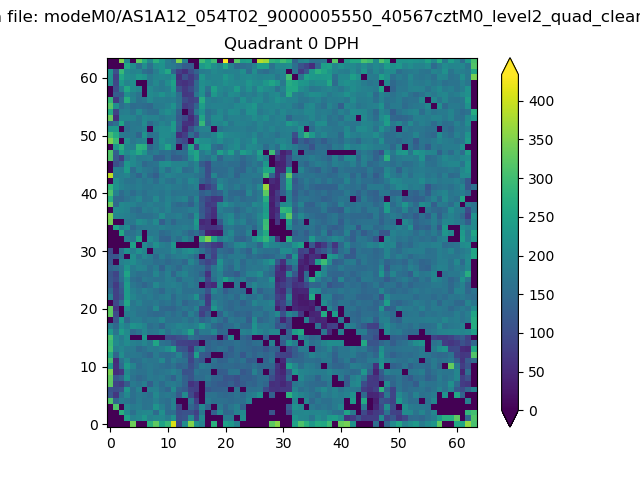 |
 |
Quadrant B |
|---|---|---|---|
| Quadrant D | 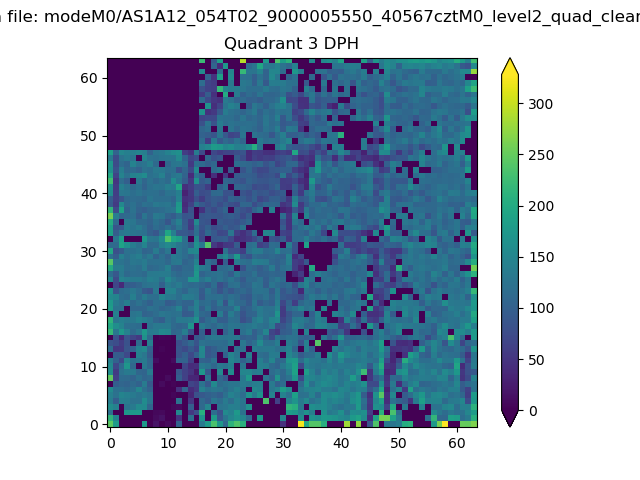 |
 |
Quadrant C |
| Plot type | Count rate plots | Images |
|---|---|---|
| Comparison with Poisson distribution Blue bars denote a histogram of data divided into 1 sec bins. Red curve is a Poisson curve with rate = median count rate of data. |
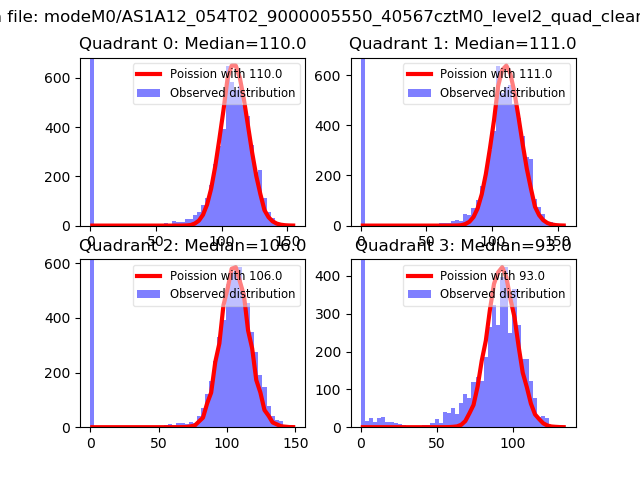 |
 |
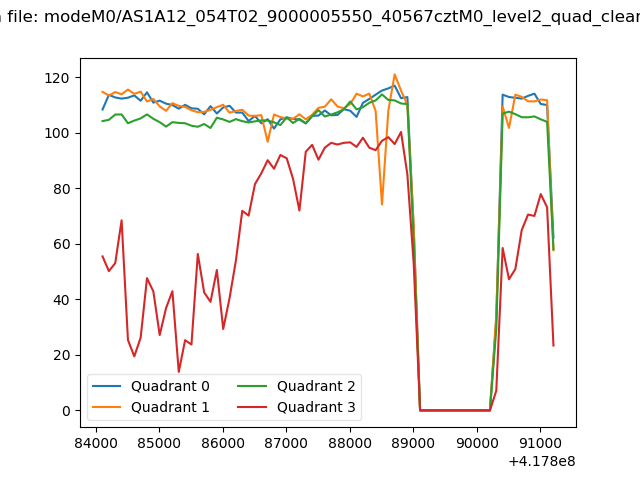
| Quadrant-wise count rates Data is divided into 100 sec bins |
 |
|
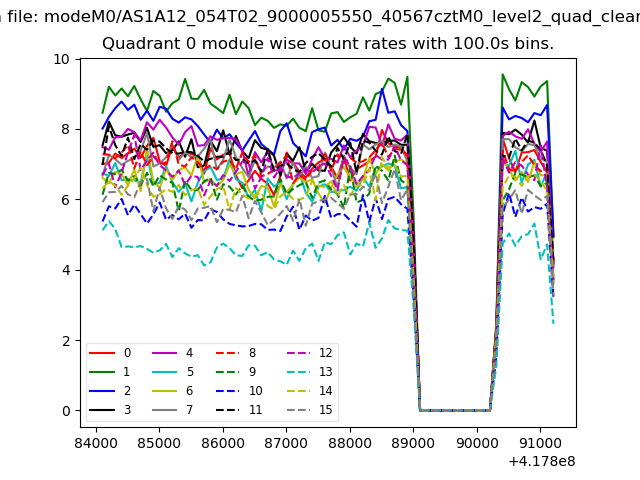
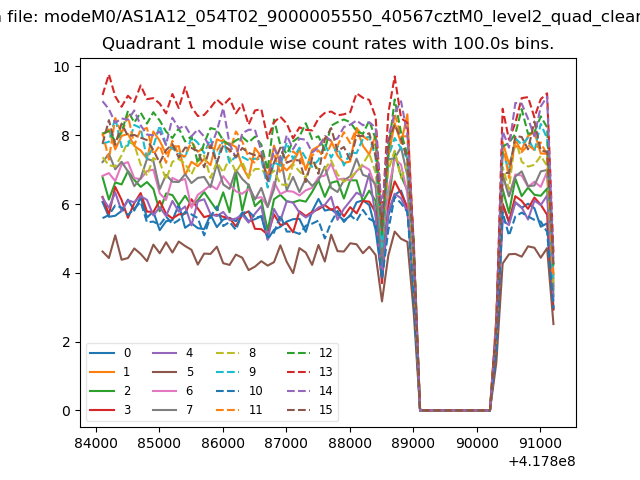
| Module-wise count rates for Quadrant A Data is divided into 100 sec bins |
 |
 |
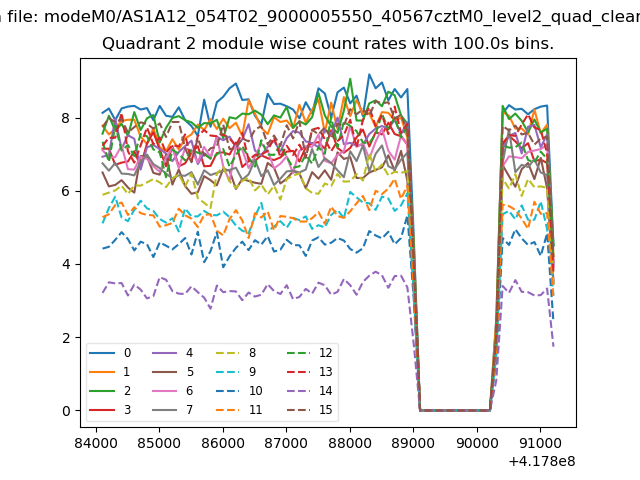
| Module-wise count rates for Quadrant B Data is divided into 100 sec bins |
 |
 |
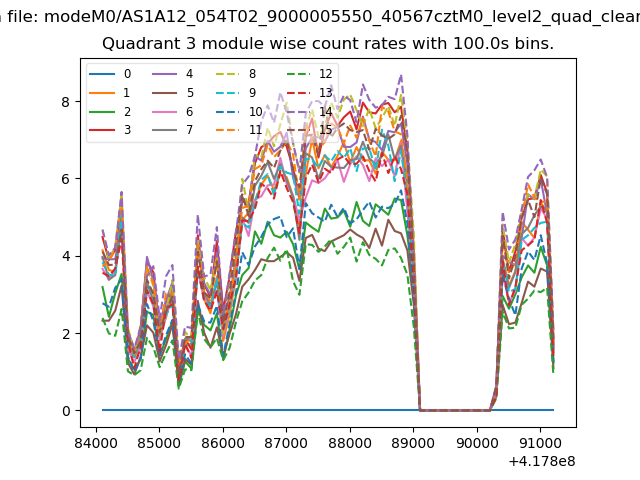
| Module-wise count rates for Quadrant C Data is divided into 100 sec bins |
 |
 |
| Module-wise count rates for Quadrant D Data is divided into 100 sec bins |
 |
 |
| Parameter | Plot |
|---|---|
| CZT HV Monitor | 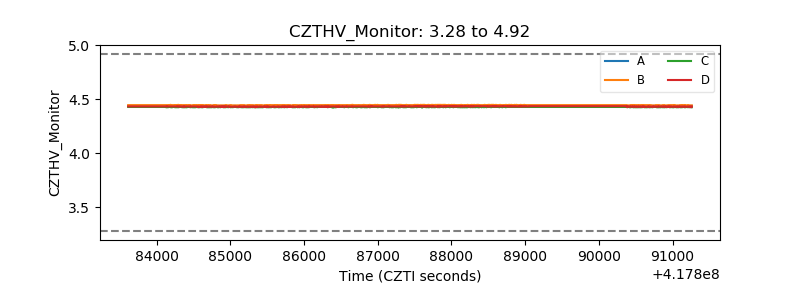 |
| D_VDD | 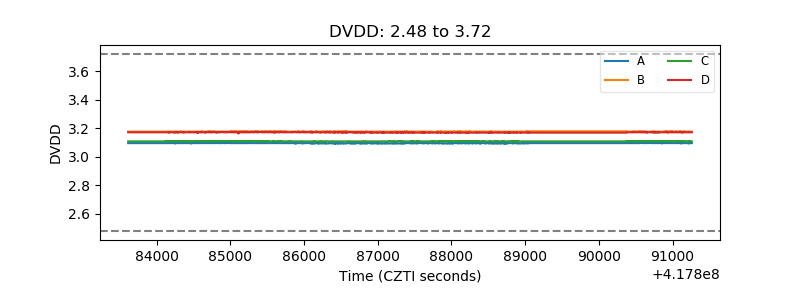 |
| Temperature 1 | 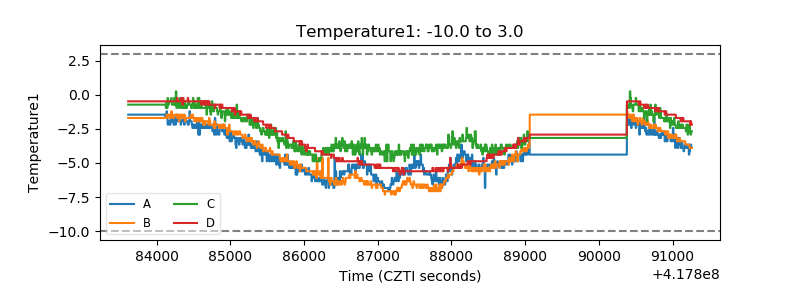 |
| Veto HV Monitor | 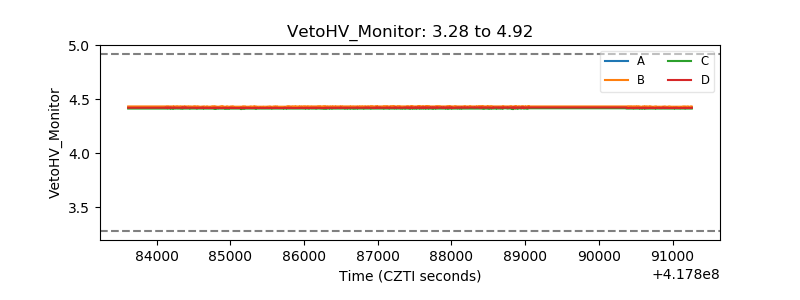 |
| Veto LLD | 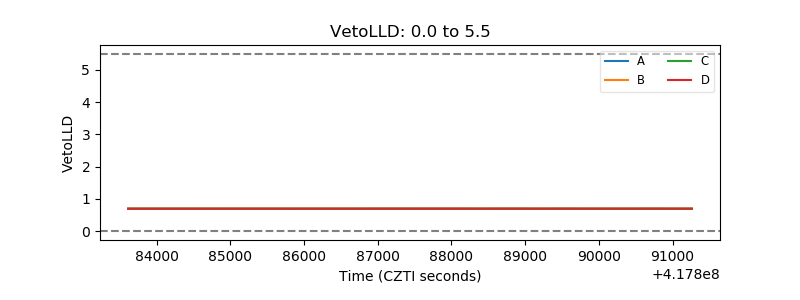 |
| Alpha Counter | 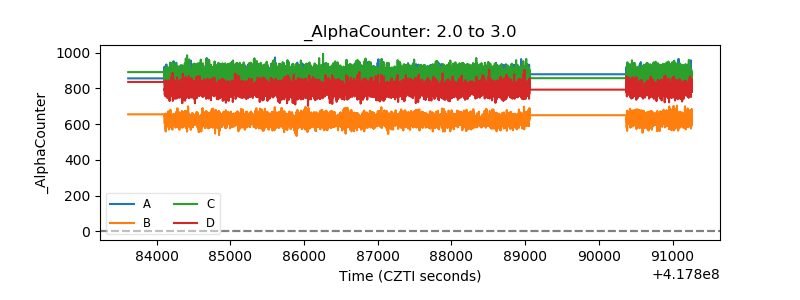 |
| _CPM_Rate | 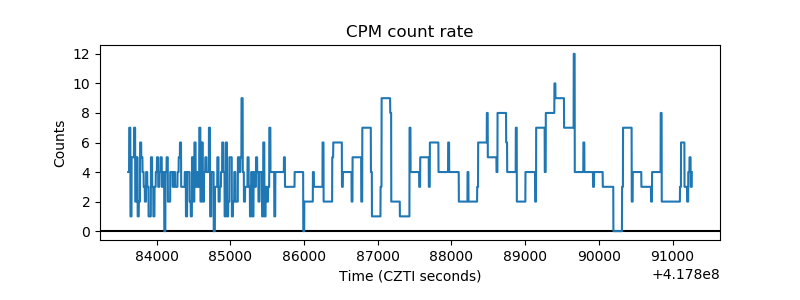 |
| CZT Counter | 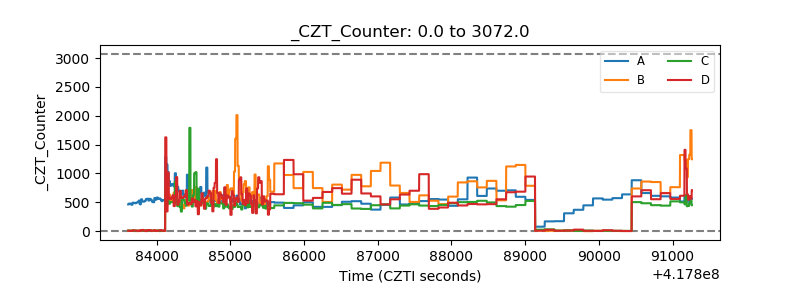 |
| +2.5 Volts monitor | 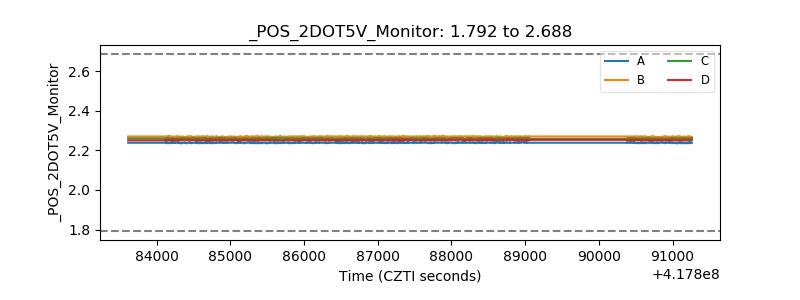 |
| +5 Volts monitor | 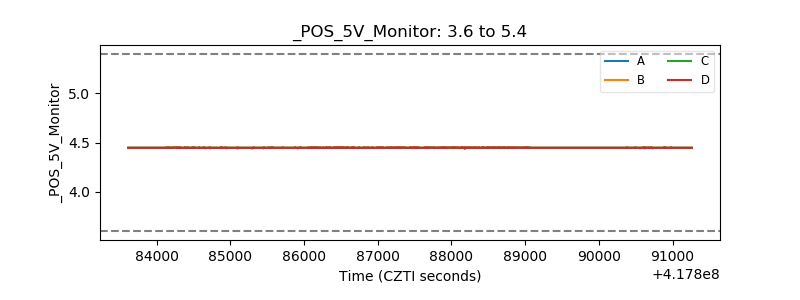 |
| _ROLL_ROT | 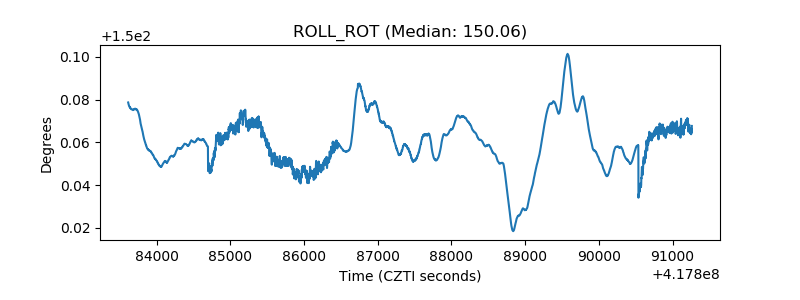 |
| _Roll_DEC | 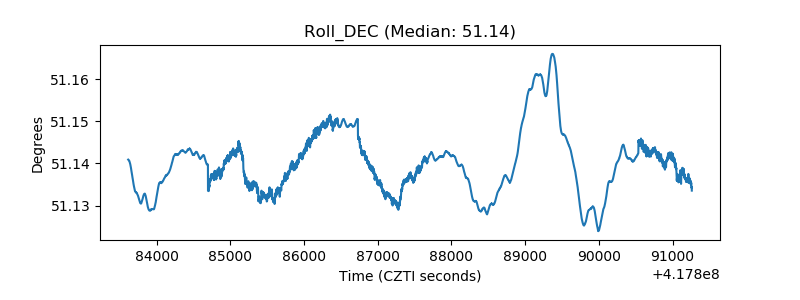 |
| _Roll_RA | 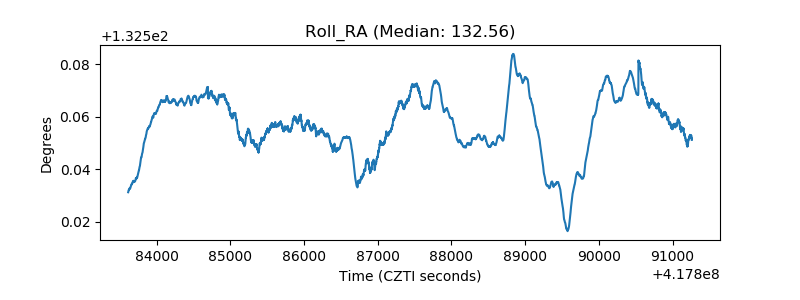 |
| Veto Counter | 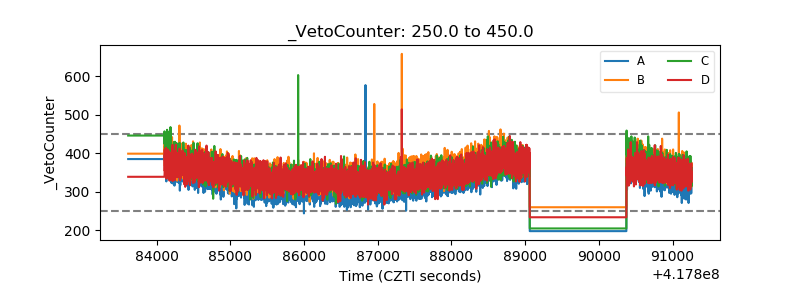 |