| Param | Original file | Final file |
|---|---|---|
| Filename | modeM0/AS1A12_054T02_9000005550_40570cztM0_level2.fits | modeM0/AS1A12_054T02_9000005550_40570cztM0_level2_quad_clean.evt |
| Size (bytes) | 1,210,262,400 | 233,501,760 |
| Size | 1.1 GB | 222.7 MB |
| Events in quadrant A | 8,273,865 | 1,682,403 |
| Events in quadrant B | 17,329,759 | 1,528,643 |
| Events in quadrant C | 7,273,672 | 1,642,473 |
| Events in quadrant D | 10,706,156 | 1,132,216 |
| Mode SS | |||
|---|---|---|---|
| Quadrant | BADHDUFLAG | Total packets | Discarded packets |
| A | 0 | 322 | 0 |
| B | 0 | 322 | 0 |
| C | 0 | 322 | 0 |
| D | 0 | 322 | 0 |
| Mode M0 | |||
|---|---|---|---|
| Quadrant | BADHDUFLAG | Total packets | Discarded packets |
| A | 0 | 34234 | 5 |
| B | 0 | 62611 | 4 |
| C | 0 | 32021 | 4 |
| D | 0 | 42937 | 4 |
| Mode M9 | |||
|---|---|---|---|
| Quadrant | BADHDUFLAG | Total packets | Discarded packets |
| A | 0 | 49 | 0 |
| B | 0 | 49 | 0 |
| C | 0 | 49 | 0 |
| D | 0 | 50 | 0 |
| Quadrant | Total seconds | Saturated seconds | Saturation percentage |
|---|---|---|---|
| A | 15690 | 34 | 0.216699% |
| B | 15690 | 1872 | 11.931166% |
| C | 15690 | 37 | 0.235819% |
| D | 15690 | 4265 | 27.182919% |
Noise dominated data is calculated using 1-second bins in cleaned event files. If a bin has >2000 counts, and if more than 50% of those come from <1% of pixels, then it is considered to be noise-dominated and hence unusable.
| Quadrant | # 1 sec bins | Bins with >0 counts | Bins with >2000 counts | High rate bins dominated by noise | Noise dominated (total time) | Noise dominated (detector-on time) | Marked lightcurve |
|---|---|---|---|---|---|---|---|
| A | 19840 | 15693 | 13 | 13 | 0.07% | 0.08% | 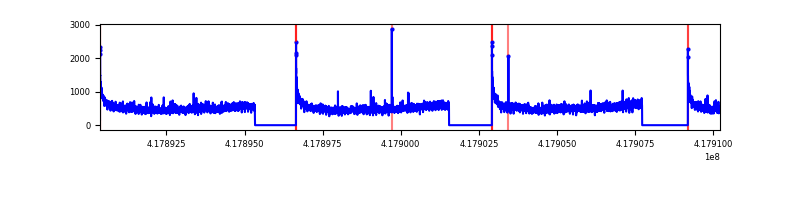 |
| B | 19840 | 15693 | 1490 | 1490 | 7.51% | 9.49% | 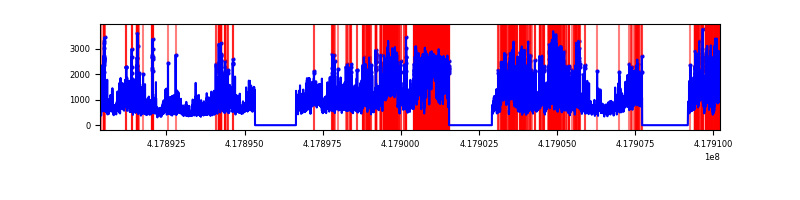 |
| C | 19840 | 15693 | 31 | 31 | 0.16% | 0.20% | 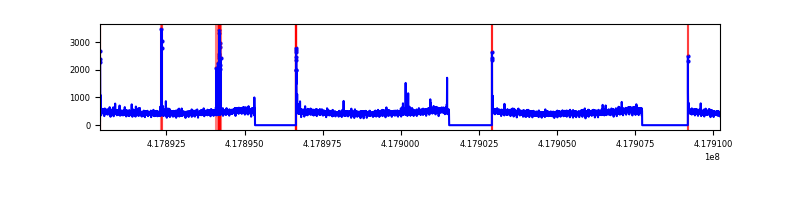 |
| D | 19839 | 15692 | 458 | 458 | 2.31% | 2.92% | 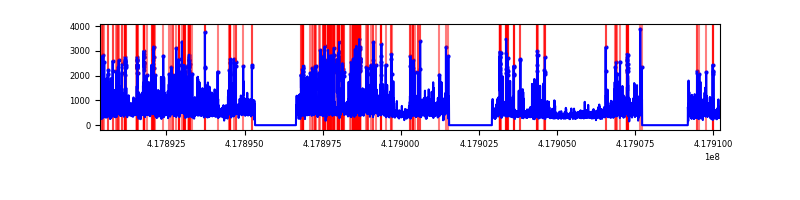 |
Top three noisy pixels from each quadrant. If the there are fewer than three noisy pixels in the level2.evt file, extra rows are filled as -1
| Pixel properties | Quadrant properties | ||||||
|---|---|---|---|---|---|---|---|
| Quadrant | DetID | PixID | Counts | Sigma | Mean | Median | Sigma |
| A | 10 | 83 | 1277276 | 3737.06 | 1682 | 1650 | 341.3 |
| A | 15 | 191 | 440803 | 1286.54 | 1682 | 1650 | 341.3 |
| A | 12 | 189 | 45320 | 127.94 | 1682 | 1650 | 341.3 |
| B | 3 | 112 | 10107608 | 33205.35 | 1609 | 1564 | 304.3 |
| B | 5 | 255 | 315299 | 1030.84 | 1609 | 1564 | 304.3 |
| B | 7 | 202 | 204205 | 665.82 | 1609 | 1564 | 304.3 |
| C | 15 | 214 | 674102 | 1762.1 | 1642 | 1651 | 381.6 |
| C | 14 | 254 | 95345 | 245.52 | 1642 | 1651 | 381.6 |
| C | 0 | 10 | 76708 | 196.68 | 1642 | 1651 | 381.6 |
| D | 12 | 227 | 2862673 | 7897.76 | 1463 | 1421 | 362.3 |
| D | 12 | 191 | 789688 | 2175.81 | 1463 | 1421 | 362.3 |
| D | 12 | 79 | 461056 | 1268.7 | 1463 | 1421 | 362.3 |
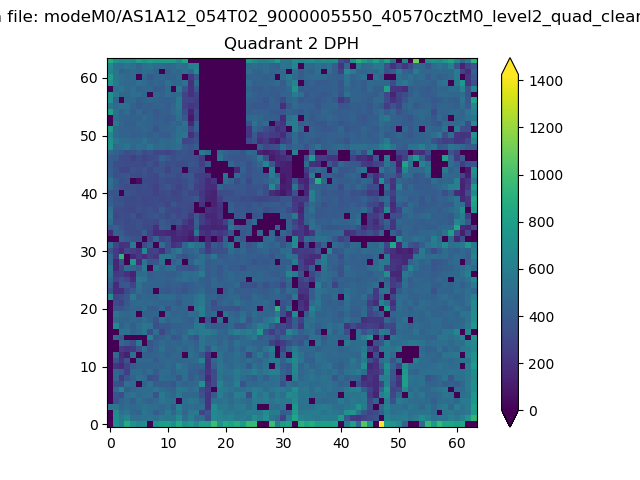
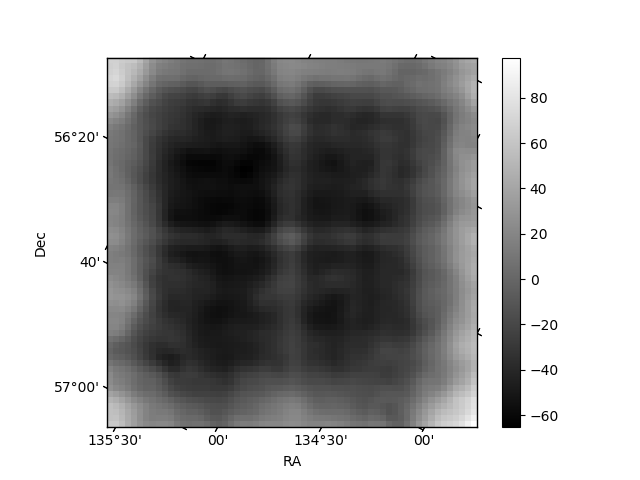
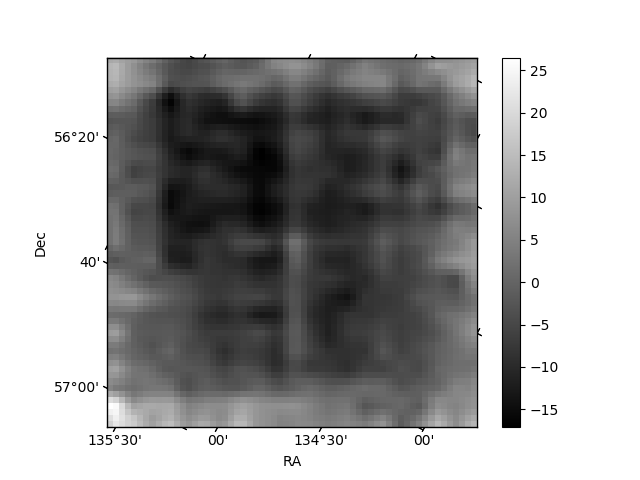
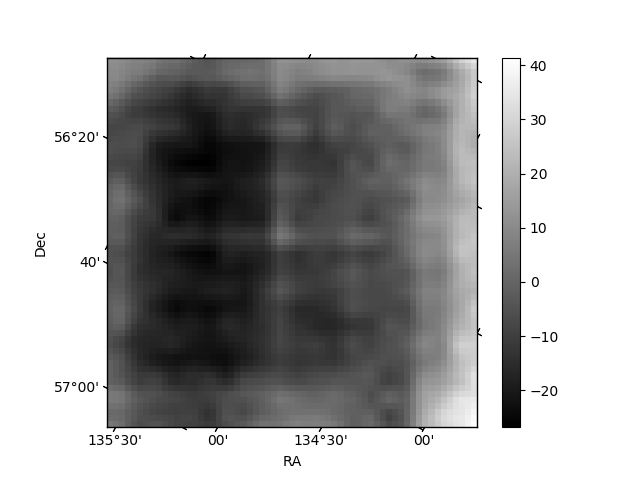
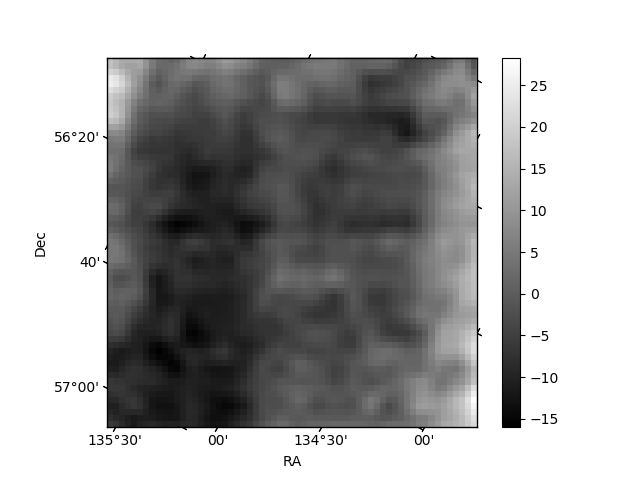
Histogram calculated using DETX and DETY for each event in the final _common_clean file
| Quadrant A | 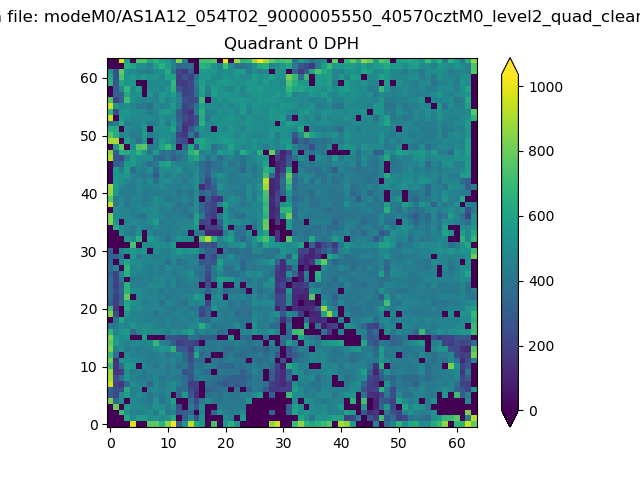 |
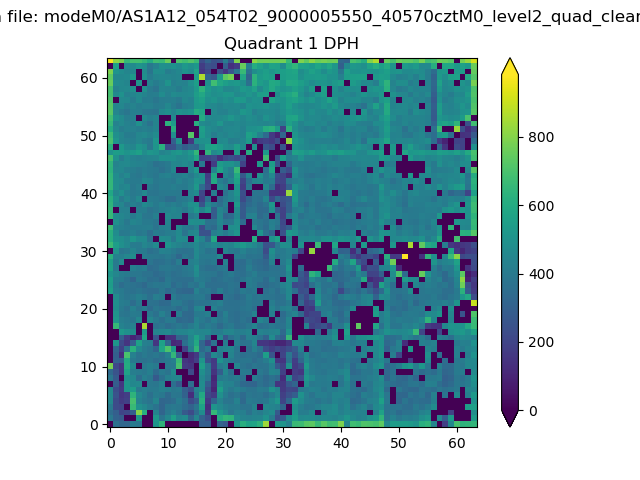 |
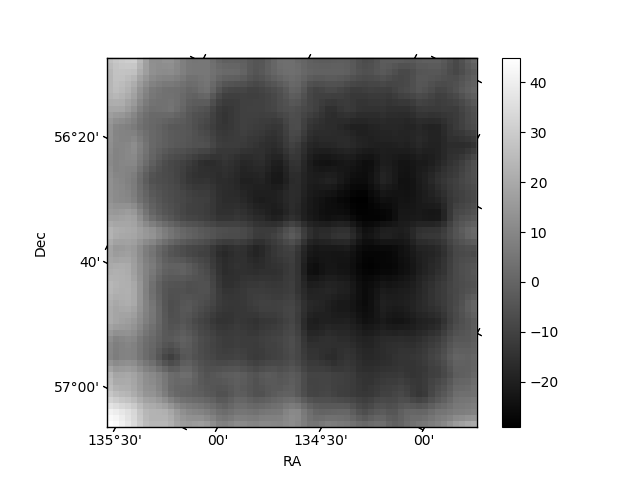
Quadrant B |
|---|---|---|---|
| Quadrant D | 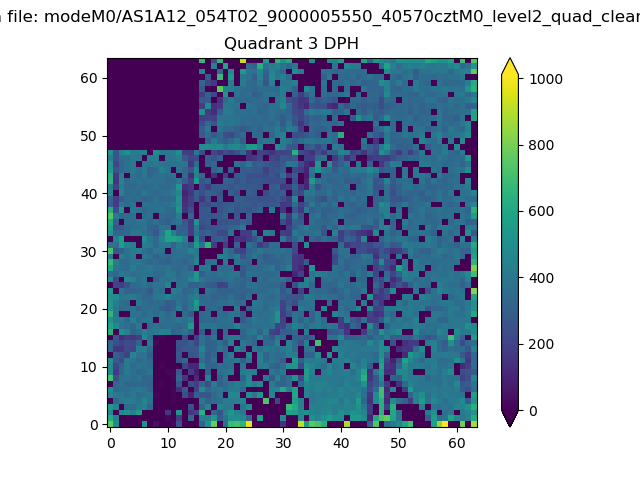 |
 |
Quadrant C |
| Plot type | Count rate plots | Images |
|---|---|---|
| Comparison with Poisson distribution Blue bars denote a histogram of data divided into 1 sec bins. Red curve is a Poisson curve with rate = median count rate of data. |
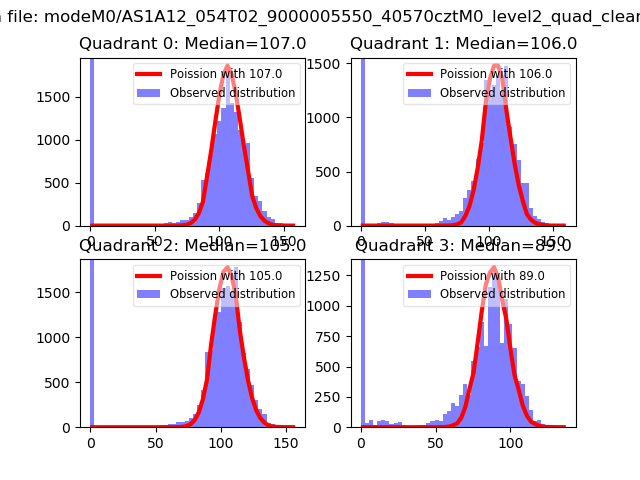 |
 |
| Quadrant-wise count rates Data is divided into 100 sec bins |
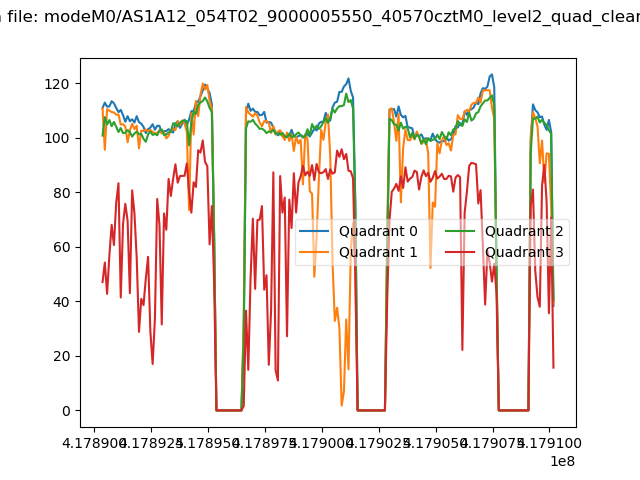 |
|
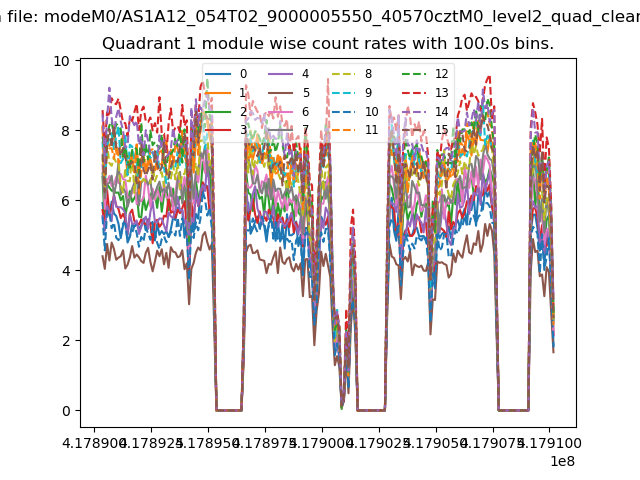
| Module-wise count rates for Quadrant A Data is divided into 100 sec bins |
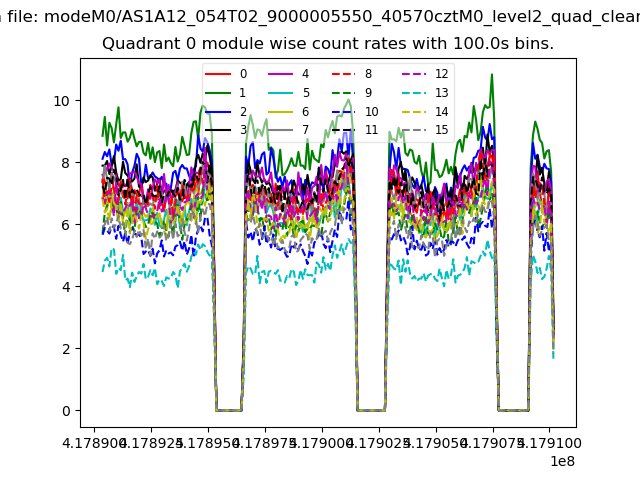 |
 |
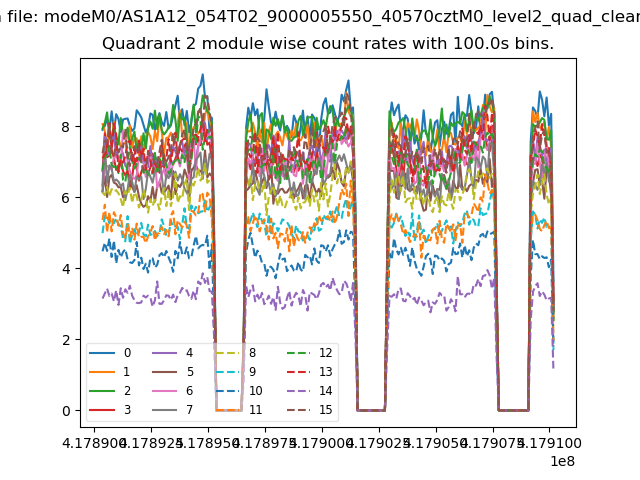
| Module-wise count rates for Quadrant B Data is divided into 100 sec bins |
 |
 |
| Module-wise count rates for Quadrant C Data is divided into 100 sec bins |
 |
 |
| Module-wise count rates for Quadrant D Data is divided into 100 sec bins |
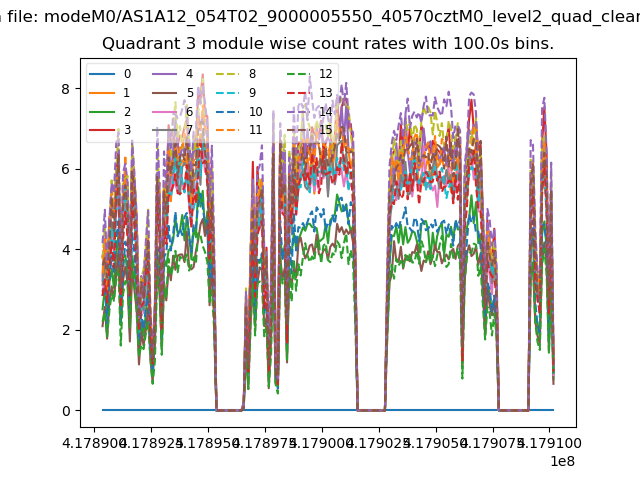 |
 |
| Parameter | Plot |
|---|---|
| CZT HV Monitor | 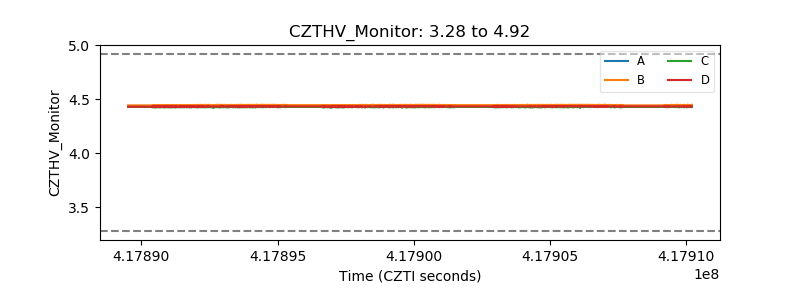 |
| D_VDD | 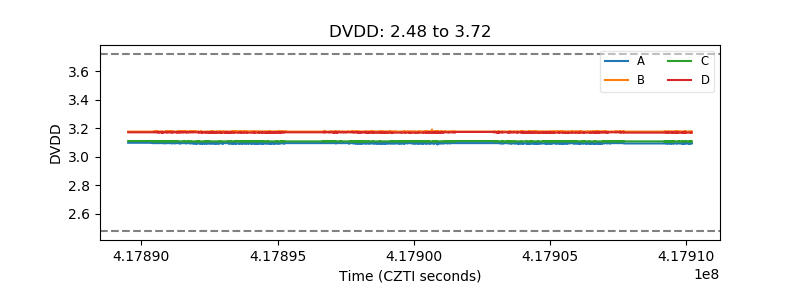 |
| Temperature 1 | 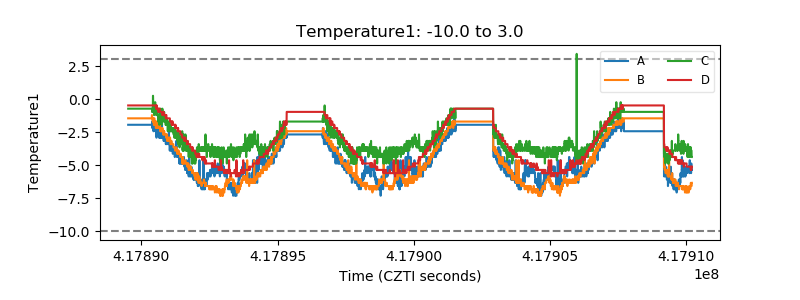 |
| Veto HV Monitor | 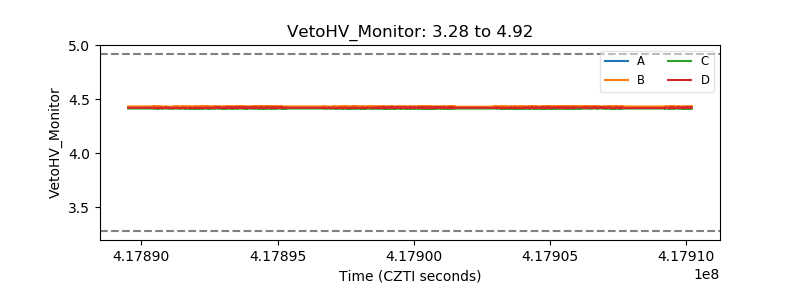 |
| Veto LLD | 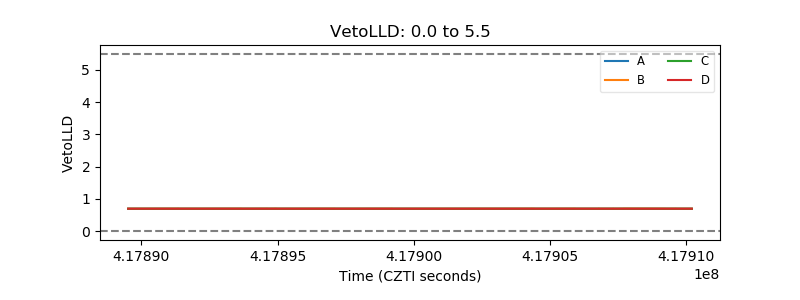 |
| Alpha Counter | 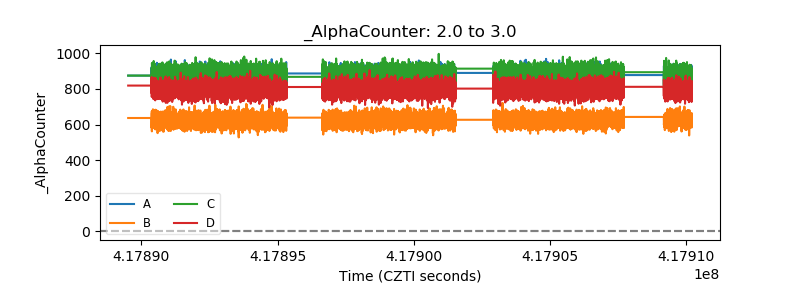 |
| _CPM_Rate | 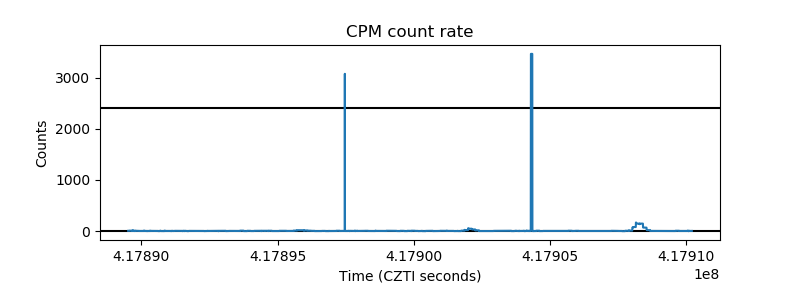 |
| CZT Counter | 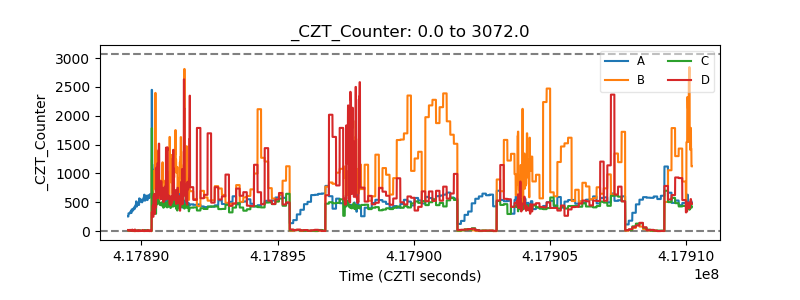 |
| +2.5 Volts monitor | 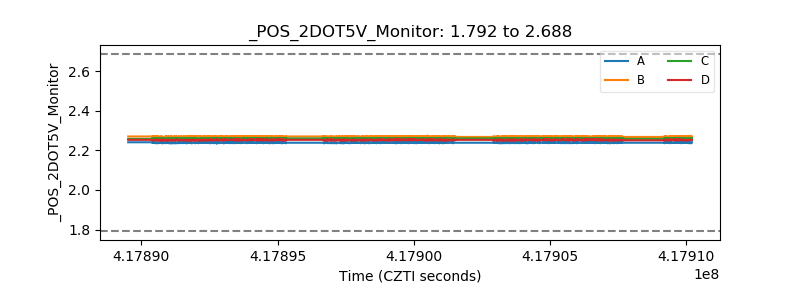 |
| +5 Volts monitor | 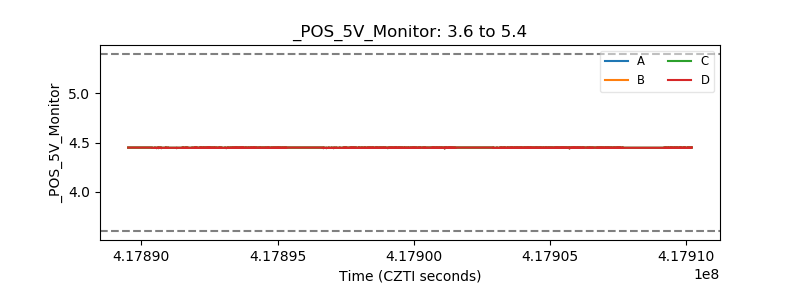 |
| _ROLL_ROT | 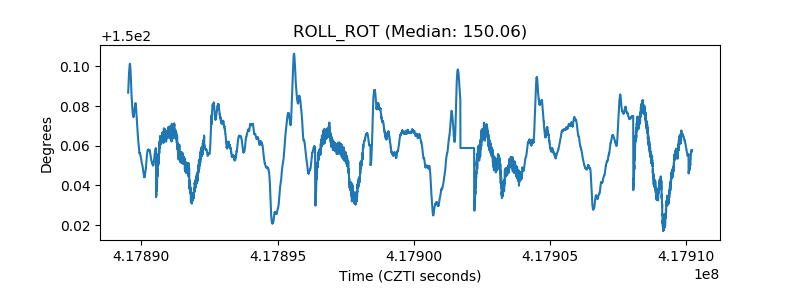 |
| _Roll_DEC | 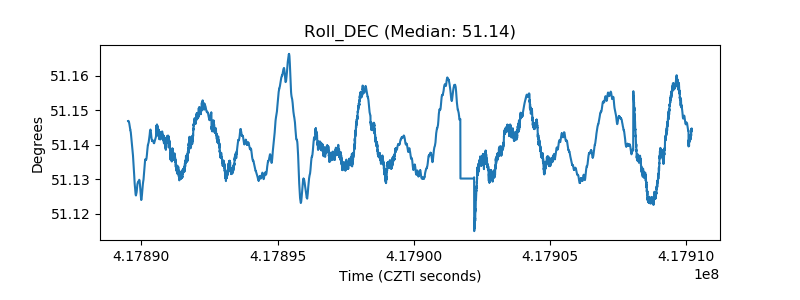 |
| _Roll_RA | 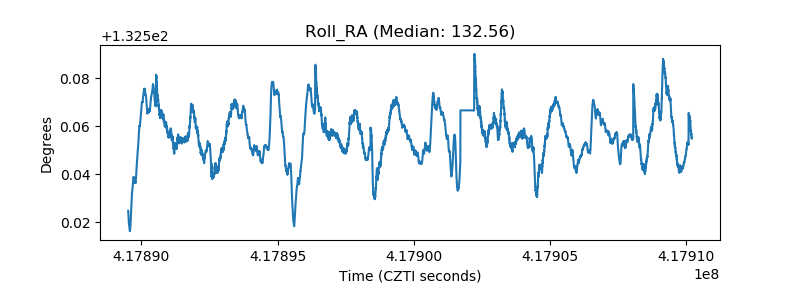 |
| Veto Counter | 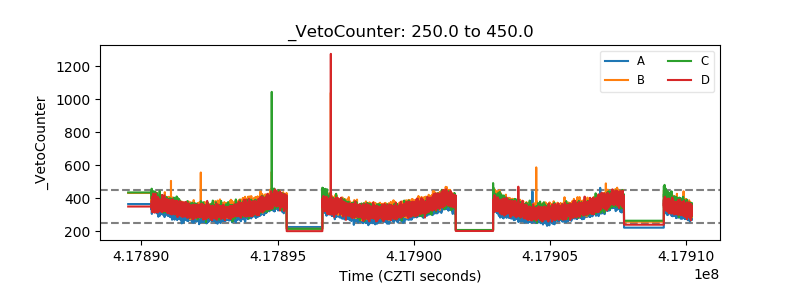 |