| Param | Original file | Final file |
|---|---|---|
| Filename | modeM0/AS1A12_054T02_9000005550_40571cztM0_level2.fits | modeM0/AS1A12_054T02_9000005550_40571cztM0_level2_quad_clean.evt |
| Size (bytes) | 425,234,880 | 85,875,840 |
| Size | 405.5 MB | 81.9 MB |
| Events in quadrant A | 2,916,360 | 602,229 |
| Events in quadrant B | 5,643,457 | 596,753 |
| Events in quadrant C | 2,645,727 | 590,939 |
| Events in quadrant D | 4,098,383 | 417,357 |
| Mode SS | |||
|---|---|---|---|
| Quadrant | BADHDUFLAG | Total packets | Discarded packets |
| A | 0 | 118 | 0 |
| B | 0 | 118 | 0 |
| C | 0 | 118 | 0 |
| D | 0 | 118 | 0 |
| Mode M0 | |||
|---|---|---|---|
| Quadrant | BADHDUFLAG | Total packets | Discarded packets |
| A | 0 | 12240 | 3 |
| B | 0 | 20812 | 2 |
| C | 0 | 11550 | 2 |
| D | 0 | 16319 | 2 |
| Mode M9 | |||
|---|---|---|---|
| Quadrant | BADHDUFLAG | Total packets | Discarded packets |
| A | 0 | 30 | 0 |
| B | 0 | 30 | 0 |
| C | 0 | 30 | 0 |
| D | 0 | 30 | 0 |
| Quadrant | Total seconds | Saturated seconds | Saturation percentage |
|---|---|---|---|
| A | 5607 | 6 | 0.107009% |
| B | 5607 | 333 | 5.939005% |
| C | 5607 | 28 | 0.499376% |
| D | 5607 | 1528 | 27.251650% |
Noise dominated data is calculated using 1-second bins in cleaned event files. If a bin has >2000 counts, and if more than 50% of those come from <1% of pixels, then it is considered to be noise-dominated and hence unusable.
| Quadrant | # 1 sec bins | Bins with >0 counts | Bins with >2000 counts | High rate bins dominated by noise | Noise dominated (total time) | Noise dominated (detector-on time) | Marked lightcurve |
|---|---|---|---|---|---|---|---|
| A | 8684 | 5609 | 4 | 4 | 0.05% | 0.07% | 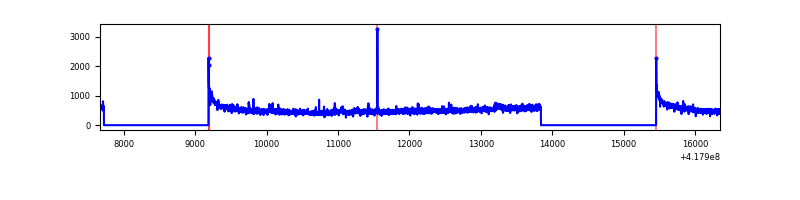 |
| B | 8684 | 5609 | 286 | 286 | 3.29% | 5.10% | 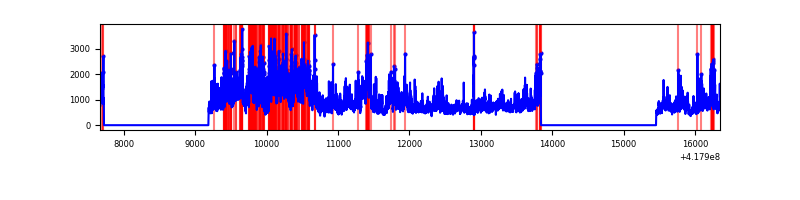 |
| C | 8684 | 5609 | 23 | 23 | 0.26% | 0.41% | 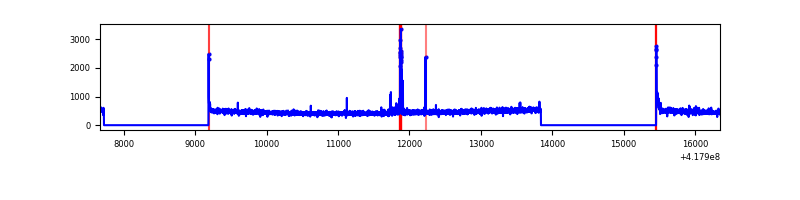 |
| D | 8684 | 5609 | 374 | 374 | 4.31% | 6.67% | 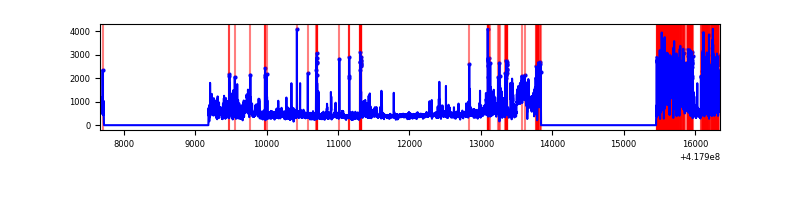 |
Top three noisy pixels from each quadrant. If the there are fewer than three noisy pixels in the level2.evt file, extra rows are filled as -1
| Pixel properties | Quadrant properties | ||||||
|---|---|---|---|---|---|---|---|
| Quadrant | DetID | PixID | Counts | Sigma | Mean | Median | Sigma |
| A | 10 | 83 | 498914 | 4006.33 | 602 | 590 | 124.4 |
| A | 15 | 191 | 65783 | 524.13 | 602 | 590 | 124.4 |
| A | 12 | 189 | 18827 | 146.62 | 602 | 590 | 124.4 |
| B | 3 | 112 | 3008456 | 26405.23 | 589 | 573 | 113.9 |
| B | 0 | 190 | 118685 | 1036.87 | 589 | 573 | 113.9 |
| B | 7 | 202 | 93878 | 819.09 | 589 | 573 | 113.9 |
| C | 15 | 214 | 245942 | 1767.38 | 588 | 590 | 138.8 |
| C | 14 | 254 | 67280 | 480.4 | 588 | 590 | 138.8 |
| C | 0 | 10 | 39722 | 281.88 | 588 | 590 | 138.8 |
| D | 12 | 227 | 1322599 | 10283.18 | 510 | 494 | 128.6 |
| D | 5 | 32 | 252264 | 1958.24 | 510 | 494 | 128.6 |
| D | 12 | 191 | 237660 | 1844.65 | 510 | 494 | 128.6 |
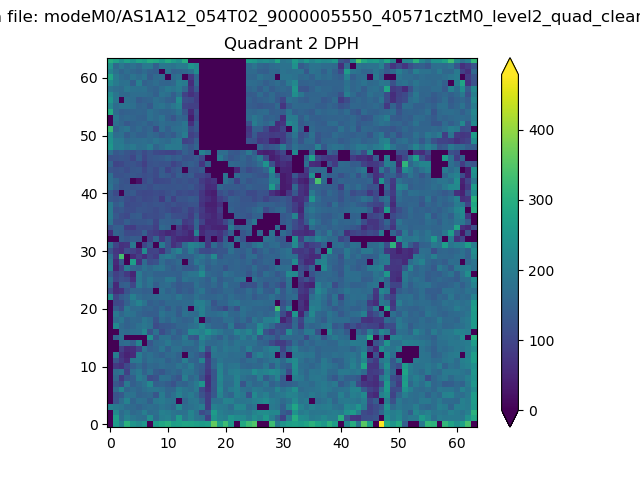
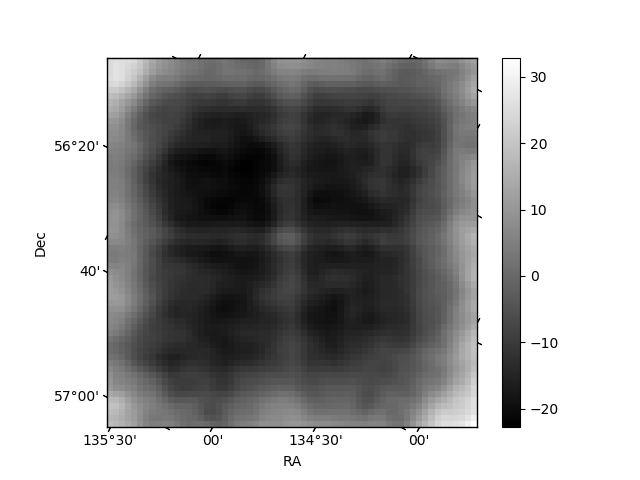
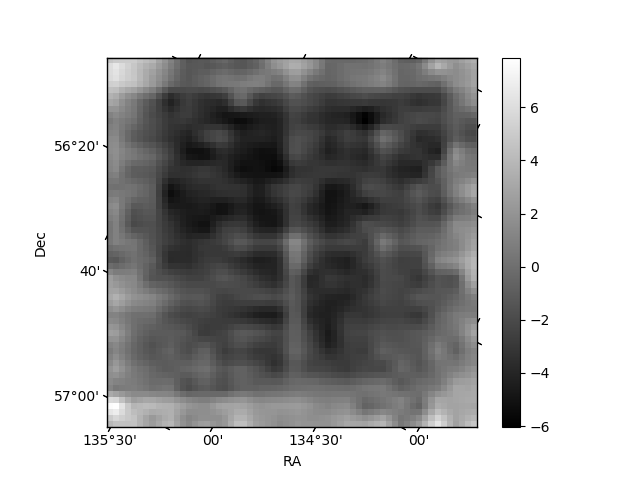
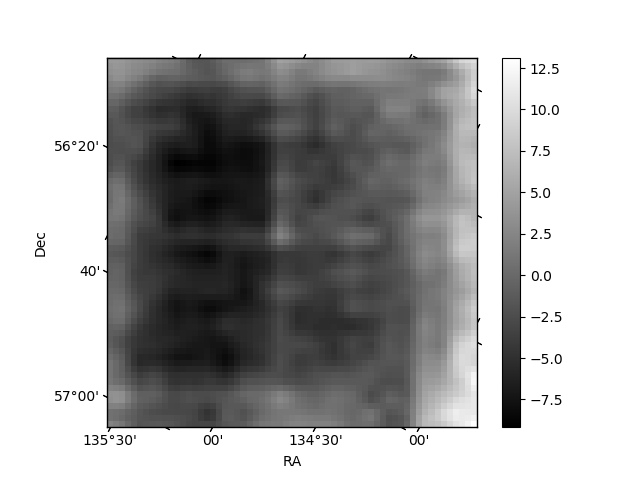
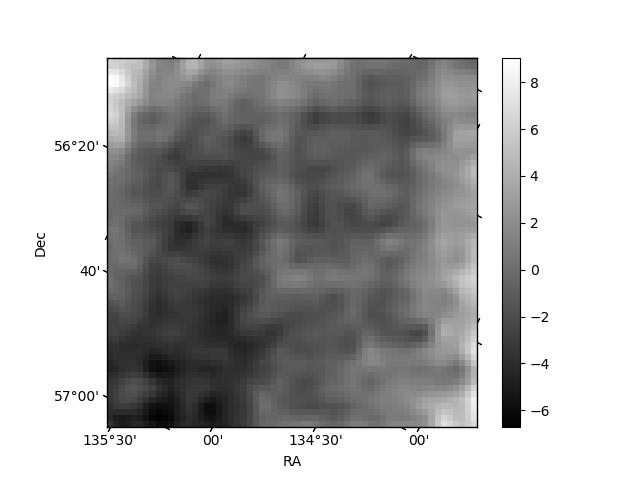
Histogram calculated using DETX and DETY for each event in the final _common_clean file
| Quadrant A | 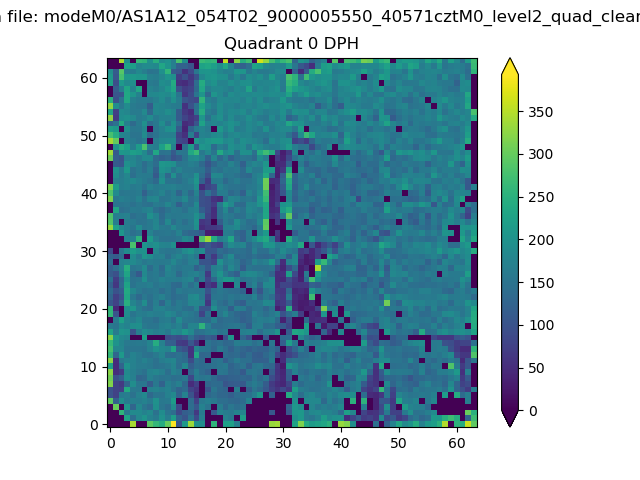 |
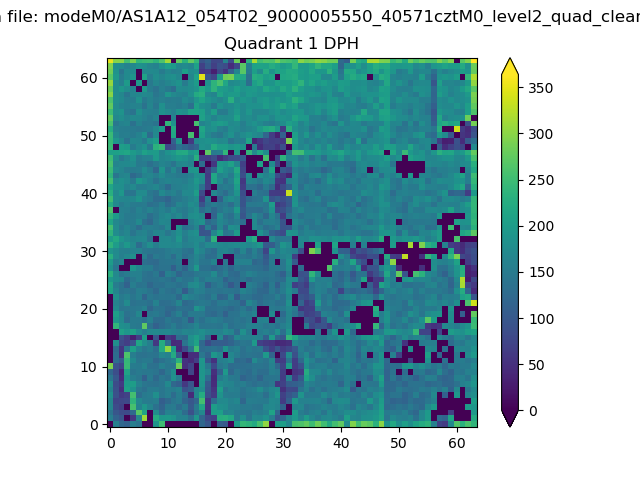 |
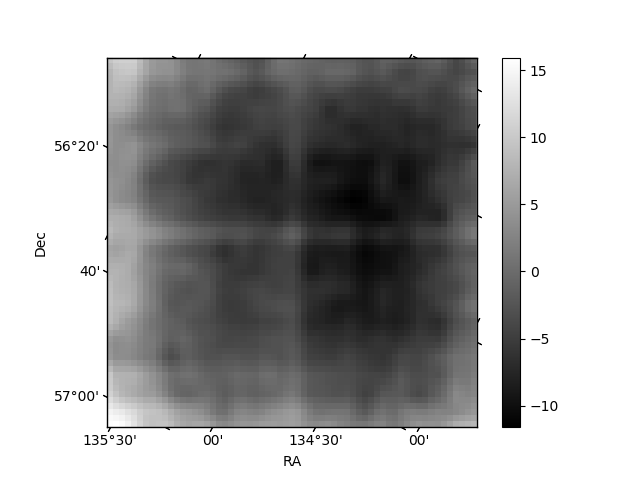
Quadrant B |
|---|---|---|---|
| Quadrant D | 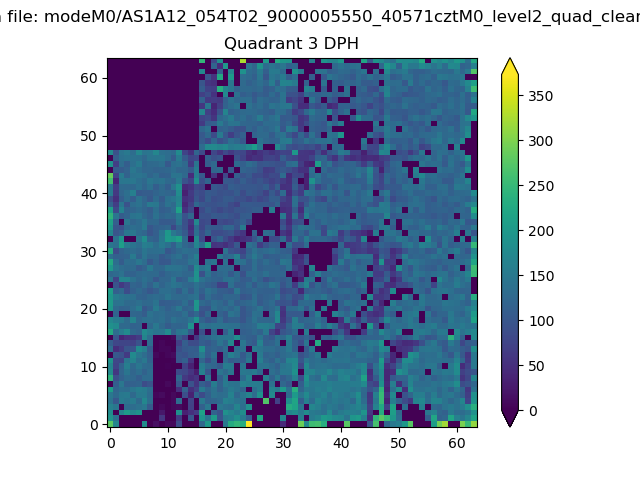 |
 |
Quadrant C |
| Plot type | Count rate plots | Images |
|---|---|---|
| Comparison with Poisson distribution Blue bars denote a histogram of data divided into 1 sec bins. Red curve is a Poisson curve with rate = median count rate of data. |
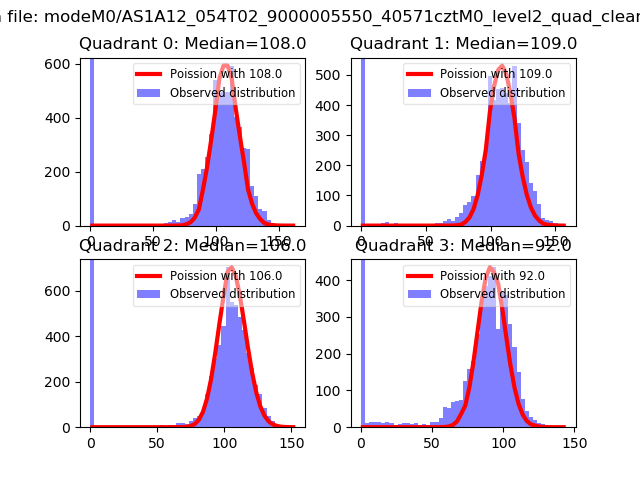 |
 |
| Quadrant-wise count rates Data is divided into 100 sec bins |
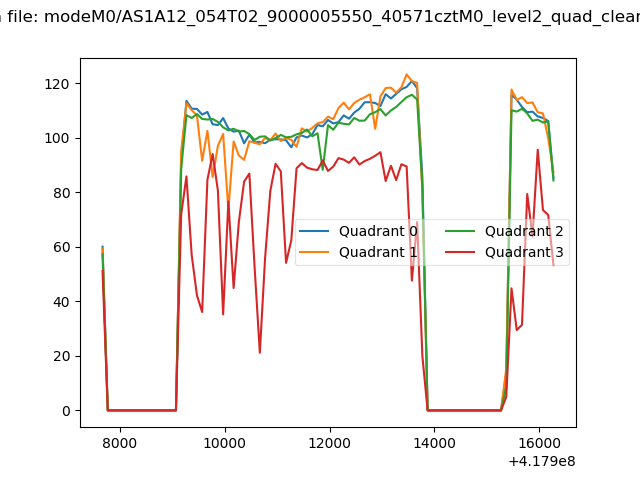 |
|
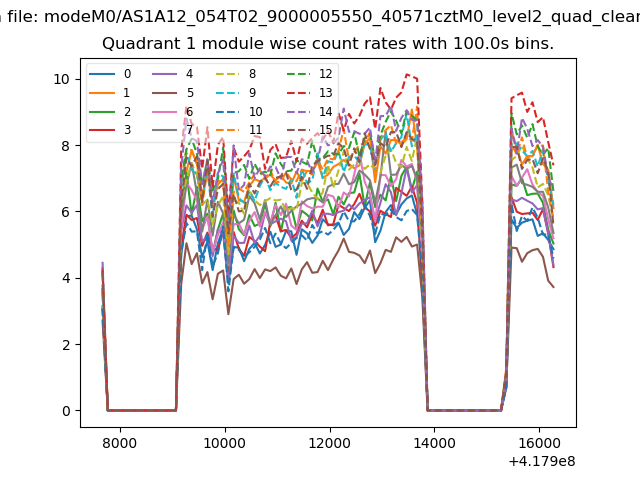
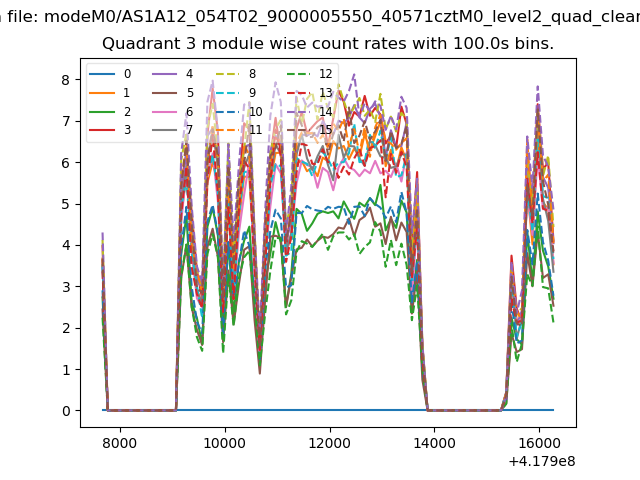
| Module-wise count rates for Quadrant A Data is divided into 100 sec bins |
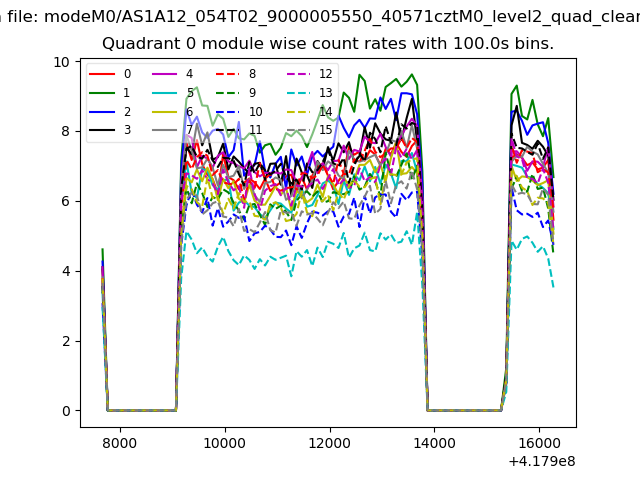 |
 |
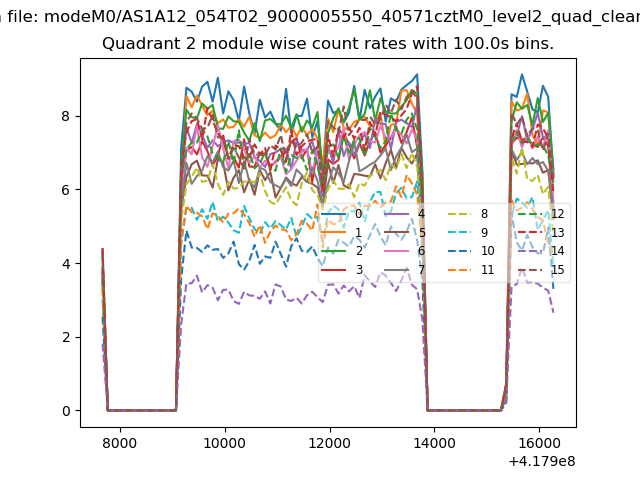
| Module-wise count rates for Quadrant B Data is divided into 100 sec bins |
 |
 |
| Module-wise count rates for Quadrant C Data is divided into 100 sec bins |
 |
 |
| Module-wise count rates for Quadrant D Data is divided into 100 sec bins |
 |
 |
| Parameter | Plot |
|---|---|
| CZT HV Monitor | 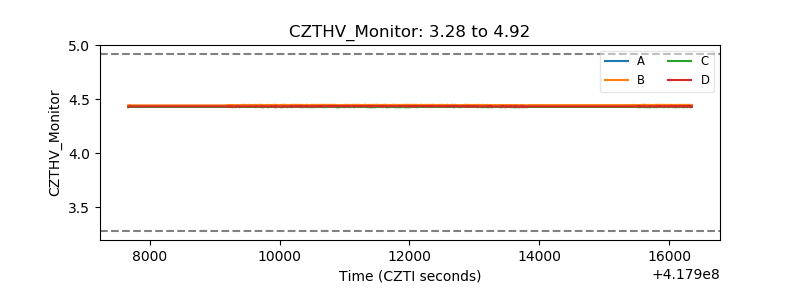 |
| D_VDD | 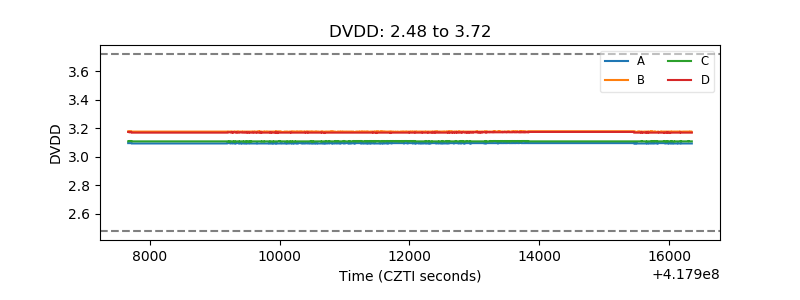 |
| Temperature 1 | 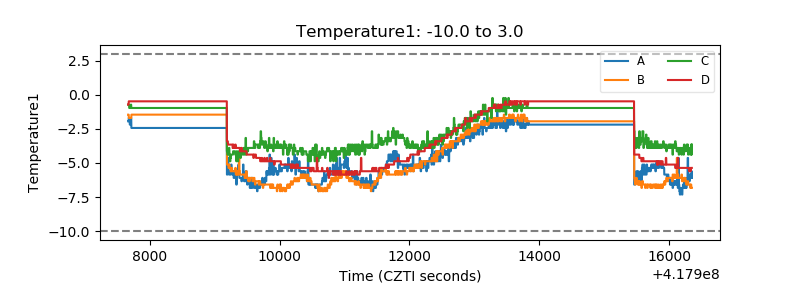 |
| Veto HV Monitor | 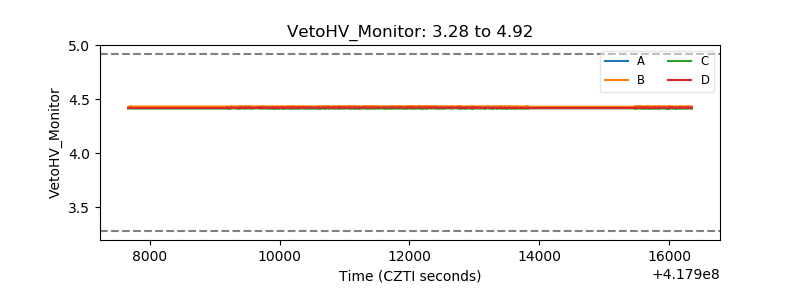 |
| Veto LLD | 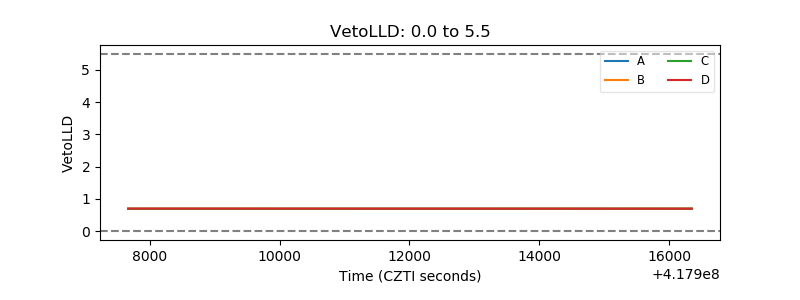 |
| Alpha Counter | 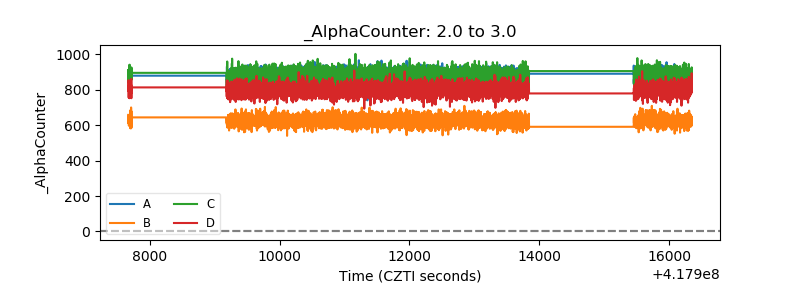 |
| _CPM_Rate | 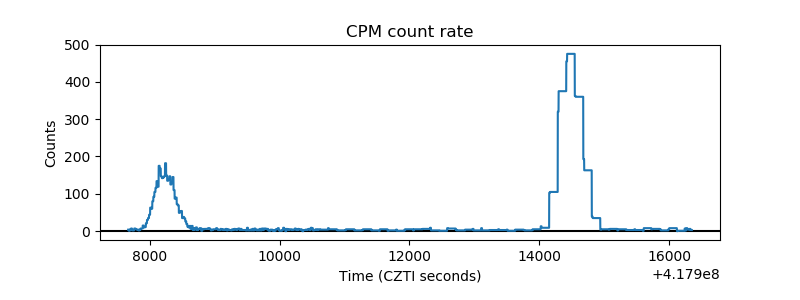 |
| CZT Counter | 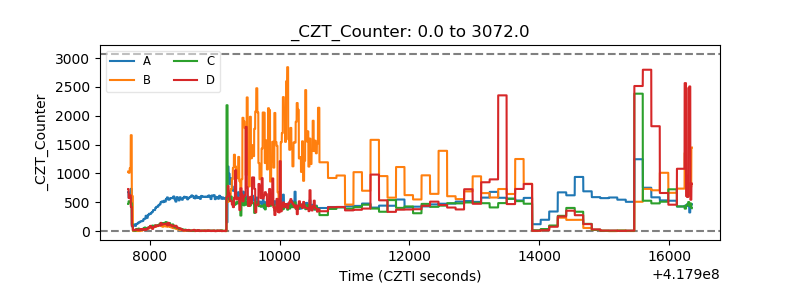 |
| +2.5 Volts monitor | 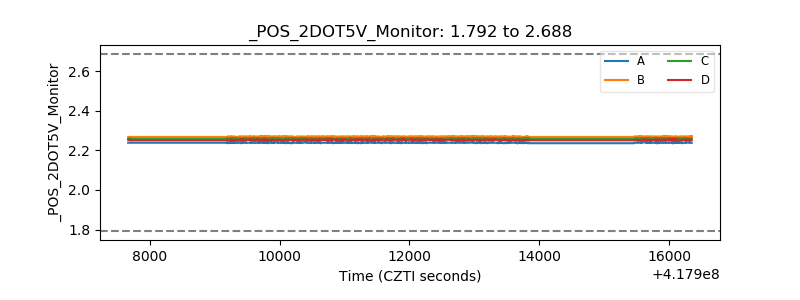 |
| +5 Volts monitor | 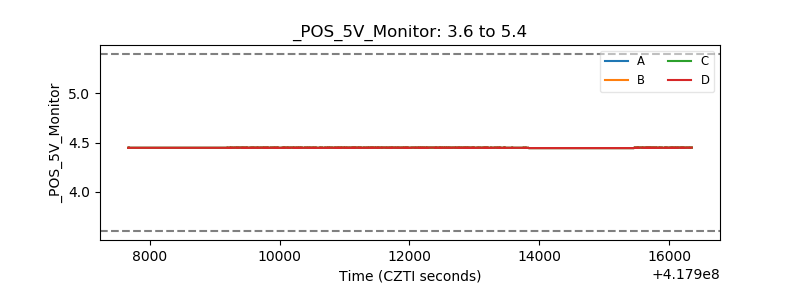 |
| _ROLL_ROT | 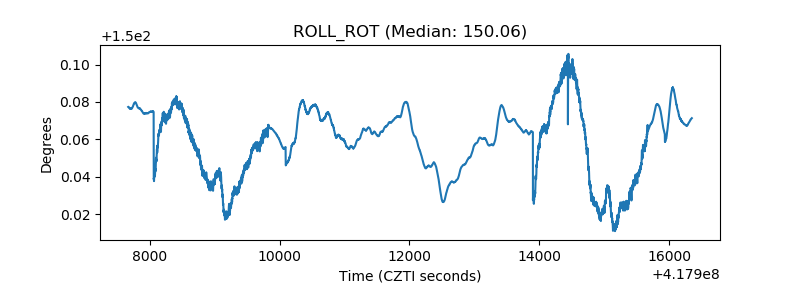 |
| _Roll_DEC | 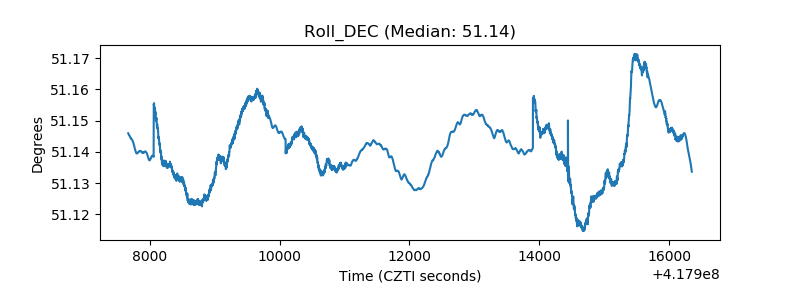 |
| _Roll_RA | 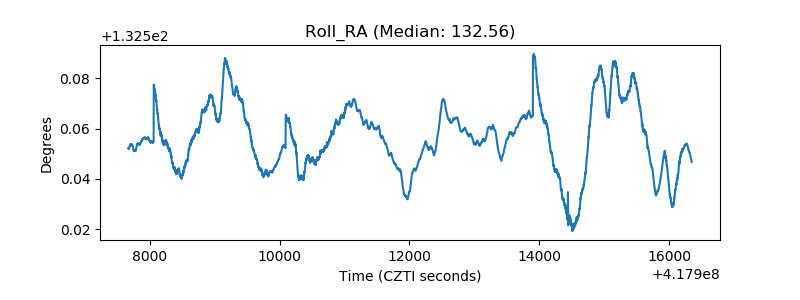 |
| Veto Counter | 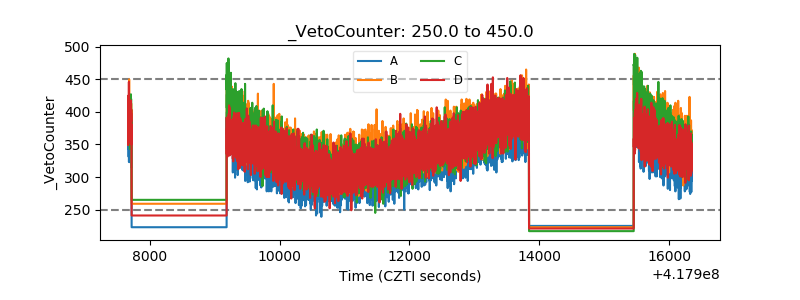 |