| Param | Original file | Final file |
|---|---|---|
| Filename | modeM0/AS1A12_054T02_9000005550_40572cztM0_level2.fits | modeM0/AS1A12_054T02_9000005550_40572cztM0_level2_quad_clean.evt |
| Size (bytes) | 445,187,520 | 87,396,480 |
| Size | 424.6 MB | 83.3 MB |
| Events in quadrant A | 2,906,506 | 613,799 |
| Events in quadrant B | 4,393,190 | 618,492 |
| Events in quadrant C | 2,732,751 | 598,993 |
| Events in quadrant D | 6,010,299 | 422,314 |
| Mode SS | |||
|---|---|---|---|
| Quadrant | BADHDUFLAG | Total packets | Discarded packets |
| A | 0 | 116 | 0 |
| B | 0 | 116 | 0 |
| C | 0 | 116 | 0 |
| D | 0 | 116 | 0 |
| Mode M0 | |||
|---|---|---|---|
| Quadrant | BADHDUFLAG | Total packets | Discarded packets |
| A | 0 | 12126 | 3 |
| B | 0 | 16942 | 2 |
| C | 0 | 11728 | 2 |
| D | 0 | 21762 | 2 |
| Mode M9 | |||
|---|---|---|---|
| Quadrant | BADHDUFLAG | Total packets | Discarded packets |
| A | 0 | 33 | 0 |
| B | 0 | 33 | 0 |
| C | 0 | 33 | 0 |
| D | 0 | 33 | 0 |
| Quadrant | Total seconds | Saturated seconds | Saturation percentage |
|---|---|---|---|
| A | 5610 | 10 | 0.178253% |
| B | 5610 | 142 | 2.531194% |
| C | 5610 | 28 | 0.499109% |
| D | 5610 | 1576 | 28.092692% |
Noise dominated data is calculated using 1-second bins in cleaned event files. If a bin has >2000 counts, and if more than 50% of those come from <1% of pixels, then it is considered to be noise-dominated and hence unusable.
| Quadrant | # 1 sec bins | Bins with >0 counts | Bins with >2000 counts | High rate bins dominated by noise | Noise dominated (total time) | Noise dominated (detector-on time) | Marked lightcurve |
|---|---|---|---|---|---|---|---|
| A | 8925 | 5612 | 2 | 2 | 0.02% | 0.04% | 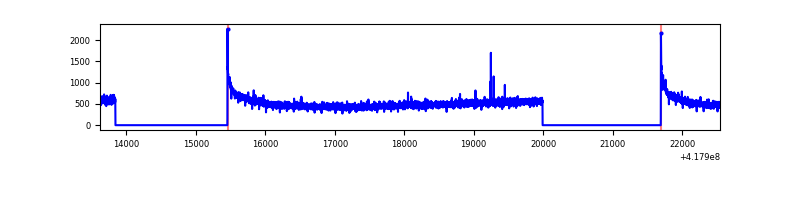 |
| B | 8925 | 5612 | 72 | 72 | 0.81% | 1.28% | 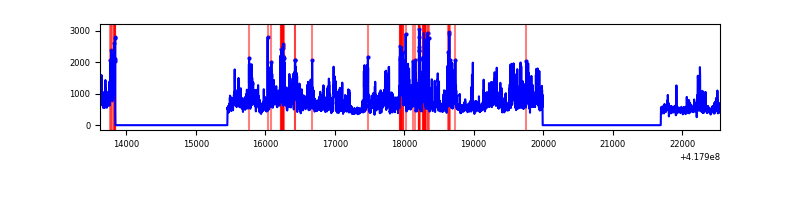 |
| C | 8925 | 5612 | 23 | 23 | 0.26% | 0.41% | 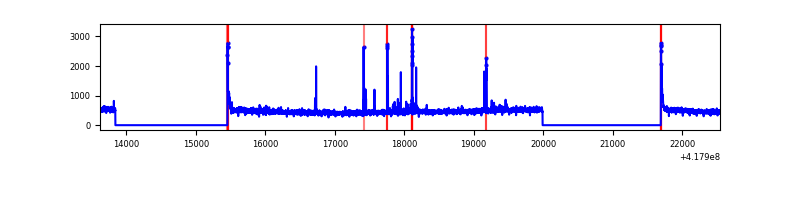 |
| D | 8925 | 5612 | 1035 | 1035 | 11.60% | 18.44% | 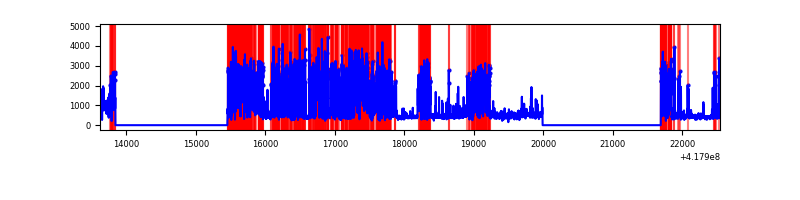 |
Top three noisy pixels from each quadrant. If the there are fewer than three noisy pixels in the level2.evt file, extra rows are filled as -1
| Pixel properties | Quadrant properties | ||||||
|---|---|---|---|---|---|---|---|
| Quadrant | DetID | PixID | Counts | Sigma | Mean | Median | Sigma |
| A | 10 | 83 | 503024 | 3975.37 | 611 | 598 | 126.4 |
| A | 15 | 191 | 26179 | 202.4 | 611 | 598 | 126.4 |
| A | 12 | 189 | 10773 | 80.5 | 611 | 598 | 126.4 |
| B | 3 | 112 | 1770171 | 15161.52 | 602 | 585 | 116.7 |
| B | 0 | 190 | 87269 | 742.69 | 602 | 585 | 116.7 |
| B | 0 | 230 | 49487 | 418.98 | 602 | 585 | 116.7 |
| C | 15 | 214 | 247278 | 1764.01 | 595 | 600 | 139.8 |
| C | 14 | 254 | 93278 | 662.75 | 595 | 600 | 139.8 |
| C | 0 | 10 | 62803 | 444.82 | 595 | 600 | 139.8 |
| D | 12 | 227 | 3435730 | 26503.38 | 521 | 506 | 129.6 |
| D | 12 | 191 | 135205 | 1039.23 | 521 | 506 | 129.6 |
| D | 5 | 32 | 107283 | 823.8 | 521 | 506 | 129.6 |
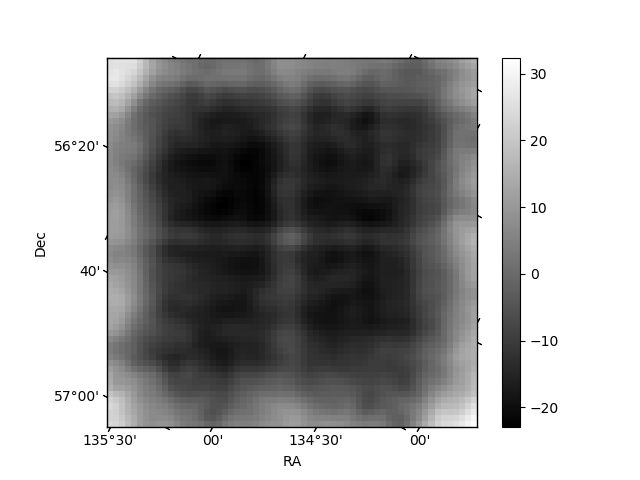
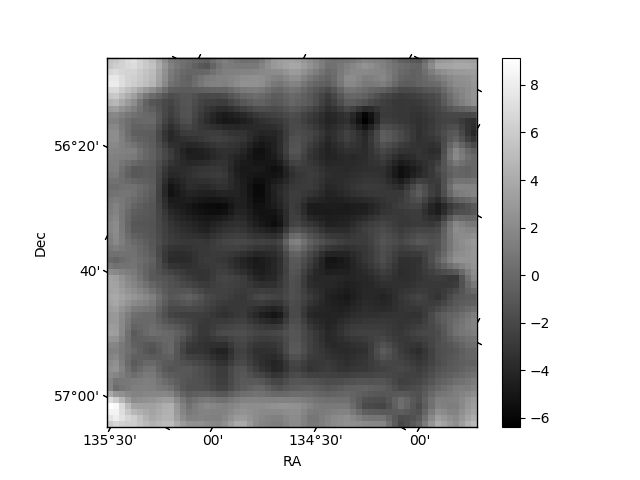
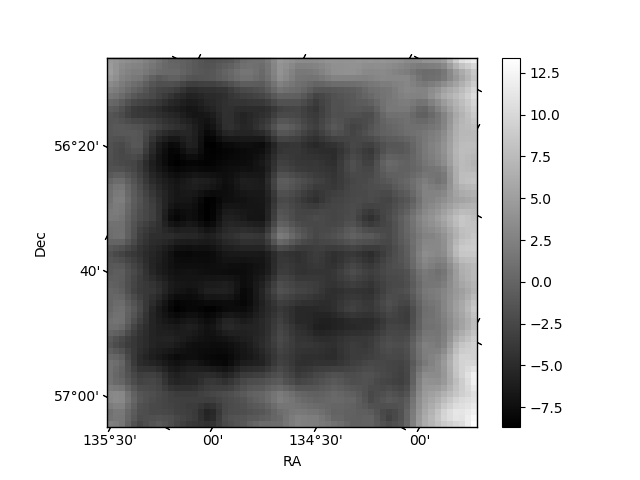
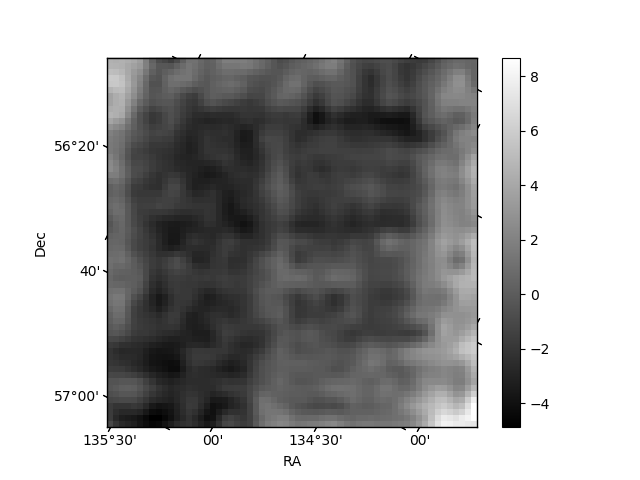
Histogram calculated using DETX and DETY for each event in the final _common_clean file
| Quadrant A | 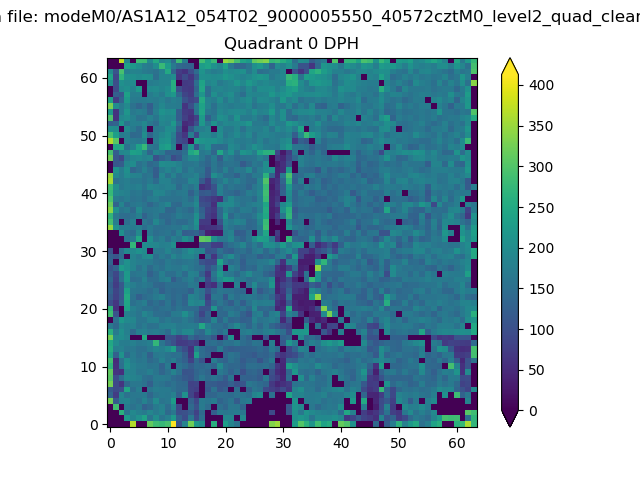 |
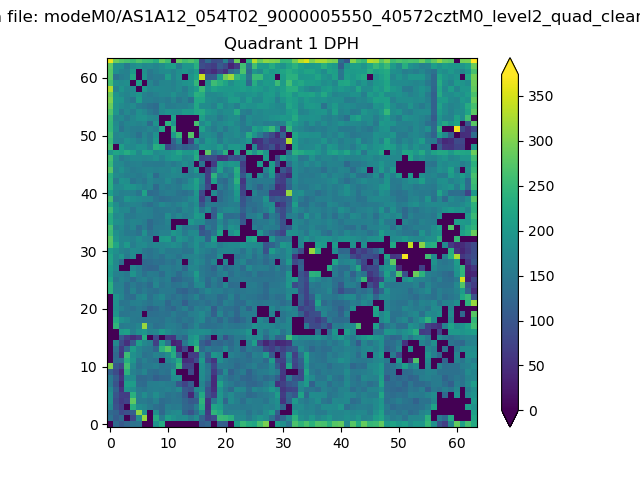 |
Quadrant B |
|---|---|---|---|
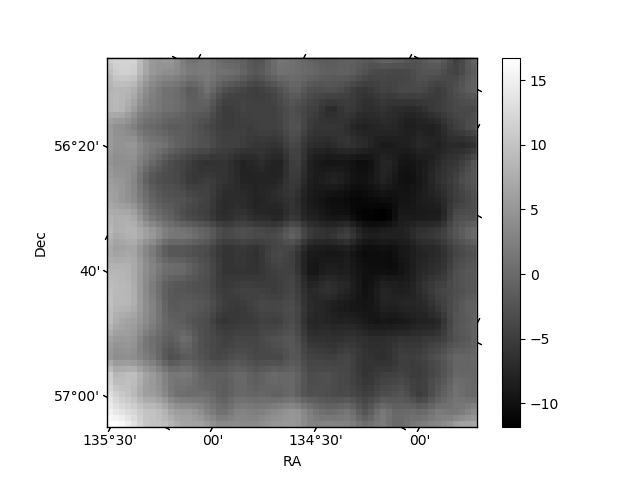
| Quadrant D | 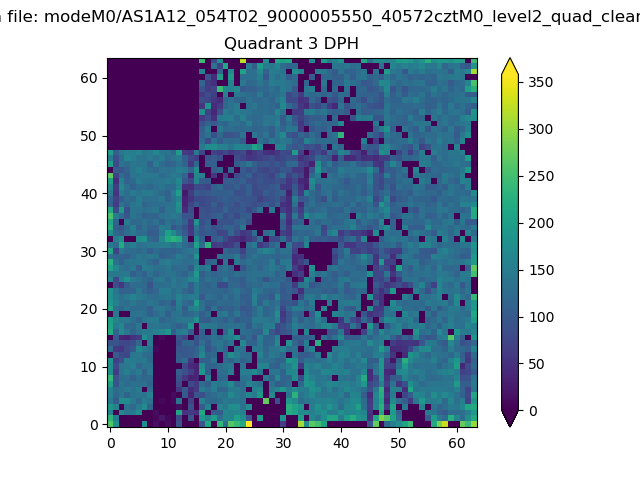 |
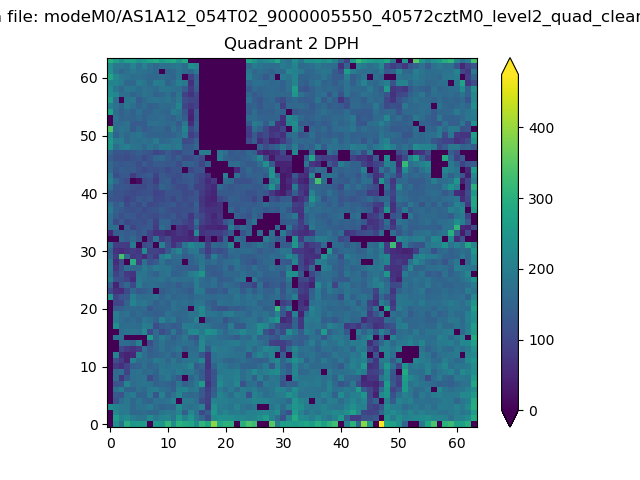 |
Quadrant C |
| Plot type | Count rate plots | Images |
|---|---|---|
| Comparison with Poisson distribution Blue bars denote a histogram of data divided into 1 sec bins. Red curve is a Poisson curve with rate = median count rate of data. |
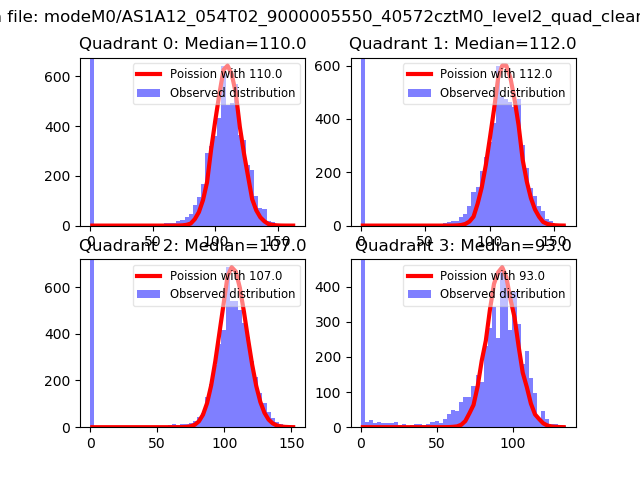 |
 |
| Quadrant-wise count rates Data is divided into 100 sec bins |
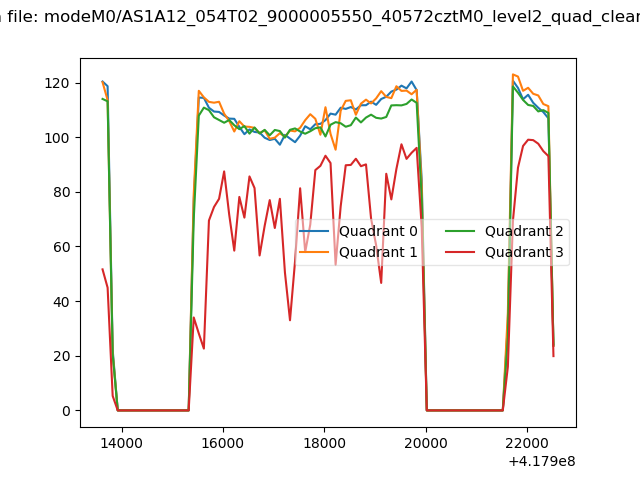 |
|
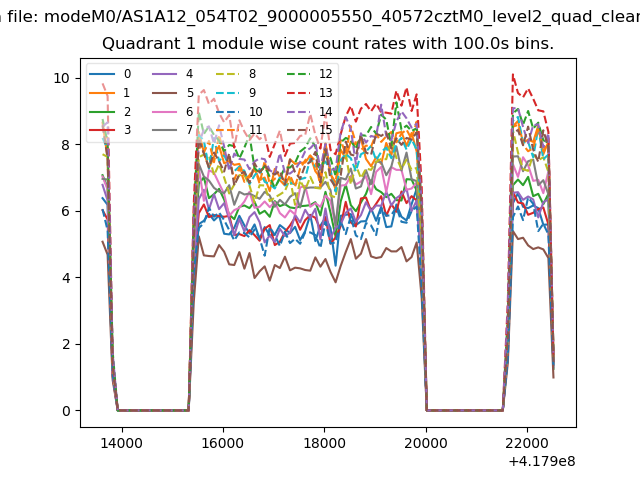
| Module-wise count rates for Quadrant A Data is divided into 100 sec bins |
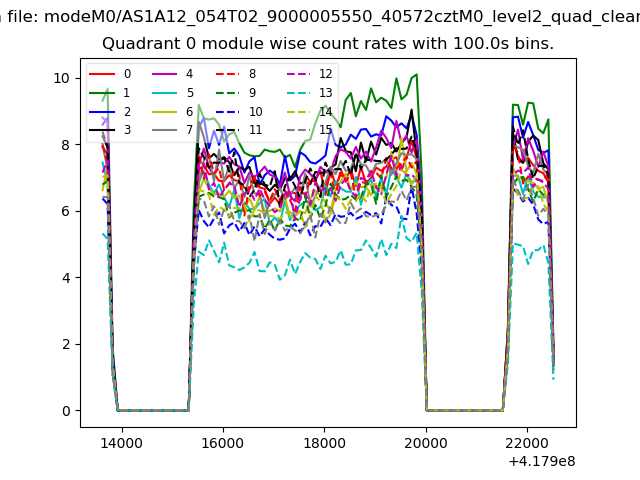 |
 |
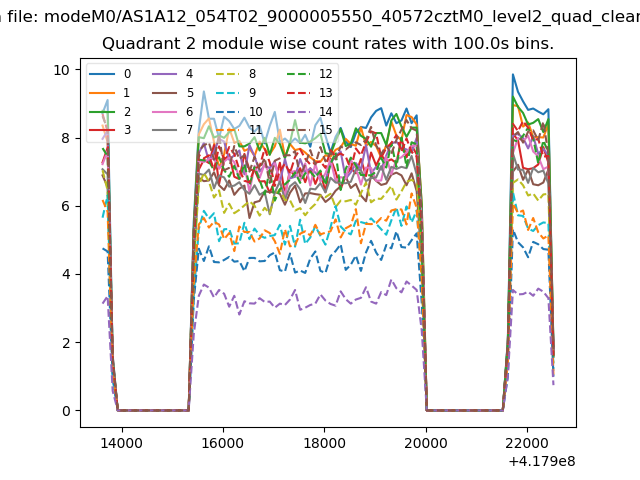
| Module-wise count rates for Quadrant B Data is divided into 100 sec bins |
 |
 |
| Module-wise count rates for Quadrant C Data is divided into 100 sec bins |
 |
 |
| Module-wise count rates for Quadrant D Data is divided into 100 sec bins |
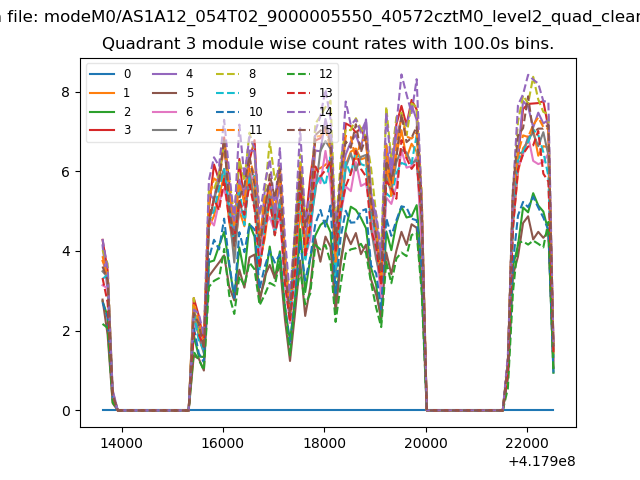 |
 |
| Parameter | Plot |
|---|---|
| CZT HV Monitor | 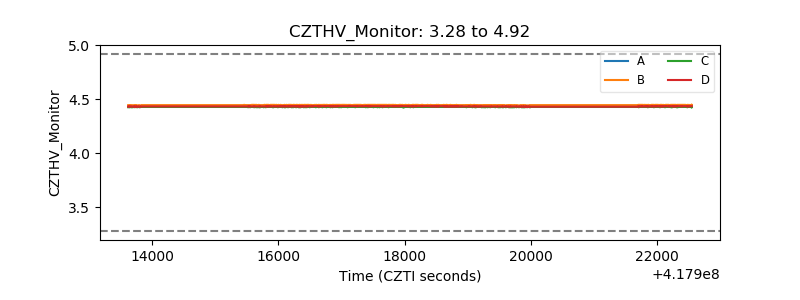 |
| D_VDD | 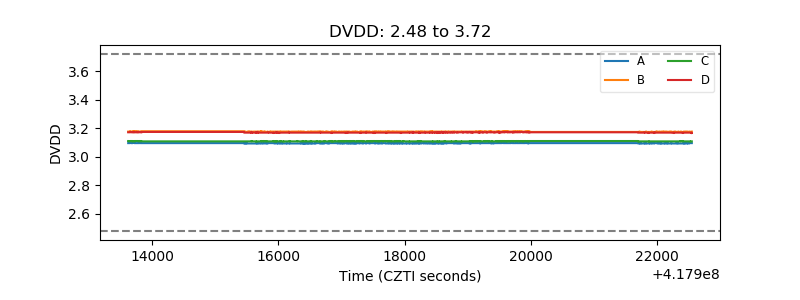 |
| Temperature 1 | 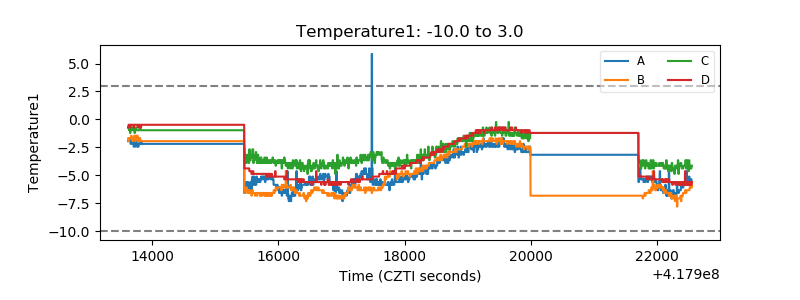 |
| Veto HV Monitor | 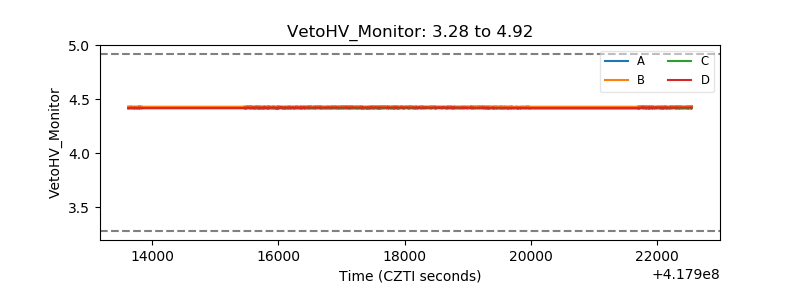 |
| Veto LLD | 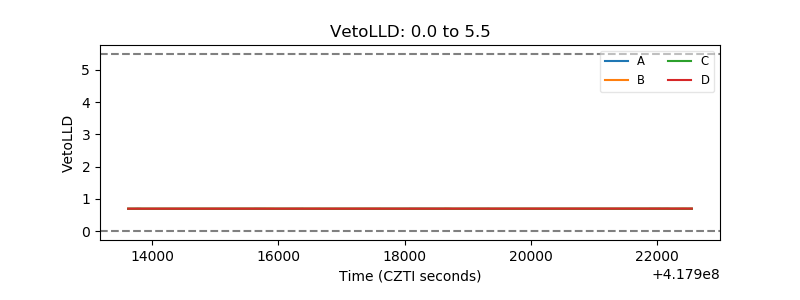 |
| Alpha Counter | 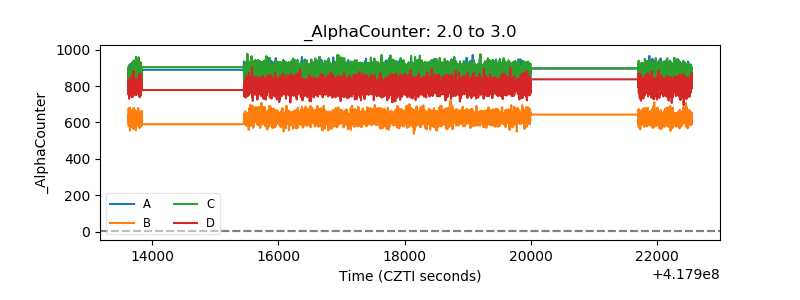 |
| _CPM_Rate | 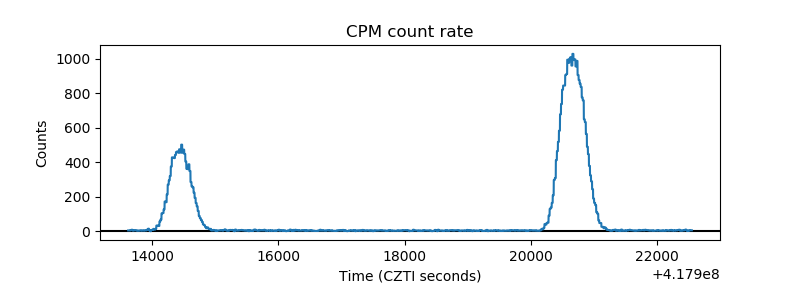 |
| CZT Counter | 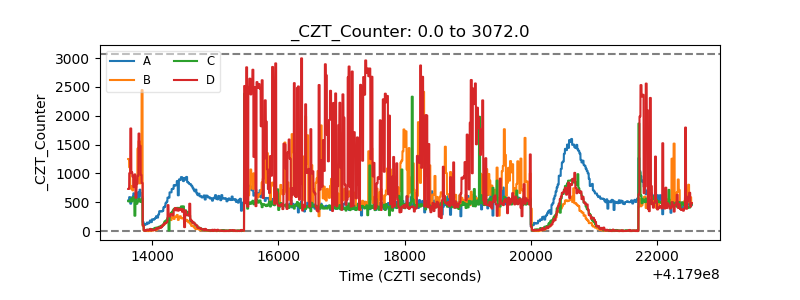 |
| +2.5 Volts monitor | 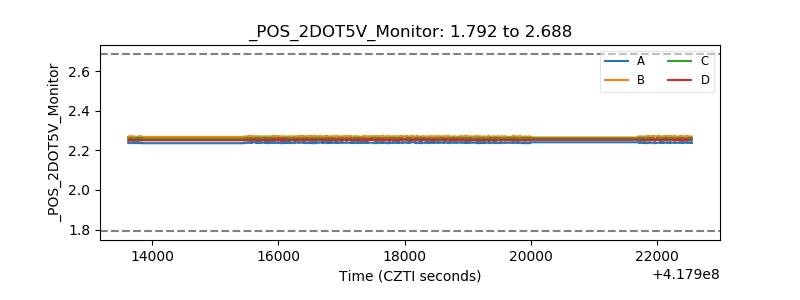 |
| +5 Volts monitor | 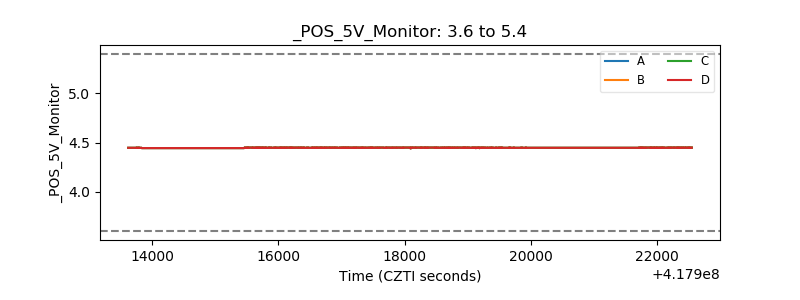 |
| _ROLL_ROT | 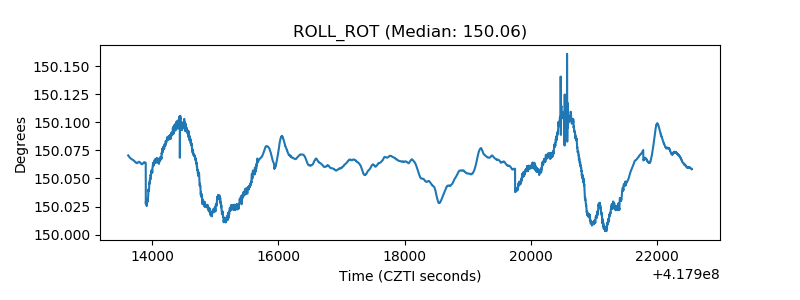 |
| _Roll_DEC | 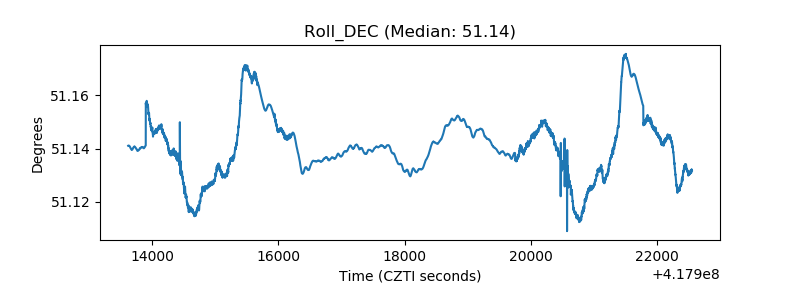 |
| _Roll_RA | 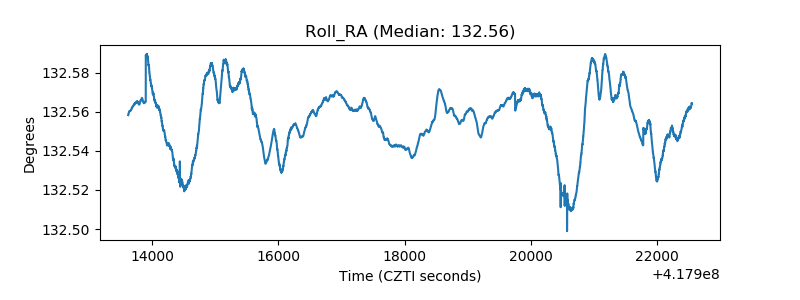 |
| Veto Counter | 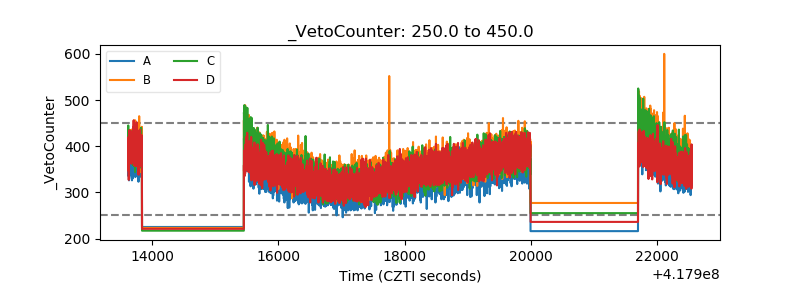 |