| Param | Original file | Final file |
|---|---|---|
| Filename | modeM0/AS1A12_054T02_9000005550_40574cztM0_level2.fits | modeM0/AS1A12_054T02_9000005550_40574cztM0_level2_quad_clean.evt |
| Size (bytes) | 515,442,240 | 77,342,400 |
| Size | 491.6 MB | 73.8 MB |
| Events in quadrant A | 2,805,136 | 598,807 |
| Events in quadrant B | 5,622,980 | 501,190 |
| Events in quadrant C | 2,580,496 | 587,683 |
| Events in quadrant D | 7,654,399 | 278,945 |
| Mode SS | |||
|---|---|---|---|
| Quadrant | BADHDUFLAG | Total packets | Discarded packets |
| A | 0 | 108 | 0 |
| B | 0 | 108 | 0 |
| C | 0 | 108 | 0 |
| D | 0 | 108 | 0 |
| Mode M0 | |||
|---|---|---|---|
| Quadrant | BADHDUFLAG | Total packets | Discarded packets |
| A | 0 | 11563 | 3 |
| B | 0 | 20246 | 2 |
| C | 0 | 11077 | 2 |
| D | 0 | 26561 | 2 |
| Mode M9 | |||
|---|---|---|---|
| Quadrant | BADHDUFLAG | Total packets | Discarded packets |
| A | 0 | 27 | 0 |
| B | 0 | 27 | 0 |
| C | 0 | 27 | 0 |
| D | 0 | 28 | 0 |
| Quadrant | Total seconds | Saturated seconds | Saturation percentage |
|---|---|---|---|
| A | 5354 | 9 | 0.168099% |
| B | 5354 | 1125 | 21.012327% |
| C | 5354 | 21 | 0.392230% |
| D | 5354 | 2717 | 50.747105% |
Noise dominated data is calculated using 1-second bins in cleaned event files. If a bin has >2000 counts, and if more than 50% of those come from <1% of pixels, then it is considered to be noise-dominated and hence unusable.
| Quadrant | # 1 sec bins | Bins with >0 counts | Bins with >2000 counts | High rate bins dominated by noise | Noise dominated (total time) | Noise dominated (detector-on time) | Marked lightcurve |
|---|---|---|---|---|---|---|---|
| A | 7207 | 5355 | 2 | 2 | 0.03% | 0.04% | 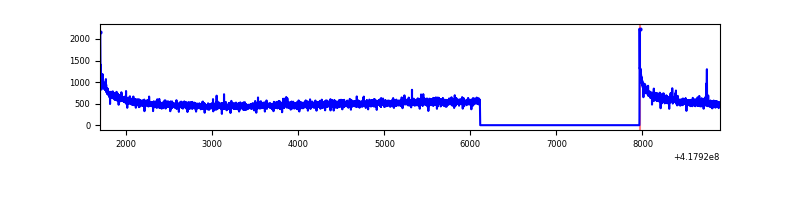 |
| B | 7207 | 5355 | 965 | 965 | 13.39% | 18.02% | 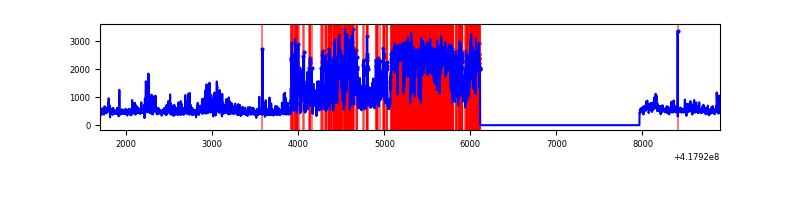 |
| C | 7207 | 5355 | 15 | 15 | 0.21% | 0.28% | 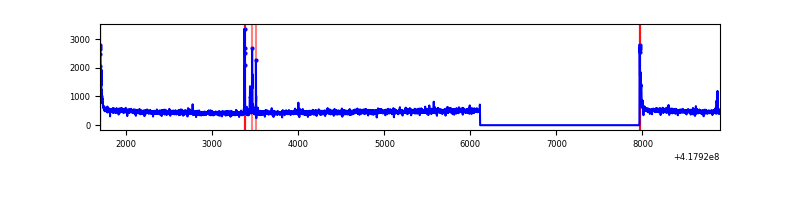 |
| D | 7207 | 5354 | 1979 | 1979 | 27.46% | 36.96% | 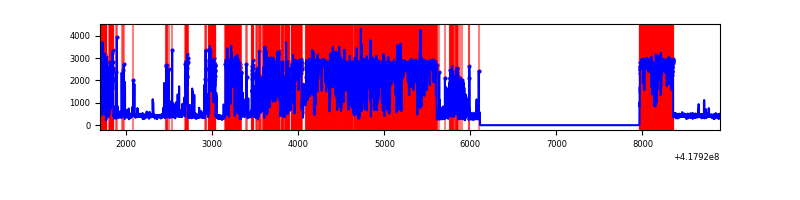 |
Top three noisy pixels from each quadrant. If the there are fewer than three noisy pixels in the level2.evt file, extra rows are filled as -1
| Pixel properties | Quadrant properties | ||||||
|---|---|---|---|---|---|---|---|
| Quadrant | DetID | PixID | Counts | Sigma | Mean | Median | Sigma |
| A | 10 | 83 | 486472 | 4018.38 | 589 | 579 | 120.9 |
| A | 15 | 191 | 22997 | 185.4 | 589 | 579 | 120.9 |
| A | 12 | 189 | 19548 | 156.88 | 589 | 579 | 120.9 |
| B | 3 | 112 | 3186199 | 30572.75 | 539 | 524 | 104.2 |
| B | 0 | 190 | 203318 | 1946.2 | 539 | 524 | 104.2 |
| B | 0 | 230 | 51648 | 490.63 | 539 | 524 | 104.2 |
| C | 15 | 214 | 235577 | 1756.86 | 571 | 574 | 133.8 |
| C | 0 | 10 | 70442 | 522.33 | 571 | 574 | 133.8 |
| C | 14 | 254 | 42211 | 311.27 | 571 | 574 | 133.8 |
| D | 12 | 227 | 5747064 | 57589.05 | 399 | 389 | 99.8 |
| D | 12 | 191 | 145615 | 1455.35 | 399 | 389 | 99.8 |
| D | 2 | 250 | 92688 | 924.95 | 399 | 389 | 99.8 |
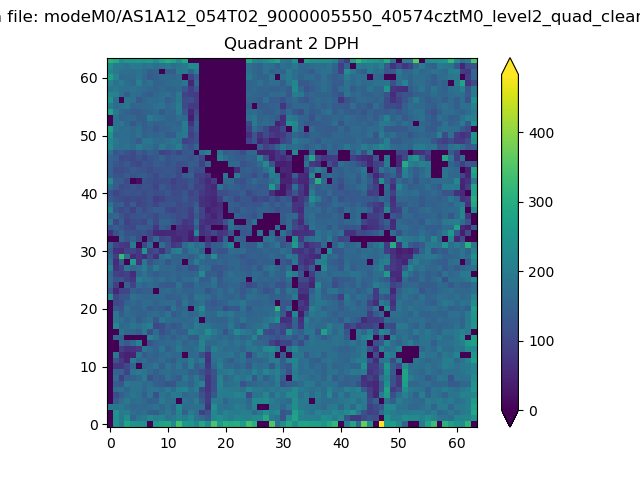
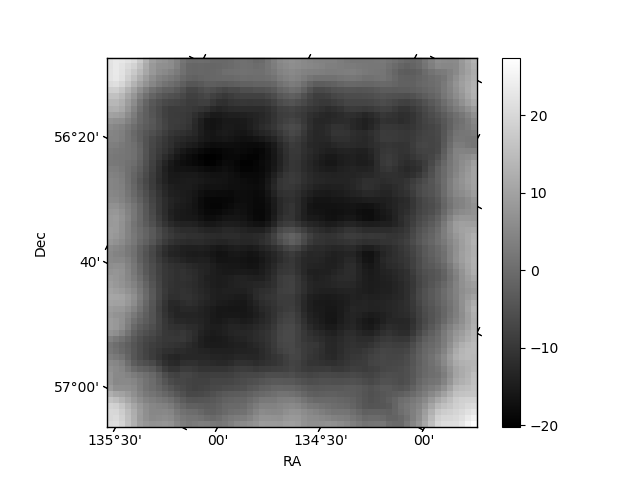
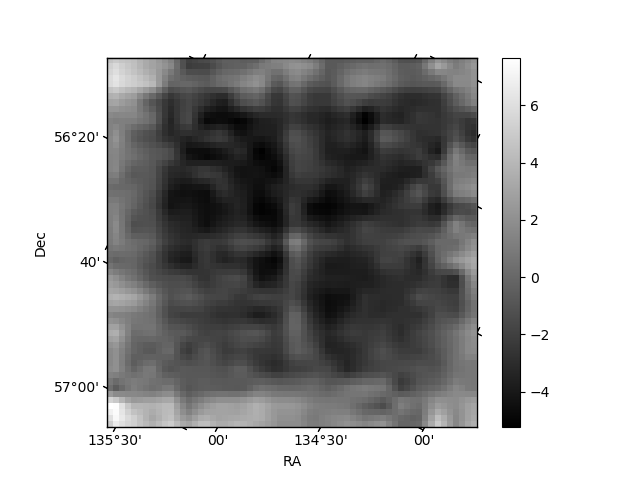
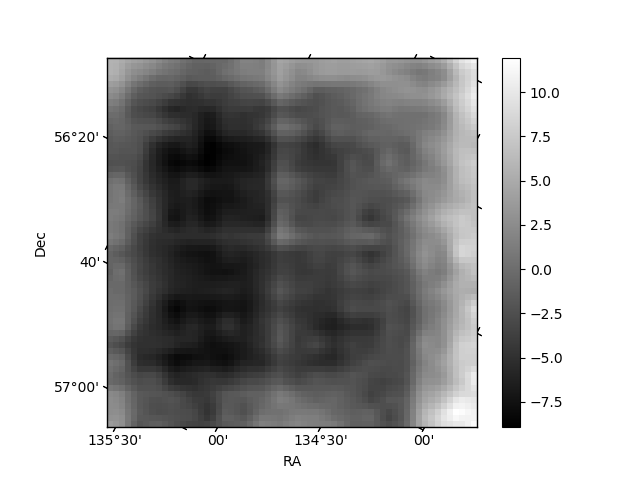
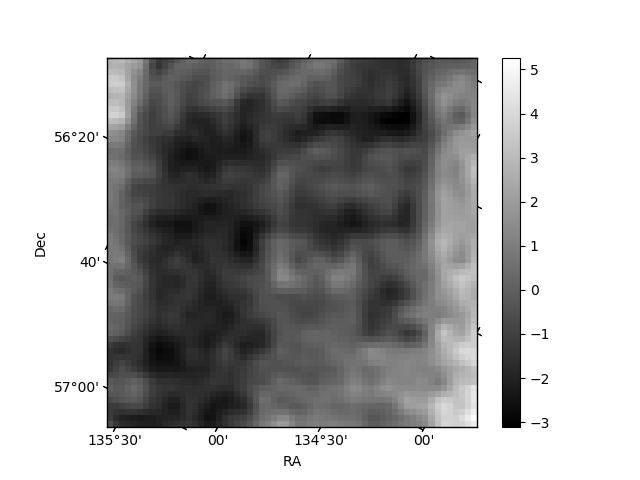
Histogram calculated using DETX and DETY for each event in the final _common_clean file
| Quadrant A | 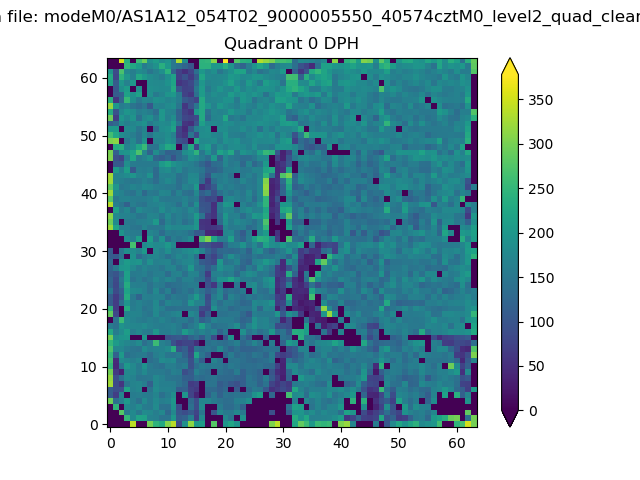 |
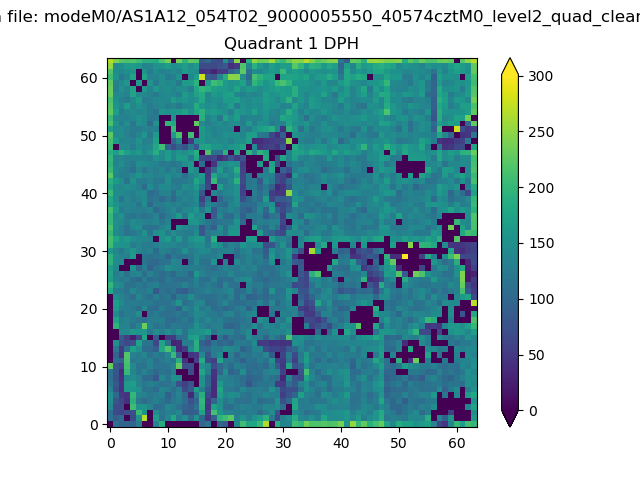 |
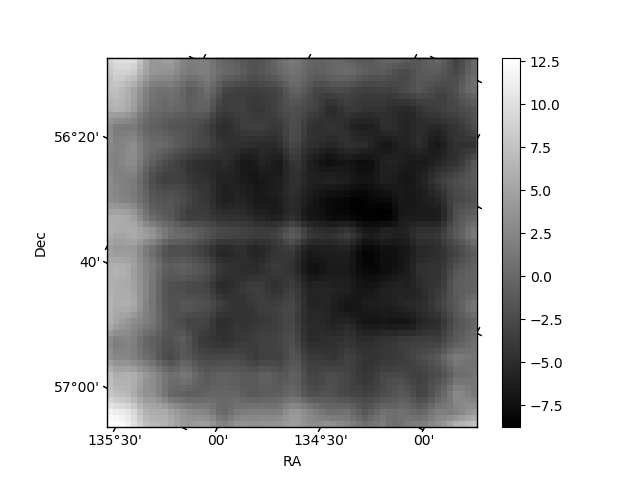
Quadrant B |
|---|---|---|---|
| Quadrant D | 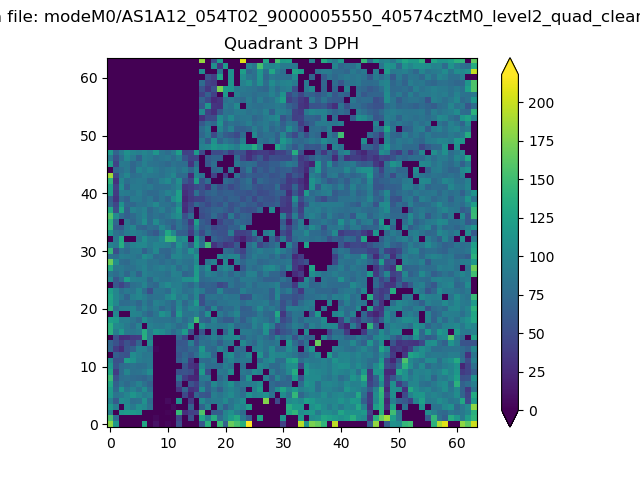 |
 |
Quadrant C |
| Plot type | Count rate plots | Images |
|---|---|---|
| Comparison with Poisson distribution Blue bars denote a histogram of data divided into 1 sec bins. Red curve is a Poisson curve with rate = median count rate of data. |
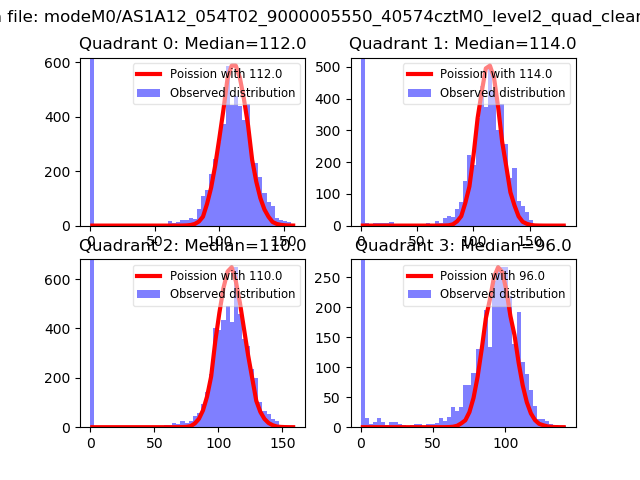 |
 |
| Quadrant-wise count rates Data is divided into 100 sec bins |
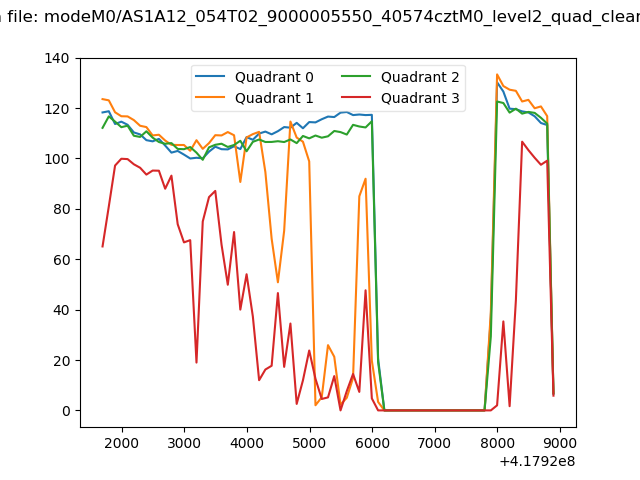 |
|
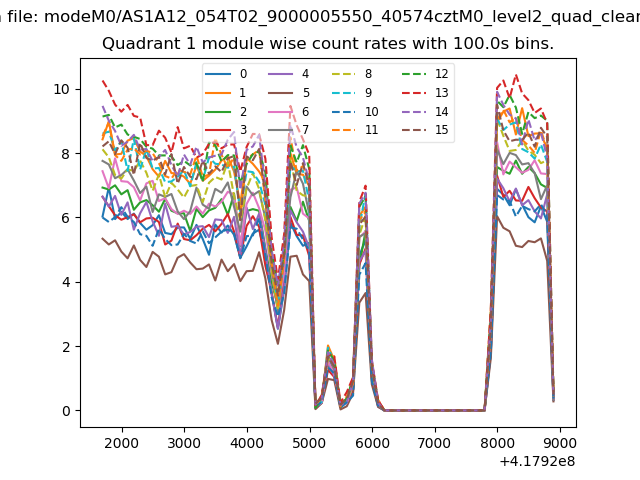
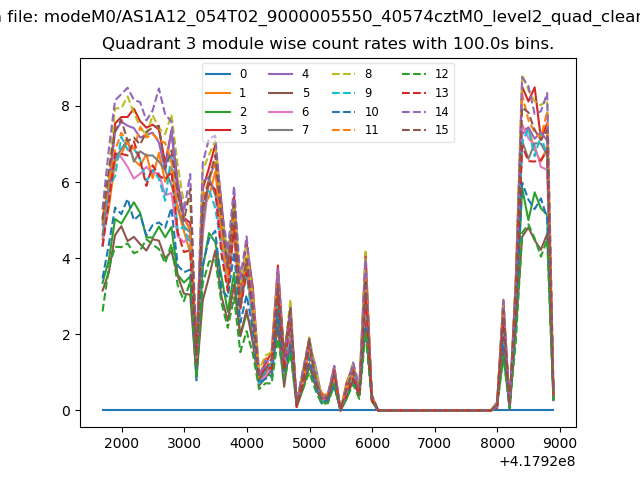
| Module-wise count rates for Quadrant A Data is divided into 100 sec bins |
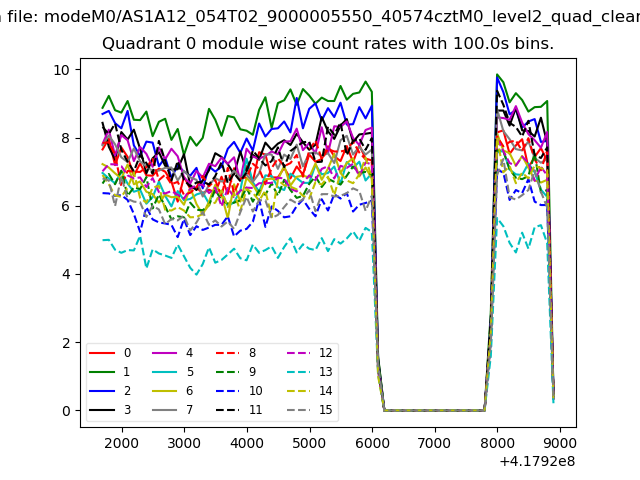 |
 |
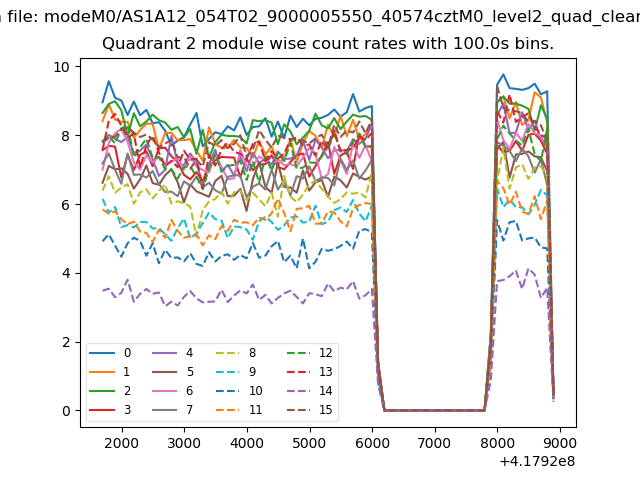
| Module-wise count rates for Quadrant B Data is divided into 100 sec bins |
 |
 |
| Module-wise count rates for Quadrant C Data is divided into 100 sec bins |
 |
 |
| Module-wise count rates for Quadrant D Data is divided into 100 sec bins |
 |
 |
| Parameter | Plot |
|---|---|
| CZT HV Monitor | 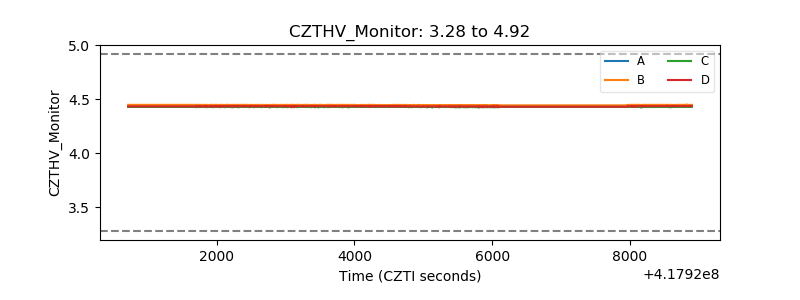 |
| D_VDD | 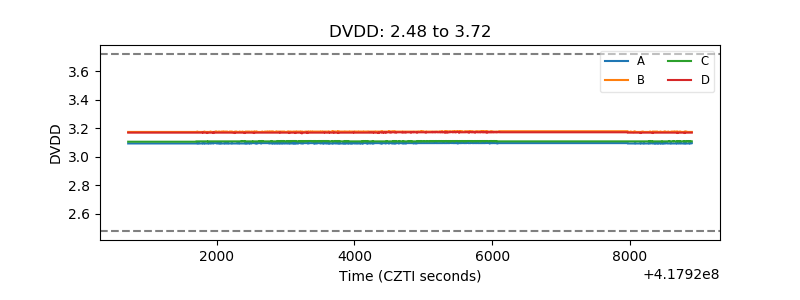 |
| Temperature 1 | 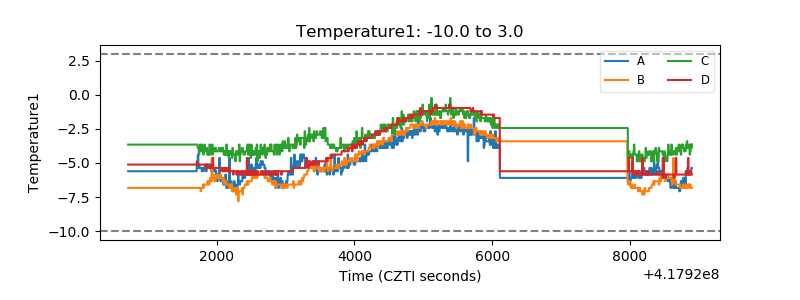 |
| Veto HV Monitor |  |
| Veto LLD | 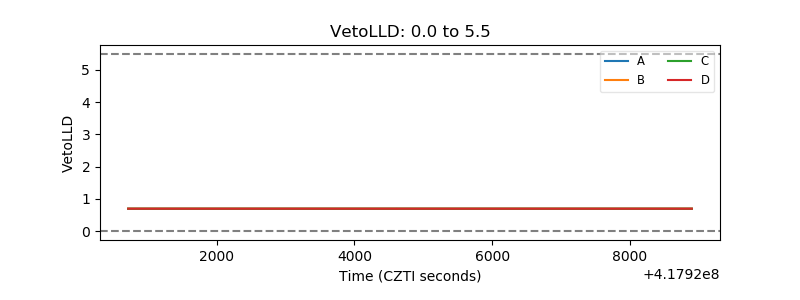 |
| Alpha Counter | 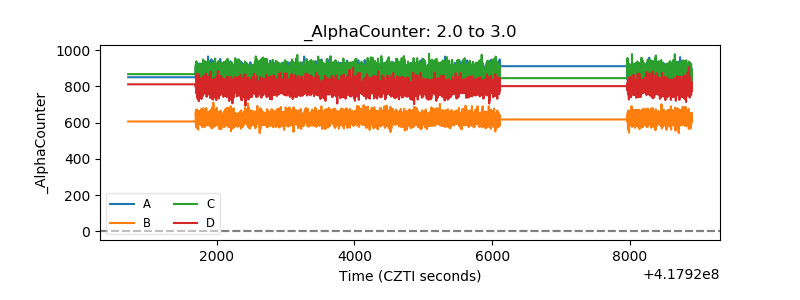 |
| _CPM_Rate | 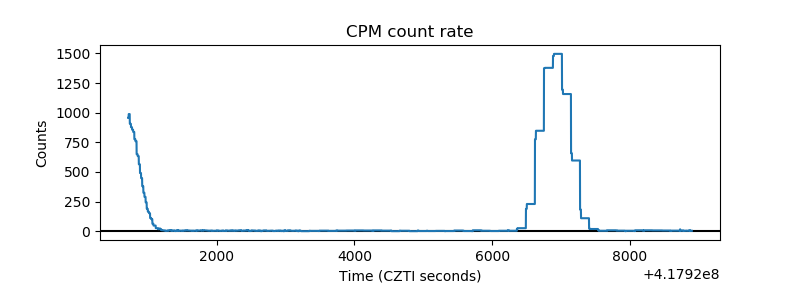 |
| CZT Counter | 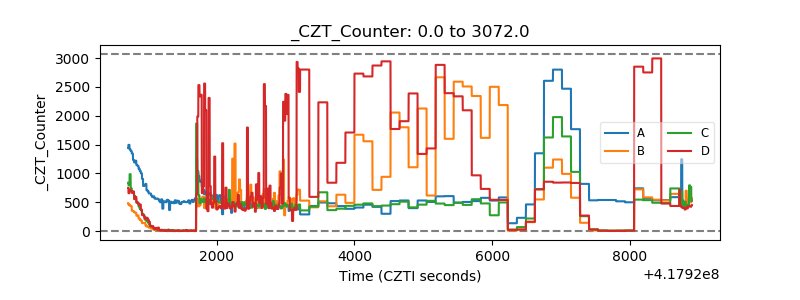 |
| +2.5 Volts monitor | 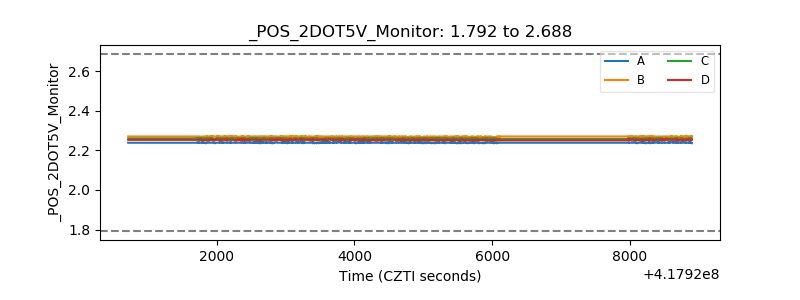 |
| +5 Volts monitor | 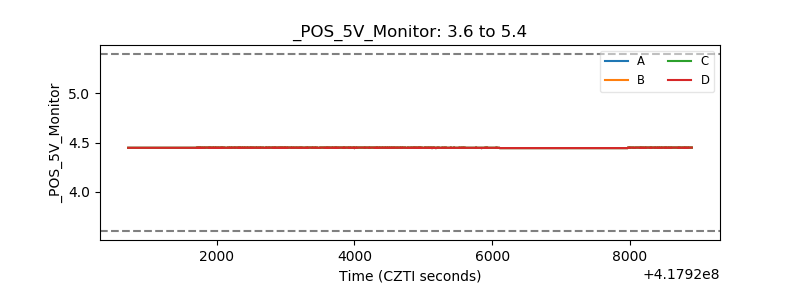 |
| _ROLL_ROT | 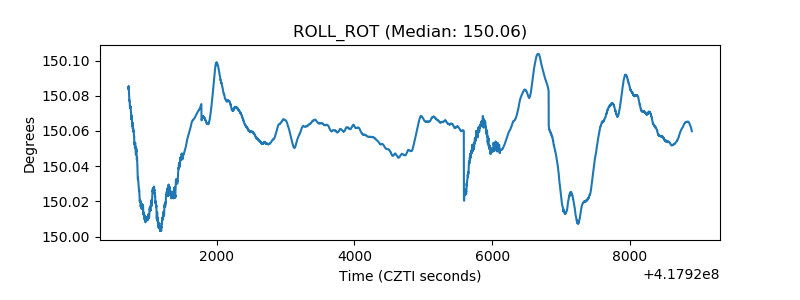 |
| _Roll_DEC | 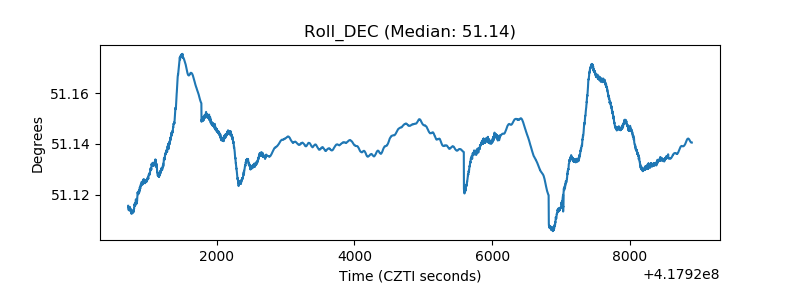 |
| _Roll_RA | 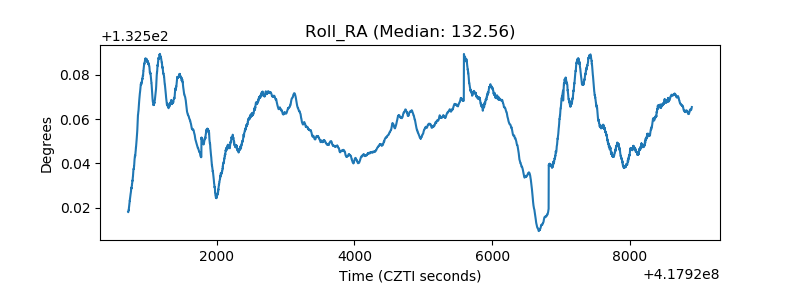 |
| Veto Counter | 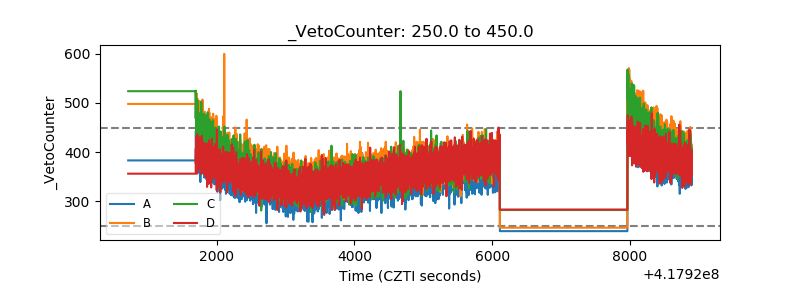 |