| Param | Original file | Final file |
|---|---|---|
| Filename | modeM0/AS1A12_054T02_9000005550_40575cztM0_level2.fits | modeM0/AS1A12_054T02_9000005550_40575cztM0_level2_quad_clean.evt |
| Size (bytes) | 502,145,280 | 82,753,920 |
| Size | 478.9 MB | 78.9 MB |
| Events in quadrant A | 2,978,501 | 625,731 |
| Events in quadrant B | 3,605,819 | 642,413 |
| Events in quadrant C | 2,754,692 | 608,242 |
| Events in quadrant D | 8,835,872 | 258,082 |
| Mode SS | |||
|---|---|---|---|
| Quadrant | BADHDUFLAG | Total packets | Discarded packets |
| A | 0 | 108 | 0 |
| B | 0 | 108 | 0 |
| C | 0 | 108 | 0 |
| D | 0 | 108 | 0 |
| Mode M0 | |||
|---|---|---|---|
| Quadrant | BADHDUFLAG | Total packets | Discarded packets |
| A | 0 | 11946 | 3 |
| B | 0 | 14235 | 2 |
| C | 0 | 11392 | 2 |
| D | 0 | 29850 | 2 |
| Mode M9 | |||
|---|---|---|---|
| Quadrant | BADHDUFLAG | Total packets | Discarded packets |
| A | 0 | 26 | 0 |
| B | 0 | 26 | 0 |
| C | 0 | 26 | 0 |
| D | 0 | 27 | 0 |
| Quadrant | Total seconds | Saturated seconds | Saturation percentage |
|---|---|---|---|
| A | 5304 | 12 | 0.226244% |
| B | 5304 | 72 | 1.357466% |
| C | 5304 | 15 | 0.282805% |
| D | 5304 | 3007 | 56.693062% |
Noise dominated data is calculated using 1-second bins in cleaned event files. If a bin has >2000 counts, and if more than 50% of those come from <1% of pixels, then it is considered to be noise-dominated and hence unusable.
| Quadrant | # 1 sec bins | Bins with >0 counts | Bins with >2000 counts | High rate bins dominated by noise | Noise dominated (total time) | Noise dominated (detector-on time) | Marked lightcurve |
|---|---|---|---|---|---|---|---|
| A | 7277 | 5305 | 5 | 5 | 0.07% | 0.09% | 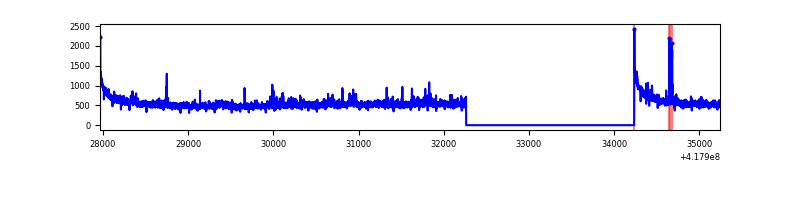 |
| B | 7277 | 5305 | 42 | 42 | 0.58% | 0.79% | 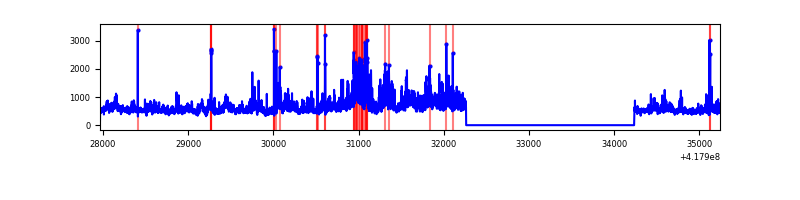 |
| C | 7277 | 5305 | 10 | 10 | 0.14% | 0.19% | 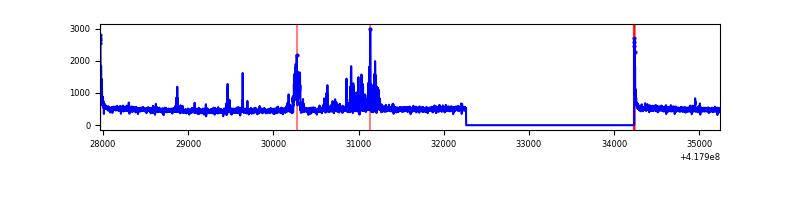 |
| D | 7277 | 5305 | 2659 | 2659 | 36.54% | 50.12% | 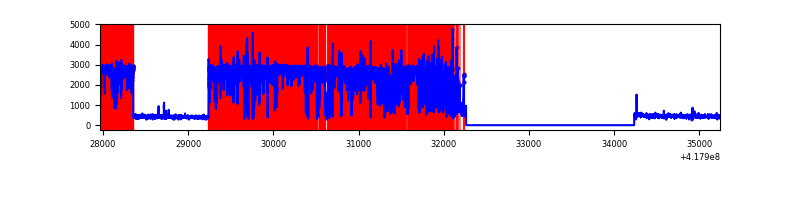 |
Top three noisy pixels from each quadrant. If the there are fewer than three noisy pixels in the level2.evt file, extra rows are filled as -1
| Pixel properties | Quadrant properties | ||||||
|---|---|---|---|---|---|---|---|
| Quadrant | DetID | PixID | Counts | Sigma | Mean | Median | Sigma |
| A | 10 | 83 | 483088 | 3944.12 | 604 | 595 | 122.3 |
| A | 12 | 189 | 77138 | 625.7 | 604 | 595 | 122.3 |
| A | 15 | 191 | 36319 | 292.02 | 604 | 595 | 122.3 |
| B | 0 | 190 | 622195 | 5459.01 | 598 | 582 | 113.9 |
| B | 3 | 112 | 491698 | 4312.99 | 598 | 582 | 113.9 |
| B | 5 | 255 | 84010 | 732.67 | 598 | 582 | 113.9 |
| C | 15 | 214 | 234405 | 1724.78 | 583 | 587 | 135.6 |
| C | 14 | 254 | 179510 | 1319.84 | 583 | 587 | 135.6 |
| C | 0 | 10 | 57736 | 421.56 | 583 | 587 | 135.6 |
| D | 12 | 227 | 7216621 | 78639.28 | 367 | 356 | 91.8 |
| D | 12 | 191 | 86382 | 937.47 | 367 | 356 | 91.8 |
| D | 13 | 249 | 83706 | 908.31 | 367 | 356 | 91.8 |
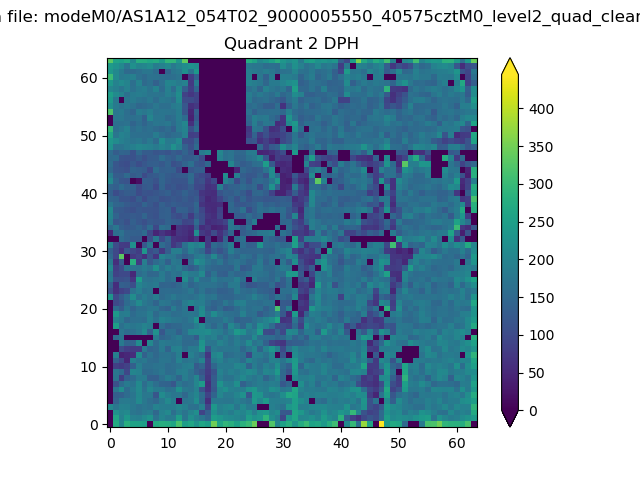
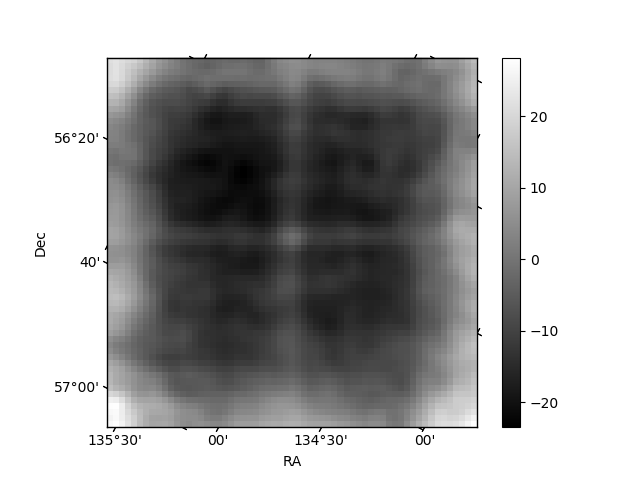
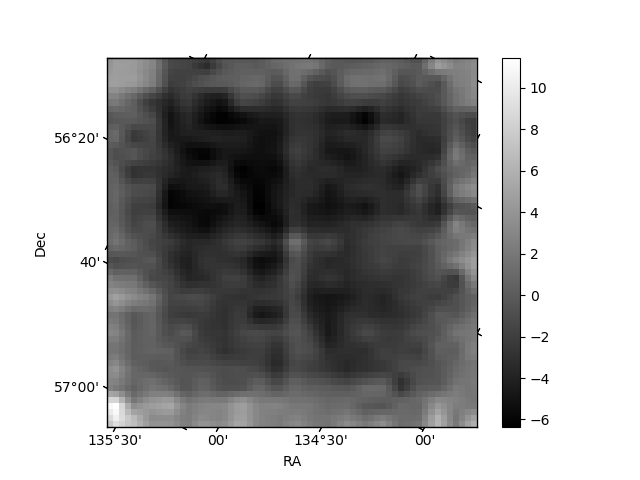
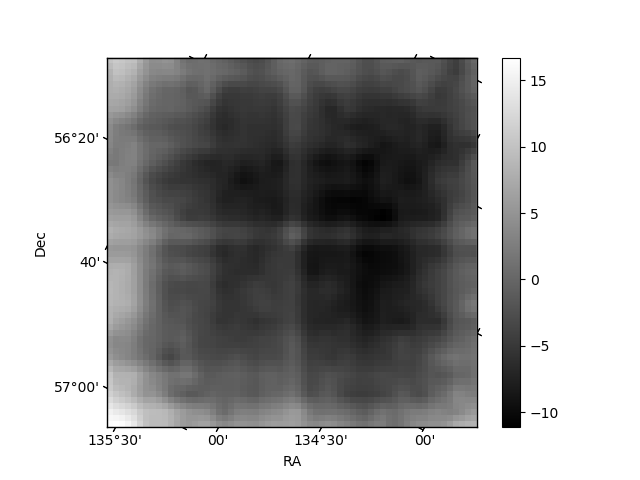
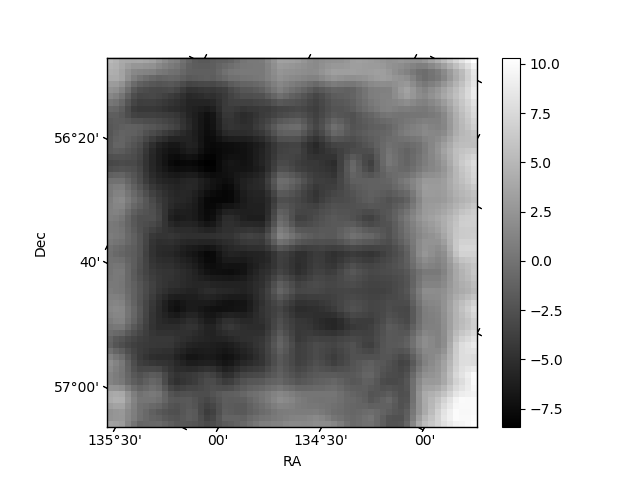
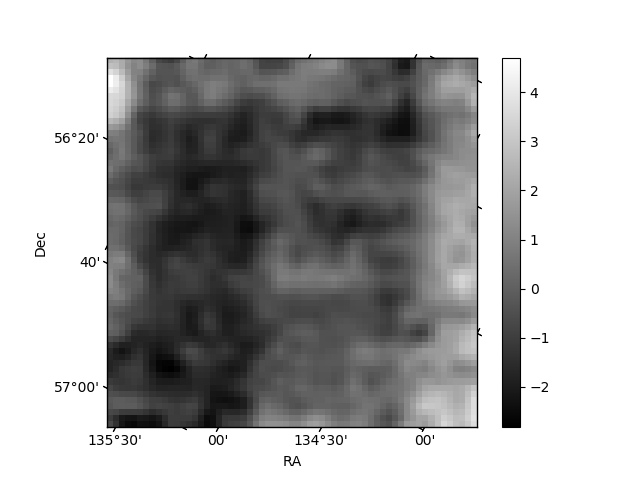
Histogram calculated using DETX and DETY for each event in the final _common_clean file
| Quadrant A | 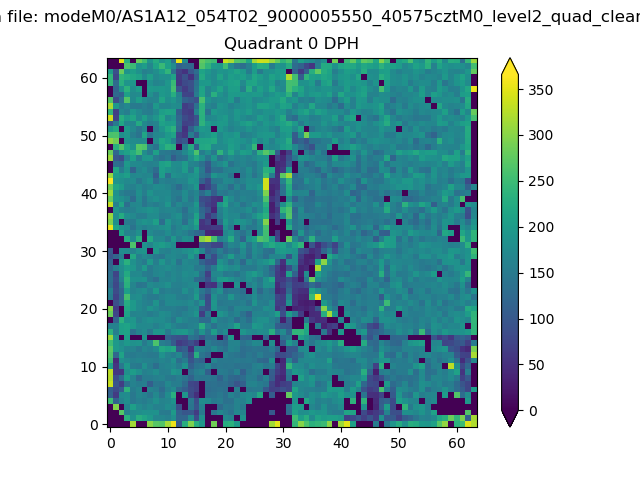 |
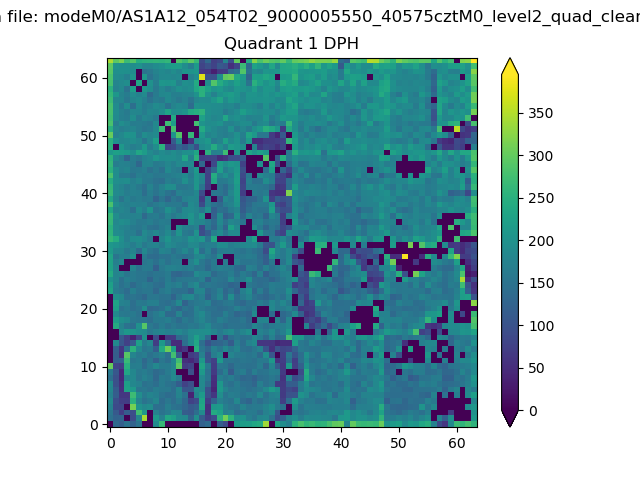 |
Quadrant B |
|---|---|---|---|
| Quadrant D | 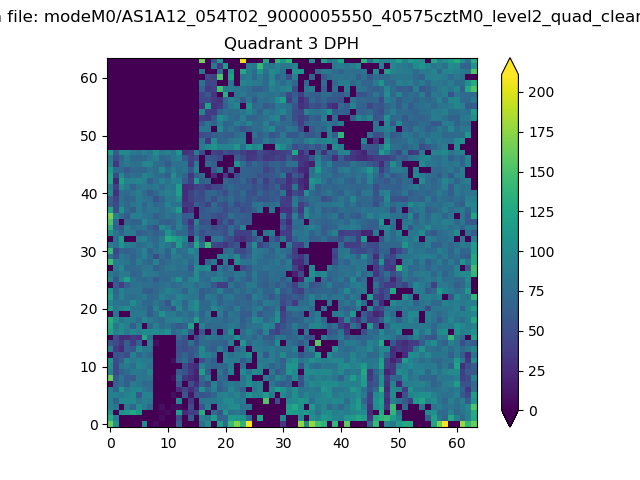 |
 |
Quadrant C |
| Plot type | Count rate plots | Images |
|---|---|---|
| Comparison with Poisson distribution Blue bars denote a histogram of data divided into 1 sec bins. Red curve is a Poisson curve with rate = median count rate of data. |
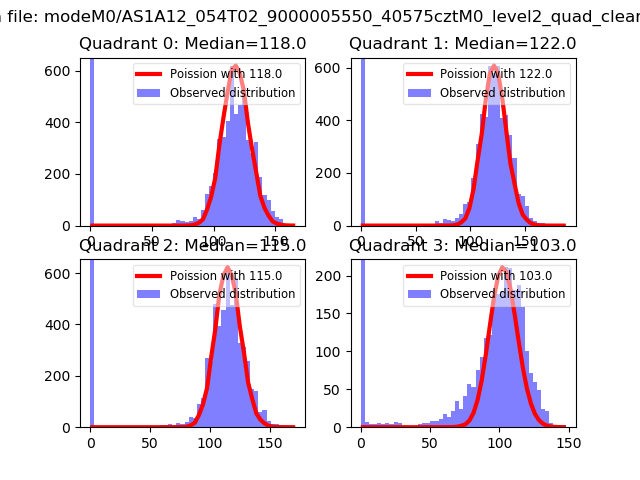 |
 |
| Quadrant-wise count rates Data is divided into 100 sec bins |
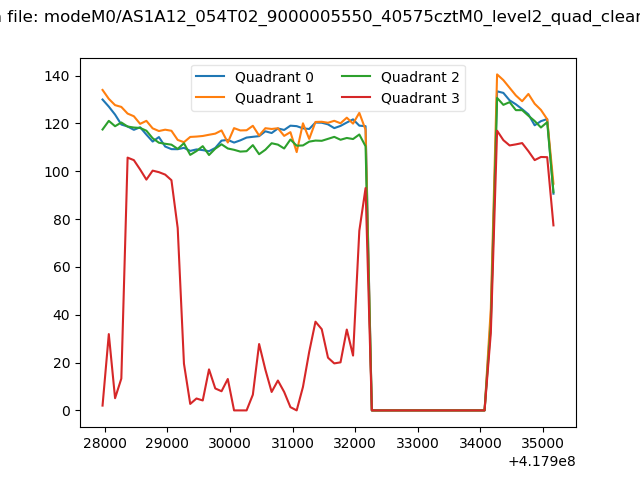 |
|
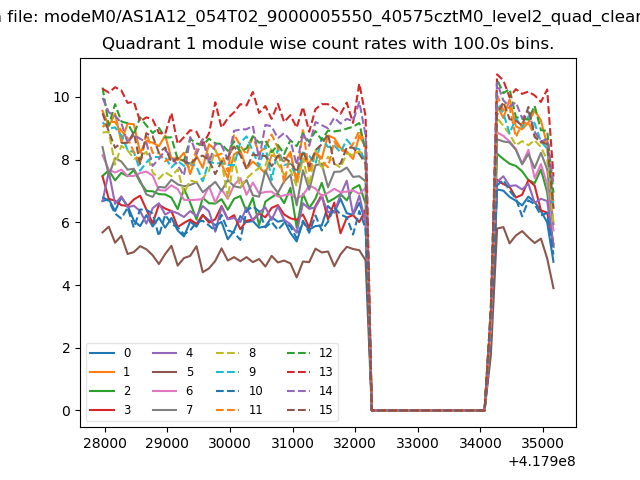
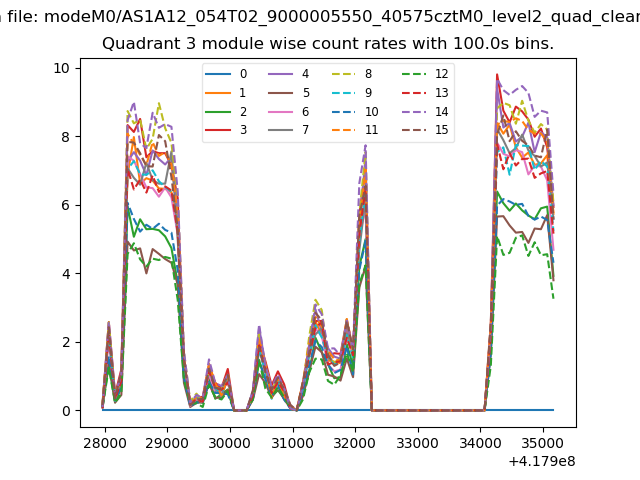
| Module-wise count rates for Quadrant A Data is divided into 100 sec bins |
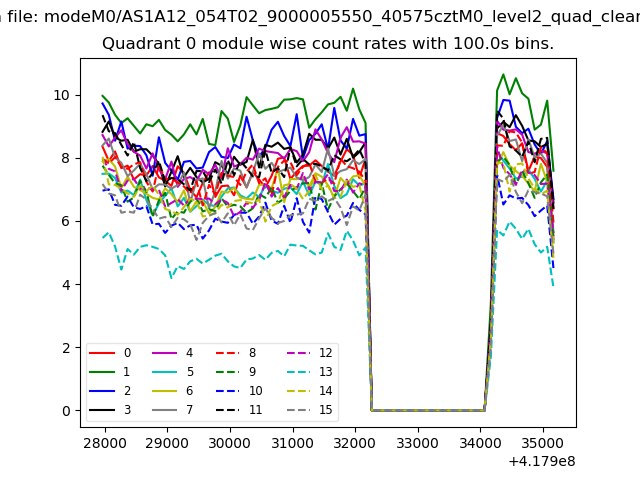 |
 |
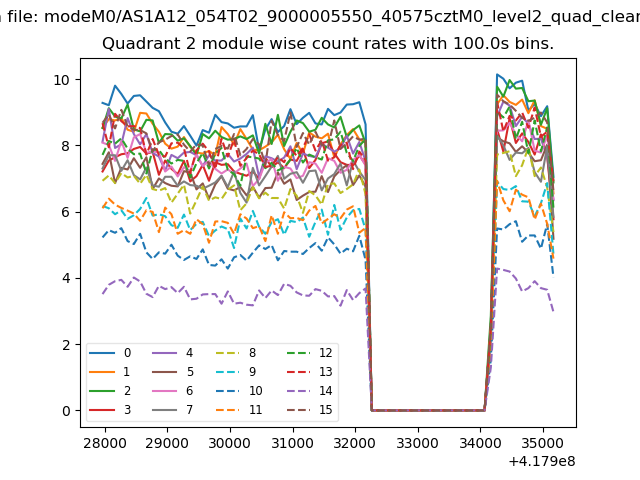
| Module-wise count rates for Quadrant B Data is divided into 100 sec bins |
 |
 |
| Module-wise count rates for Quadrant C Data is divided into 100 sec bins |
 |
 |
| Module-wise count rates for Quadrant D Data is divided into 100 sec bins |
 |
 |
| Parameter | Plot |
|---|---|
| CZT HV Monitor | 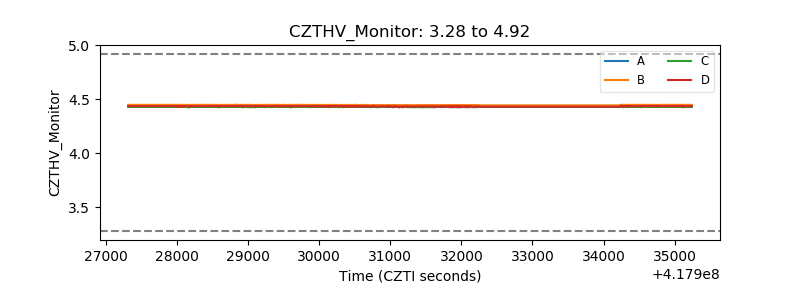 |
| D_VDD | 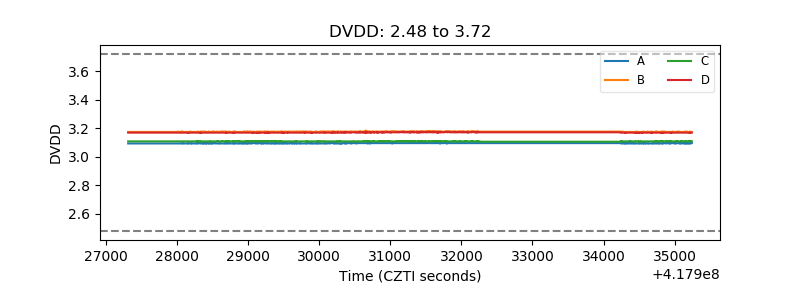 |
| Temperature 1 | 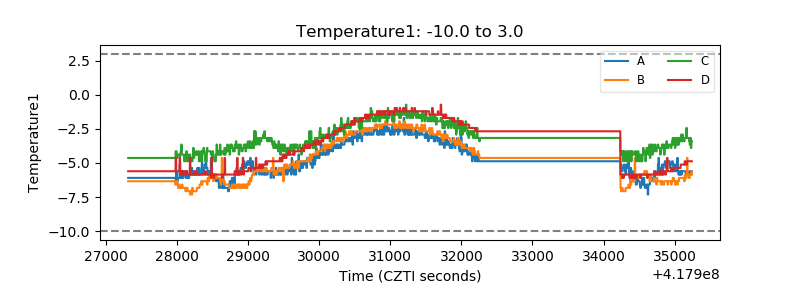 |
| Veto HV Monitor | 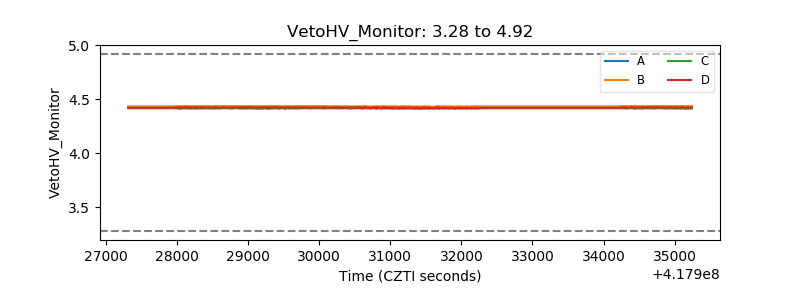 |
| Veto LLD | 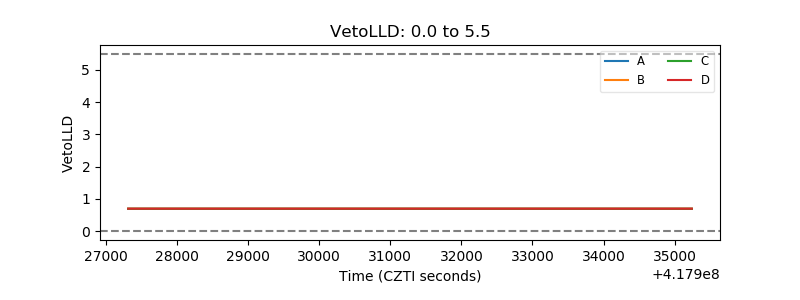 |
| Alpha Counter | 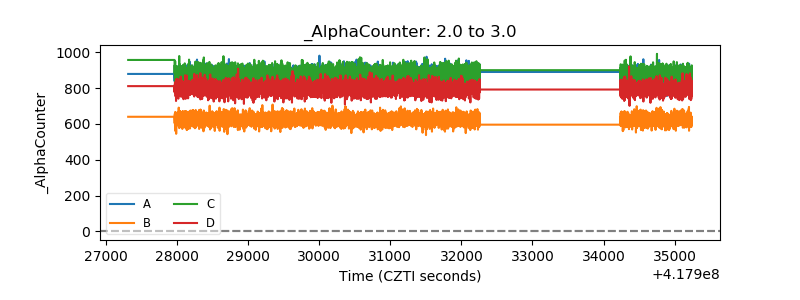 |
| _CPM_Rate | 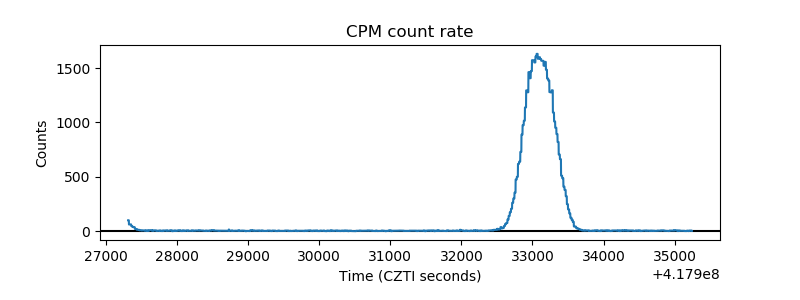 |
| CZT Counter | 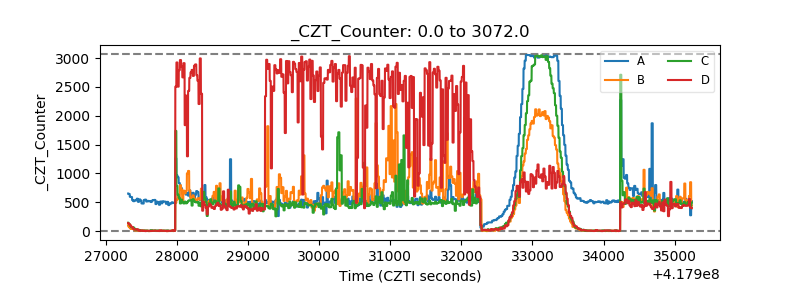 |
| +2.5 Volts monitor | 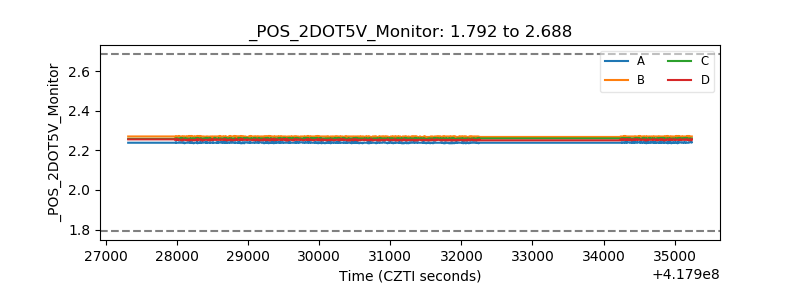 |
| +5 Volts monitor | 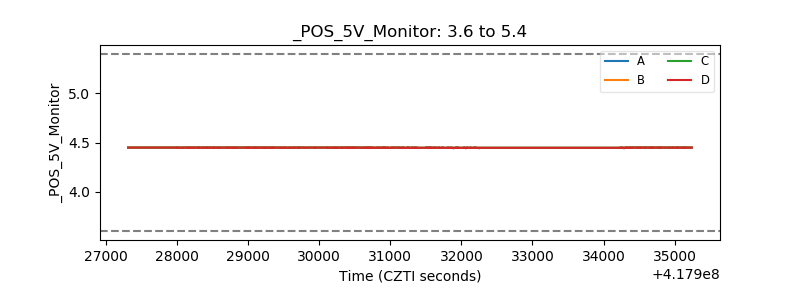 |
| _ROLL_ROT | 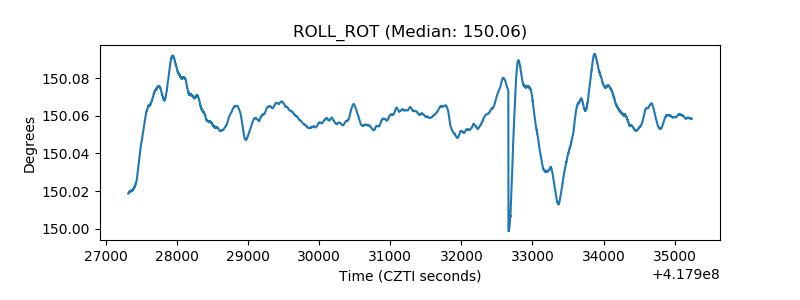 |
| _Roll_DEC | 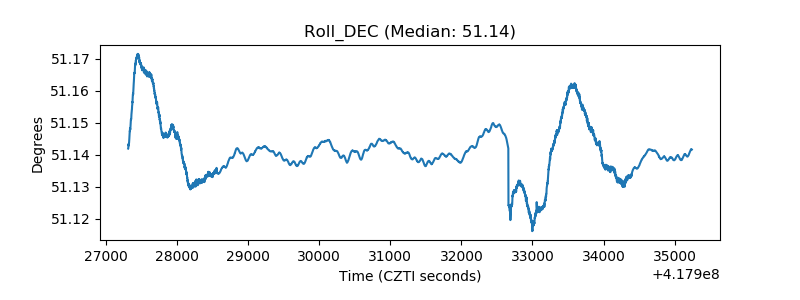 |
| _Roll_RA | 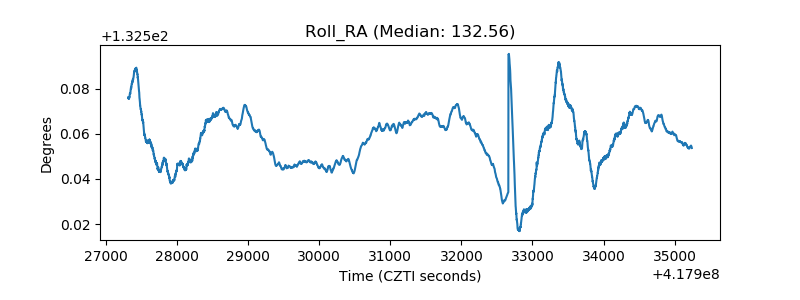 |
| Veto Counter | 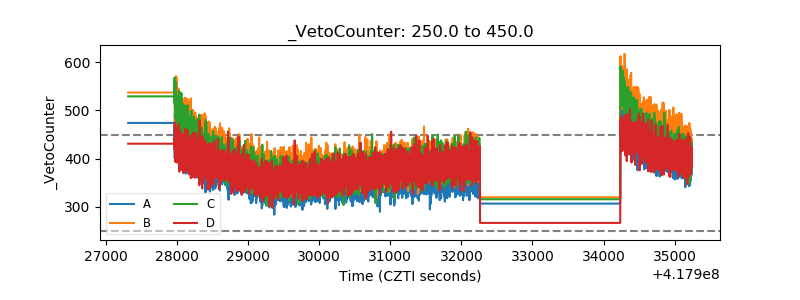 |