| Param | Original file | Final file |
|---|---|---|
| Filename | modeM0/AS1A12_054T02_9000005550_40576cztM0_level2.fits | modeM0/AS1A12_054T02_9000005550_40576cztM0_level2_quad_clean.evt |
| Size (bytes) | 302,457,600 | 88,447,680 |
| Size | 288.4 MB | 84.4 MB |
| Events in quadrant A | 2,900,908 | 619,490 |
| Events in quadrant B | 2,916,158 | 633,884 |
| Events in quadrant C | 2,474,431 | 594,600 |
| Events in quadrant D | 2,510,065 | 476,005 |
| Mode SS | |||
|---|---|---|---|
| Quadrant | BADHDUFLAG | Total packets | Discarded packets |
| A | 0 | 106 | 0 |
| B | 0 | 106 | 0 |
| C | 0 | 106 | 0 |
| D | 0 | 106 | 0 |
| Mode M0 | |||
|---|---|---|---|
| Quadrant | BADHDUFLAG | Total packets | Discarded packets |
| A | 0 | 11468 | 3 |
| B | 0 | 11765 | 2 |
| C | 0 | 10295 | 2 |
| D | 0 | 10884 | 2 |
| Mode M9 | |||
|---|---|---|---|
| Quadrant | BADHDUFLAG | Total packets | Discarded packets |
| A | 0 | 40 | 0 |
| B | 0 | 40 | 0 |
| C | 0 | 40 | 0 |
| D | 0 | 40 | 0 |
| Quadrant | Total seconds | Saturated seconds | Saturation percentage |
|---|---|---|---|
| A | 5050 | 12 | 0.237624% |
| B | 5050 | 28 | 0.554455% |
| C | 5050 | 11 | 0.217822% |
| D | 5050 | 747 | 14.792079% |
Noise dominated data is calculated using 1-second bins in cleaned event files. If a bin has >2000 counts, and if more than 50% of those come from <1% of pixels, then it is considered to be noise-dominated and hence unusable.
| Quadrant | # 1 sec bins | Bins with >0 counts | Bins with >2000 counts | High rate bins dominated by noise | Noise dominated (total time) | Noise dominated (detector-on time) | Marked lightcurve |
|---|---|---|---|---|---|---|---|
| A | 9087 | 5052 | 8 | 8 | 0.09% | 0.16% | 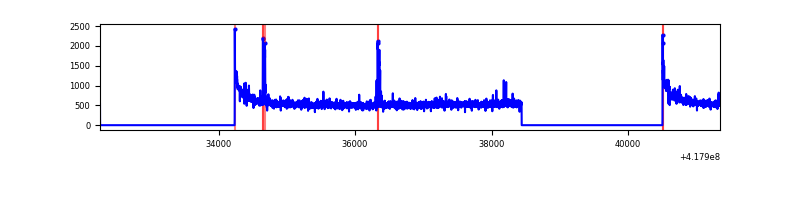 |
| B | 9087 | 5052 | 17 | 17 | 0.19% | 0.34% | 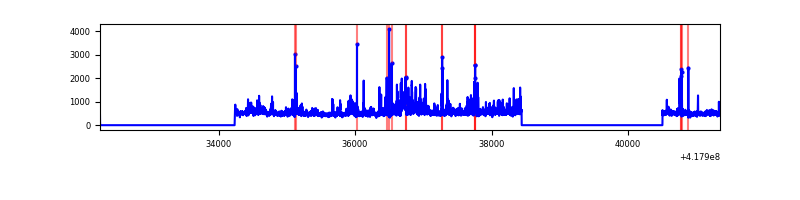 |
| C | 9087 | 5052 | 6 | 6 | 0.07% | 0.12% | 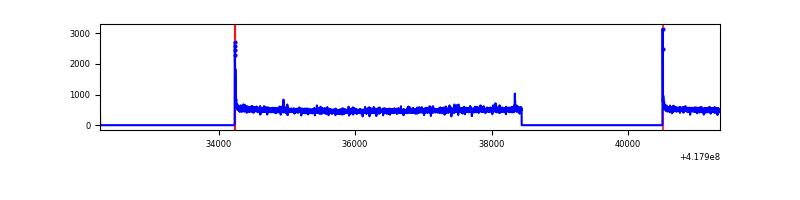 |
| D | 9087 | 5052 | 19 | 19 | 0.21% | 0.38% | 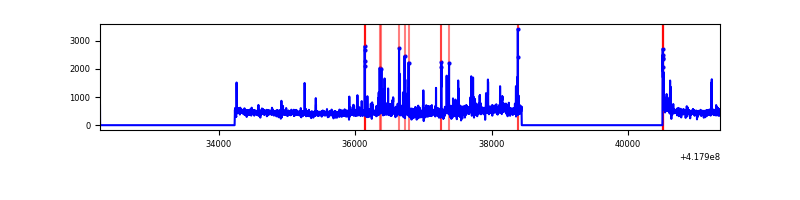 |
Top three noisy pixels from each quadrant. If the there are fewer than three noisy pixels in the level2.evt file, extra rows are filled as -1
| Pixel properties | Quadrant properties | ||||||
|---|---|---|---|---|---|---|---|
| Quadrant | DetID | PixID | Counts | Sigma | Mean | Median | Sigma |
| A | 10 | 83 | 473298 | 3994.06 | 589 | 581 | 118.4 |
| A | 12 | 189 | 73831 | 618.9 | 589 | 581 | 118.4 |
| A | 2 | 79 | 45360 | 378.34 | 589 | 581 | 118.4 |
| B | 0 | 190 | 489570 | 4416.27 | 582 | 567 | 110.7 |
| B | 3 | 112 | 63556 | 568.86 | 582 | 567 | 110.7 |
| B | 0 | 230 | 36931 | 328.41 | 582 | 567 | 110.7 |
| C | 15 | 214 | 224732 | 1721.29 | 565 | 570 | 130.2 |
| C | 0 | 10 | 33629 | 253.85 | 565 | 570 | 130.2 |
| C | 14 | 254 | 7670 | 54.52 | 565 | 570 | 130.2 |
| D | 12 | 191 | 207578 | 1606.67 | 520 | 504 | 128.9 |
| D | 12 | 227 | 99745 | 770.0 | 520 | 504 | 128.9 |
| D | 13 | 249 | 83724 | 645.7 | 520 | 504 | 128.9 |
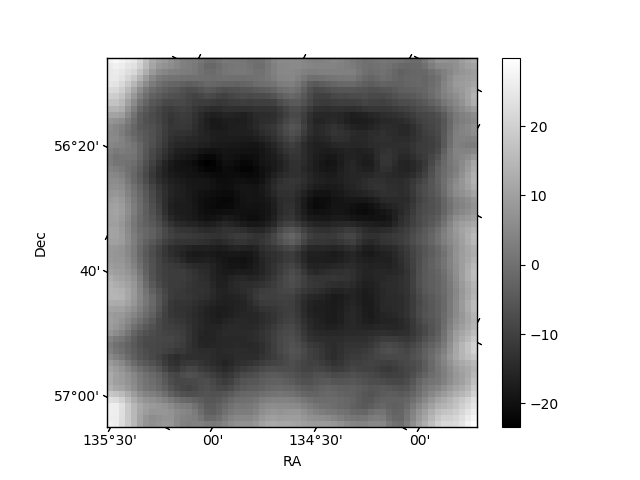
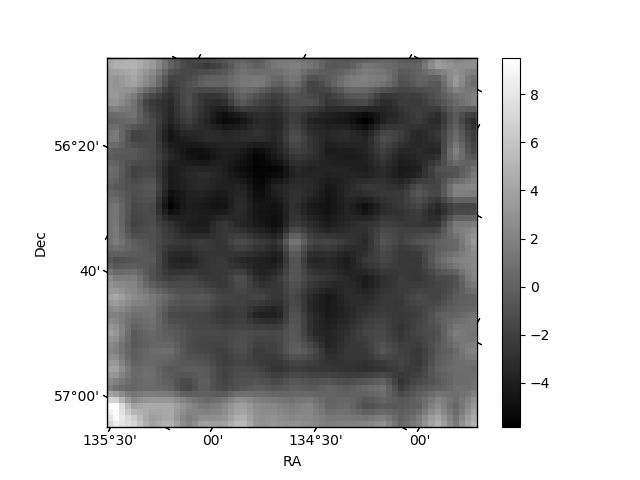
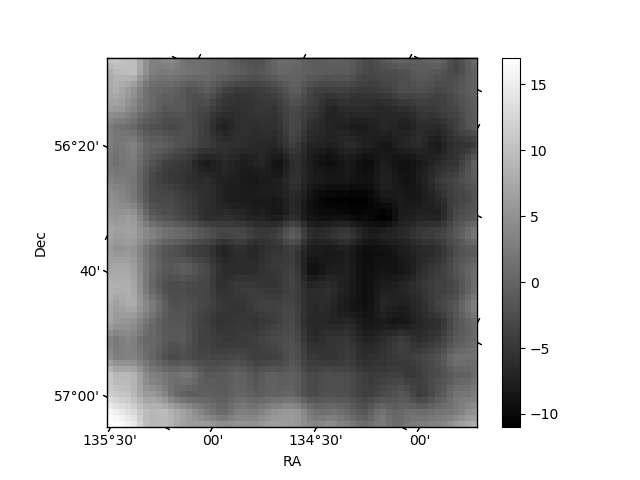
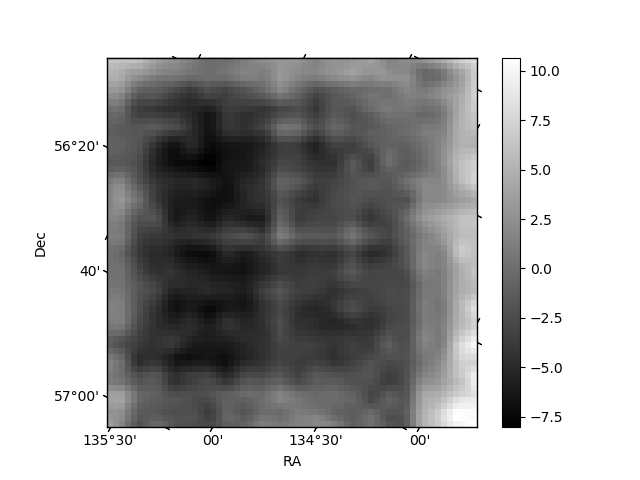
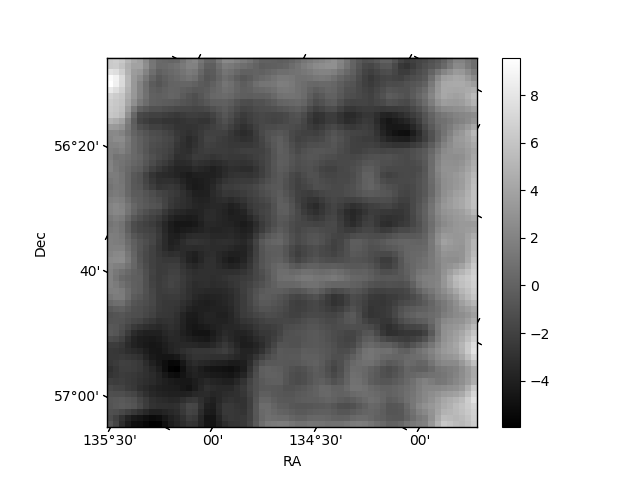
Histogram calculated using DETX and DETY for each event in the final _common_clean file
| Quadrant A | 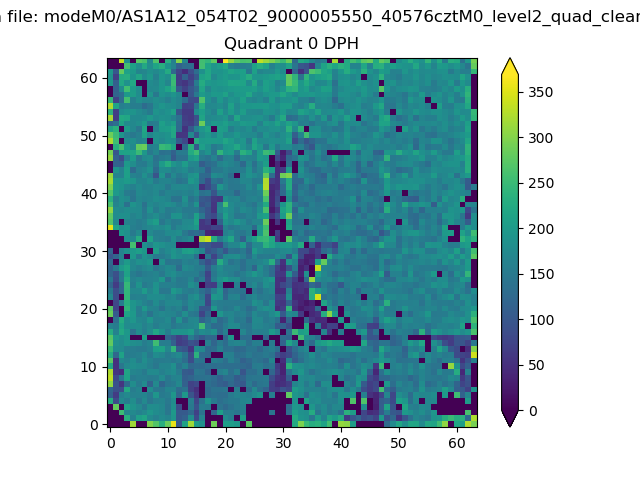 |
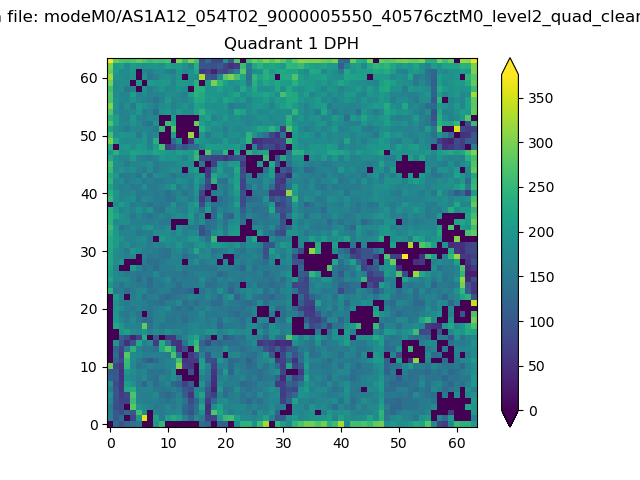 |
Quadrant B |
|---|---|---|---|
| Quadrant D | 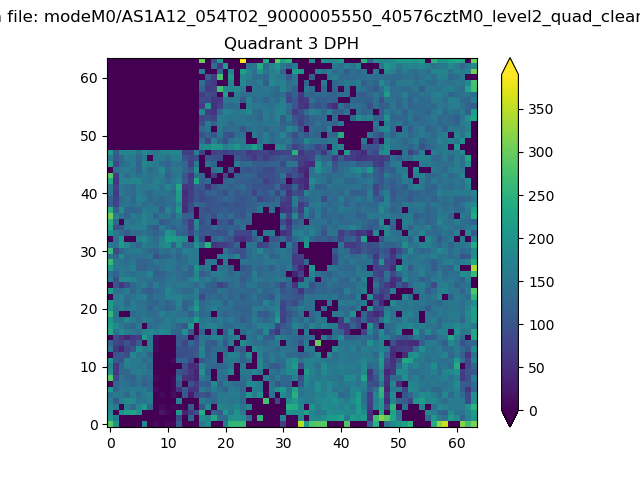 |
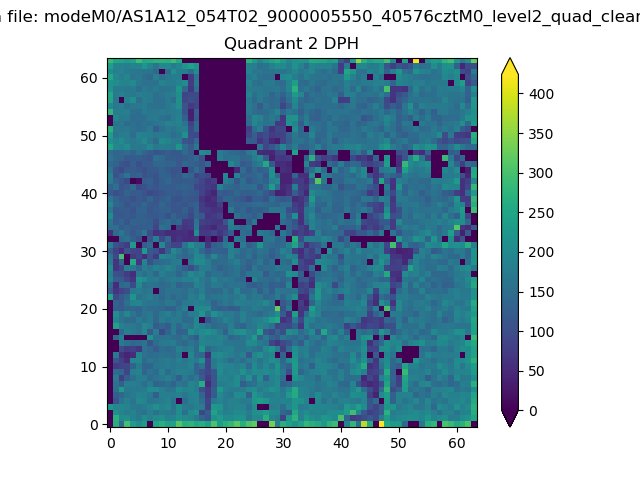 |
Quadrant C |
| Plot type | Count rate plots | Images |
|---|---|---|
| Comparison with Poisson distribution Blue bars denote a histogram of data divided into 1 sec bins. Red curve is a Poisson curve with rate = median count rate of data. |
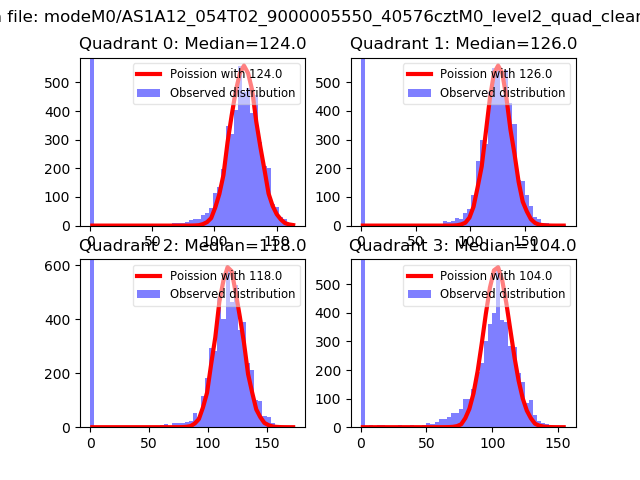 |
 |
| Quadrant-wise count rates Data is divided into 100 sec bins |
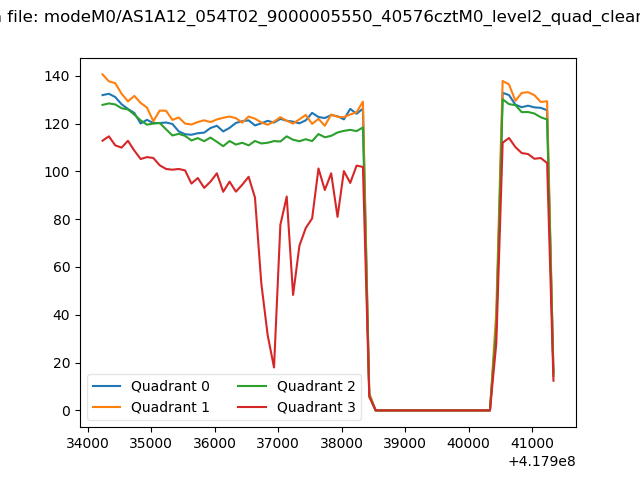 |
|
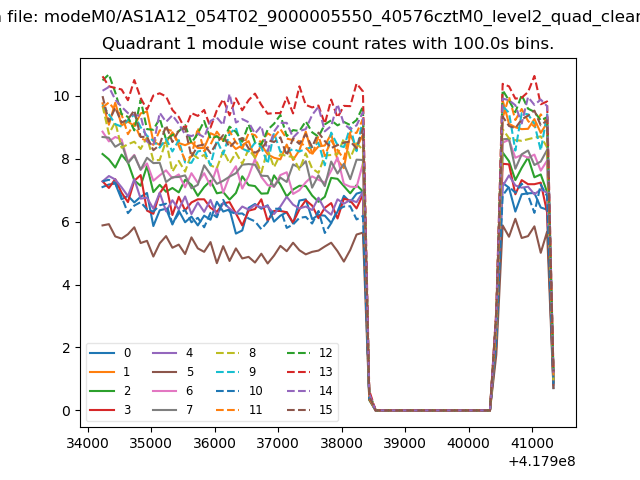
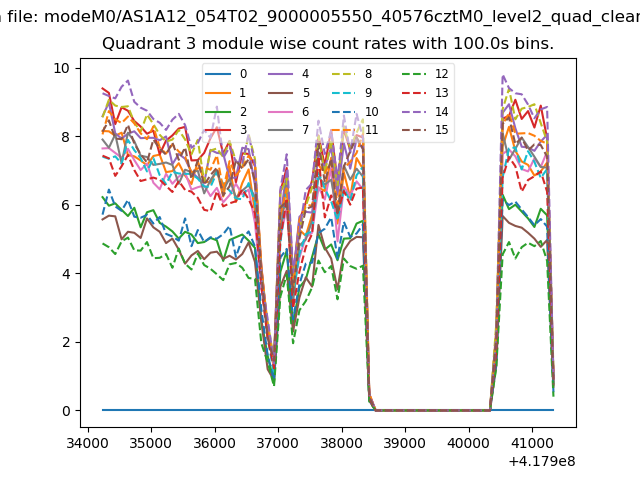
| Module-wise count rates for Quadrant A Data is divided into 100 sec bins |
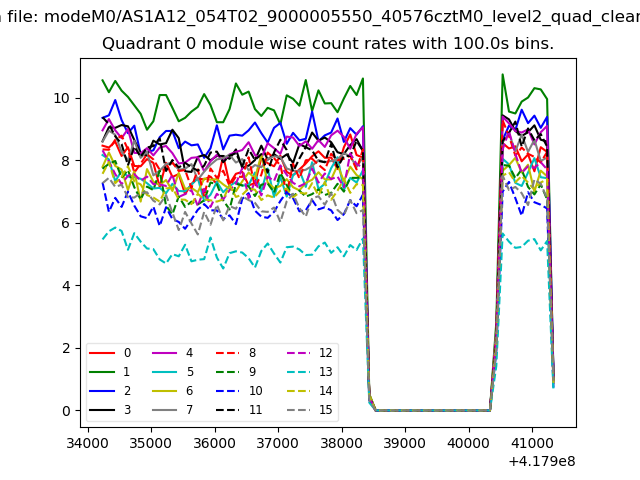 |
 |
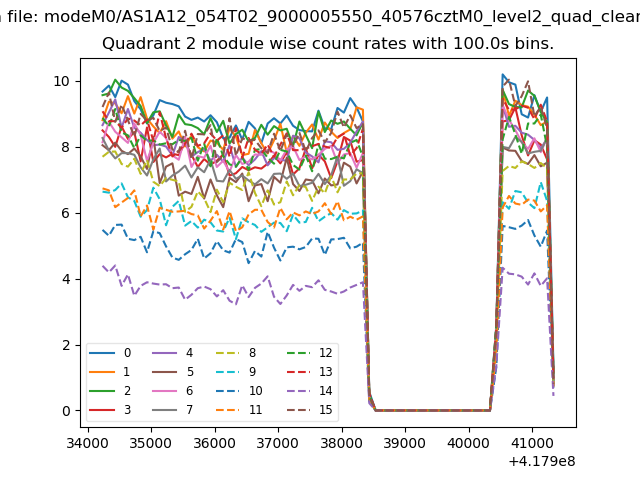
| Module-wise count rates for Quadrant B Data is divided into 100 sec bins |
 |
 |
| Module-wise count rates for Quadrant C Data is divided into 100 sec bins |
 |
 |
| Module-wise count rates for Quadrant D Data is divided into 100 sec bins |
 |
 |
| Parameter | Plot |
|---|---|
| CZT HV Monitor | 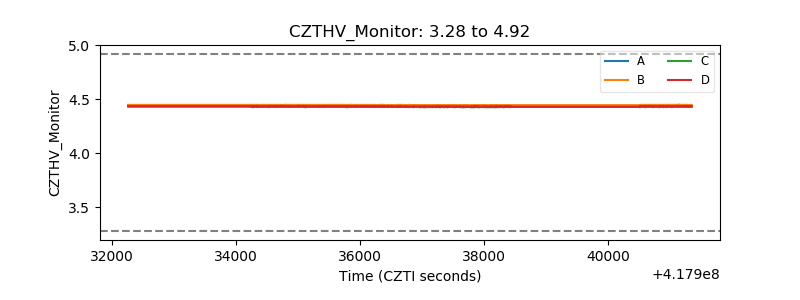 |
| D_VDD | 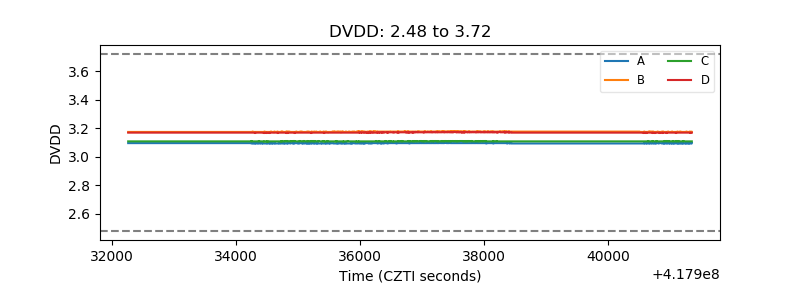 |
| Temperature 1 | 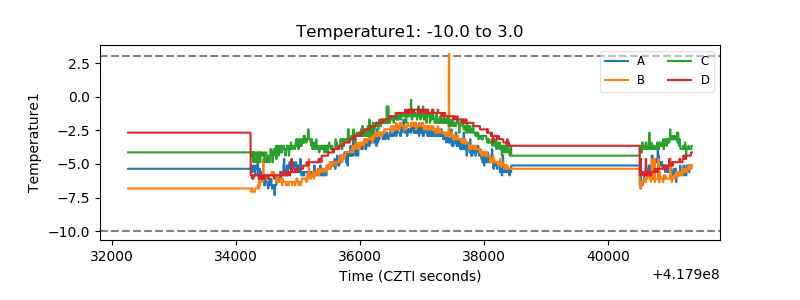 |
| Veto HV Monitor | 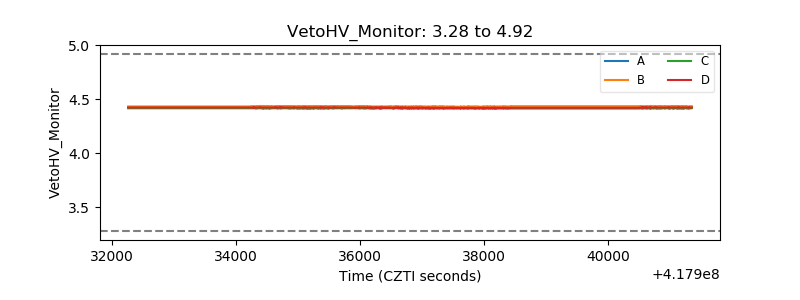 |
| Veto LLD | 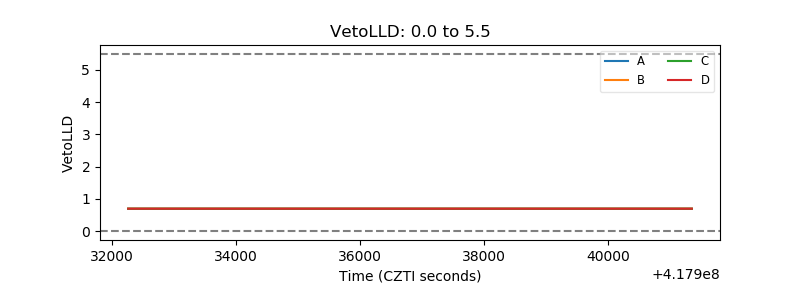 |
| Alpha Counter | 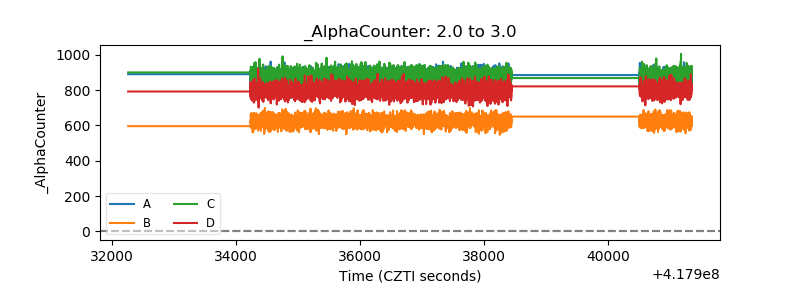 |
| _CPM_Rate | 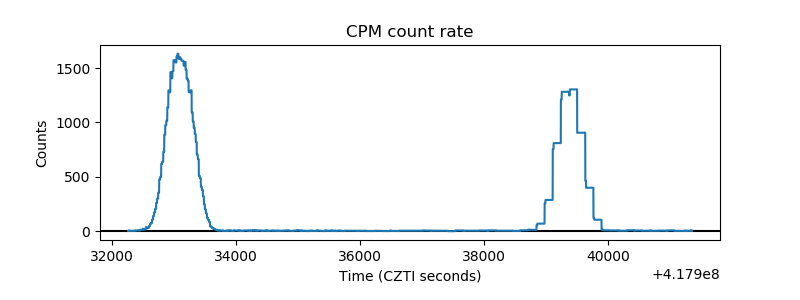 |
| CZT Counter | 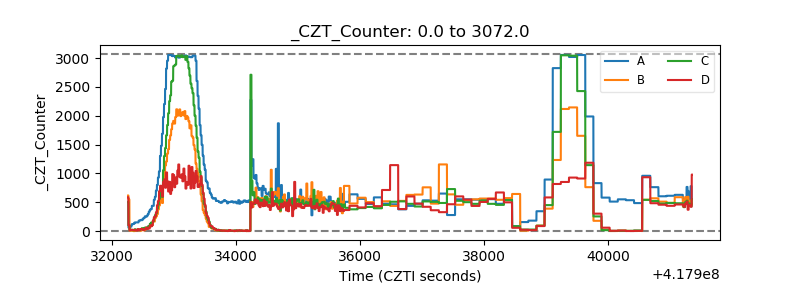 |
| +2.5 Volts monitor | 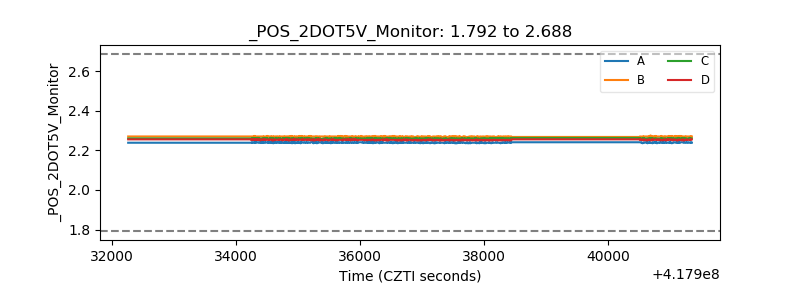 |
| +5 Volts monitor | 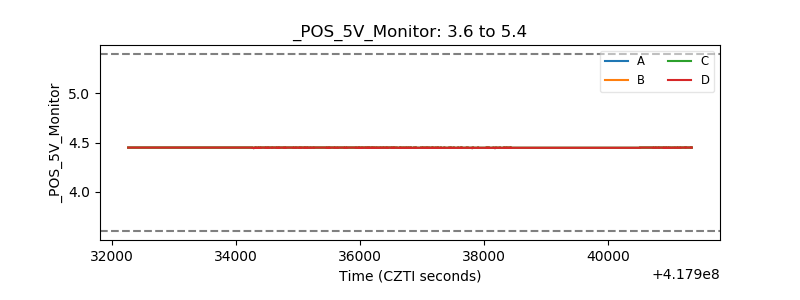 |
| _ROLL_ROT | 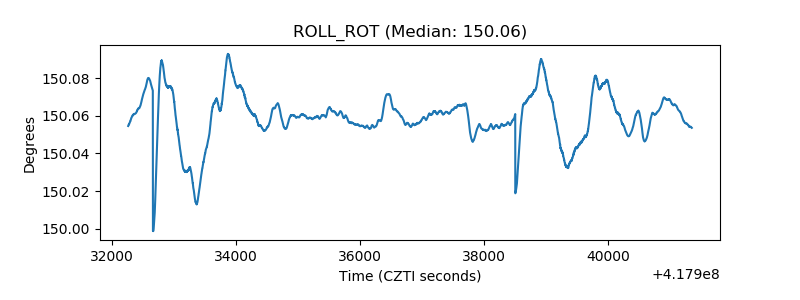 |
| _Roll_DEC | 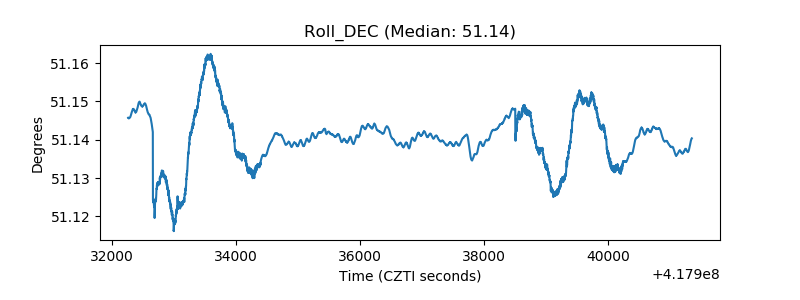 |
| _Roll_RA | 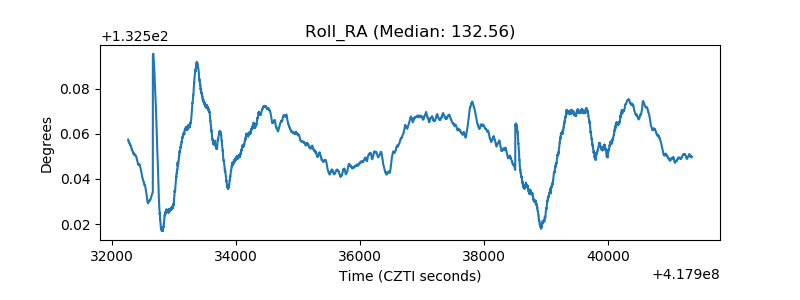 |
| Veto Counter | 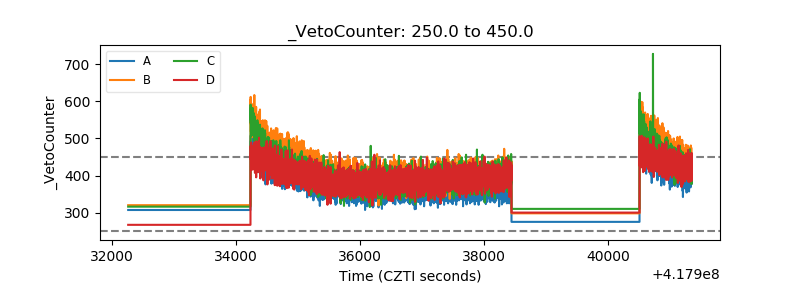 |